


目录
1、DBGWCR_EL1(Debug Watchpoint Control Registers)
2、DBGWVR_EL1(Debug Watchpoint Value Registers)
3、MDSCR_EL1(Monitor Debug System Control Register)
(代码:linux 6.3.1,架构:arm64)
One look is worth a thousand words. —— Tess Flanders
相关链接:
linux ptrace 图文详解(二) PTRACE_TRACEME 跟踪程序
linux ptrace 图文详解(三) PTRACE_ATTACH 跟踪程序
linux ptrace 图文详解(七) gdb、strace跟踪系统调用
在阅读本文内容之前,我们先思考下以下几个问题:
1)gdb 设置的硬断点,其触发时机是被探测指令执行之前、还是执行之后?
2)gdb 设置观察点时,针对不同大小的变量,如何设置观察的地址范围?
3)观察点触发时,gdb 如何知道触发异常的地址是设置的观察点地址?
4)gdb 设置观察点时,底层如何控制是 “读观察rwatch”、“写观察watch”、“读写观察awatch” ?
5)硬断点、观察点依赖的硬件寄存器是per-cpu的,如何保证不同任务在CPU上运行时,这些寄存器被正确设置?
一、硬断点、观察点 介绍
上文介绍了gdb软断点的实现原理,本文接着介绍 gdb中硬断点、观察点的底层实现原理,这两者也是比较常用的调试手段。不同于软断点需要修改程序的代码段内容,硬断点和观察点都是通过配置硬件debug寄存器,来使能硬断点和观察点的。
通过配置相关的debug寄存器,就能使能对应的观察点、硬断点,当程序执行到指定地址时,硬件会触发调试异常,打断被调试程序的执行流。
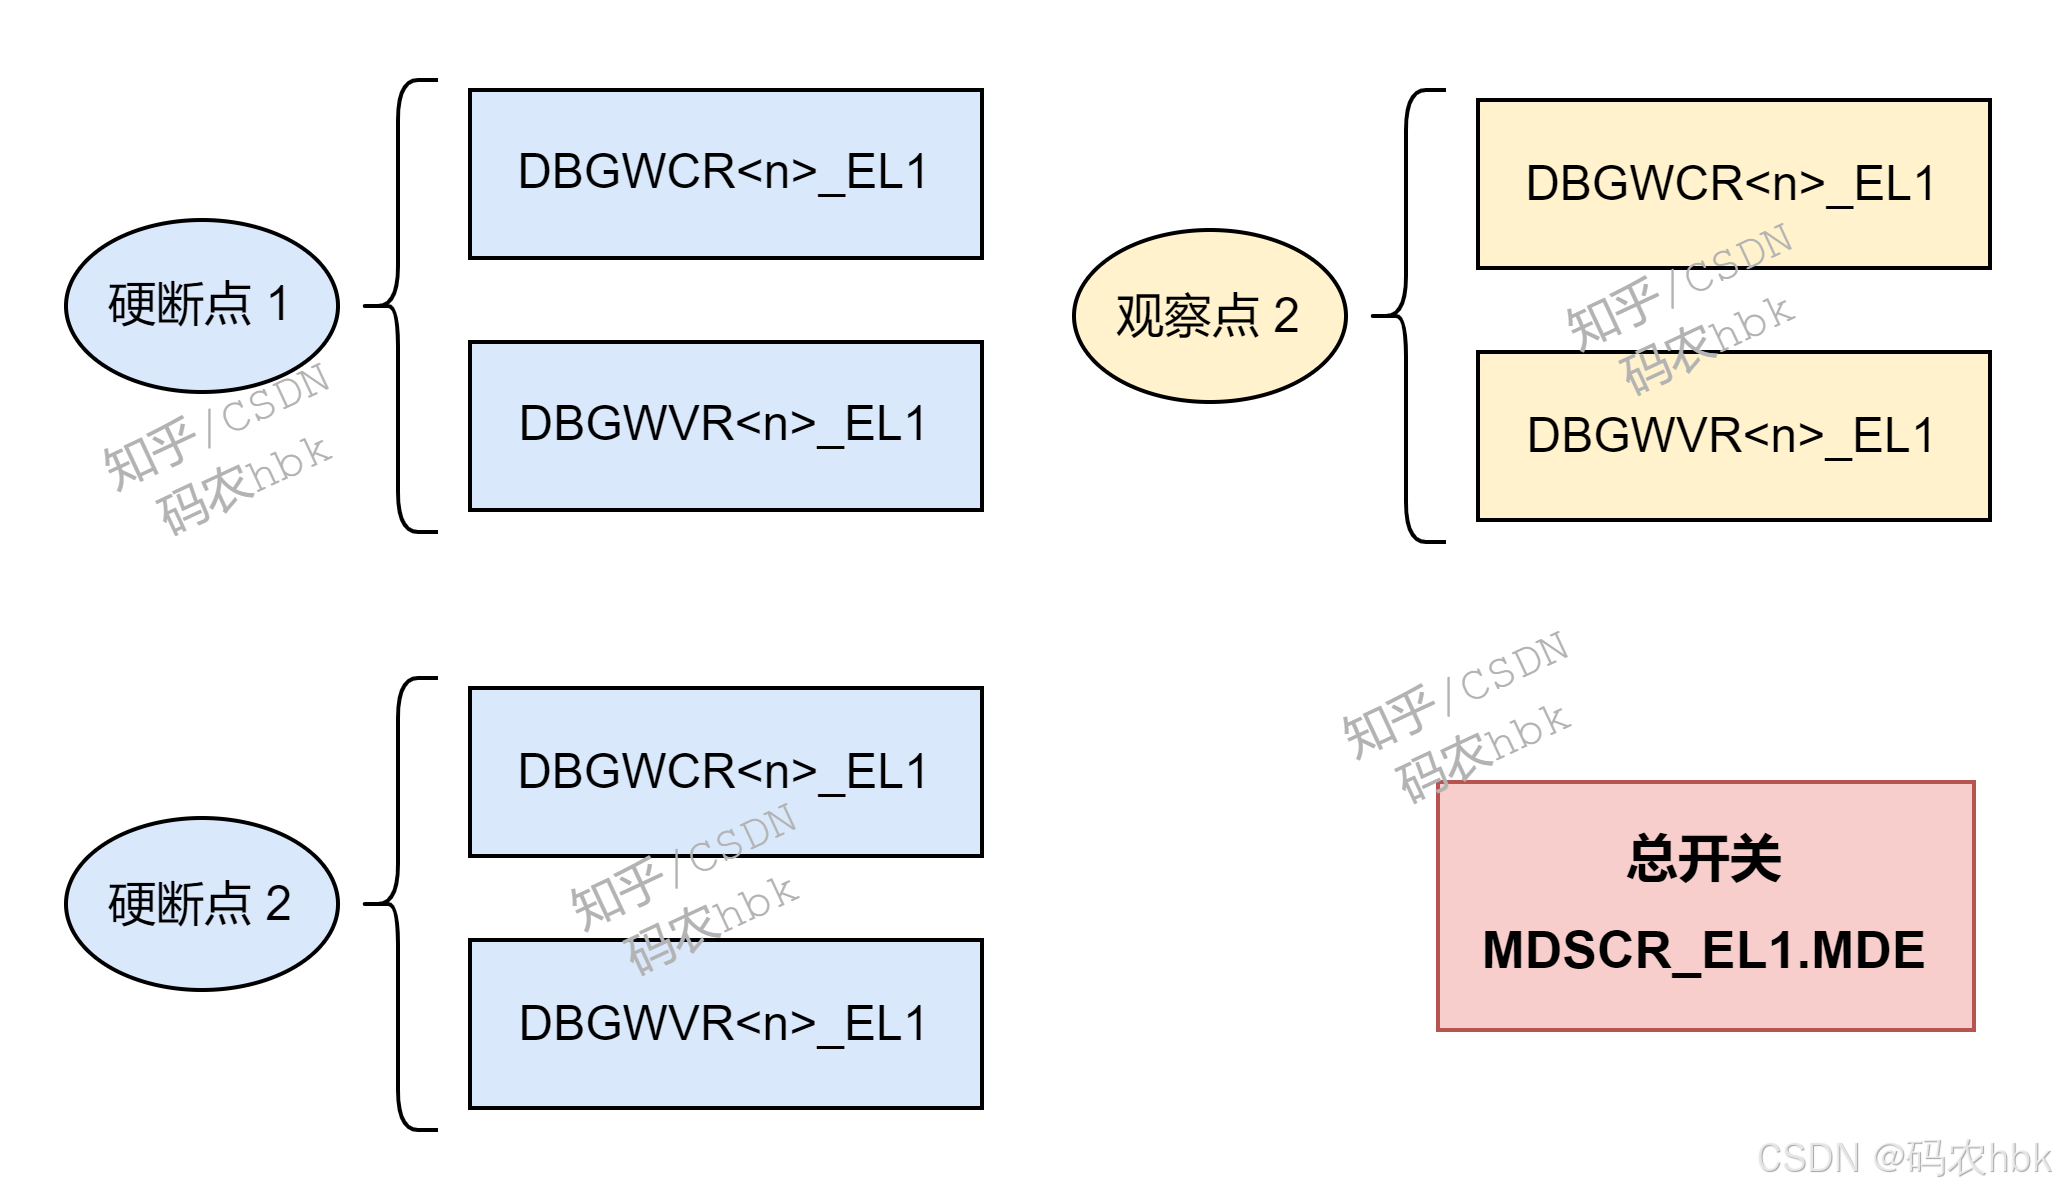
在armv8中,硬断点、观察点采用的是同一套寄存器:DBGWCR<n>_EL1(设置监控行为)、DBGWVR<n>_EL1(设置监控地址),这两个寄存器是硬断点、观察点实现的核心。
通过上述这两个寄存器,gdb可以配置硬断点、观察点的监控地址,以及观察行为。
举例说明,配置 1个 硬断点/观察点,需要一组DBGWCR<n>_EL1、DBGWVR<n>_EL1寄存器,大致如下图所示。并且除了这两个寄存器外,还有一个寄存器(MDSCR_EL1)作为使能硬断点、观察点的总开关。
二、ARM64 Debug 寄存器
ARMv8中,提供了一系列调试寄存器,GDB 硬断点、观察点的实现依赖于这些寄存器。这些寄存器允许开发者设置硬件断点和观察点,从而在特定地址执行或访问时触发调试异常。以下是这些寄存器的详细介绍:
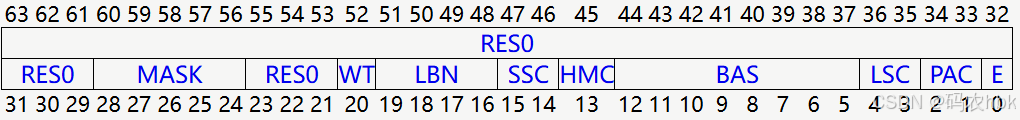
1、DBGWCR<n>_EL1(Debug Watchpoint Control Registers)
DBGWCR<n>_EL1寄存器,是per-cpu的寄存器,每个CPU都有一个;这个寄存器主要用于控制:观察点的观察地址范围、观察点使能控制、观察点类型(读、写、读写观察);
内核态、用户态设置观察点、硬断点时,都是使用的这个寄存器!
1.1) BAS(控制观察点监控的地址范围)
Byte address select. Each bit of this field selects whether a byte from within the word or double-word addressed by DBGWVR<n>_EL1 is being watched.
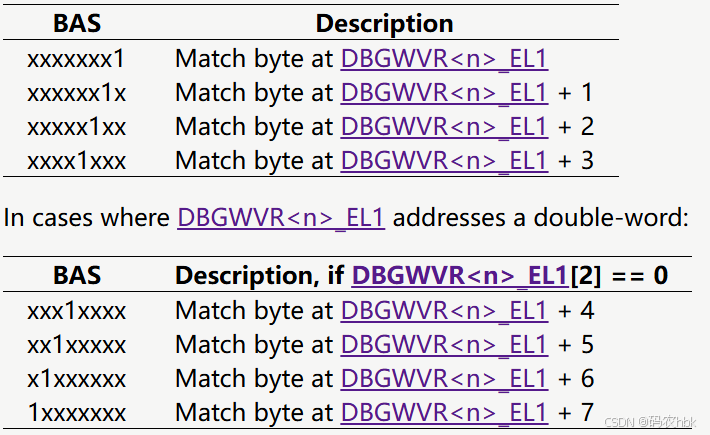
举例:假设对某个unsigned long类型的变量x,设置了一个观察点,那么底层在设置DBGWCR<n>_EL1寄存器的BAS字段是,就需要将BAS所在的8位内容都置1(即:11111111),代表监控x变量所在地址开始的8字节范围。同理,若观察点的变量是char类型的,那么BAS字段的值就是:00000001;
这也就解释了本文最开始的问题2,不同大小的变量设置观察点时,CPU观察的地址范围通过DBGWCR<n>_EL1.BAS字段来控制!
1.2) LSC(控制观察点类型,读、写、读写观察)
Load/store control. This field enables watchpoint matching on the type of access being made.
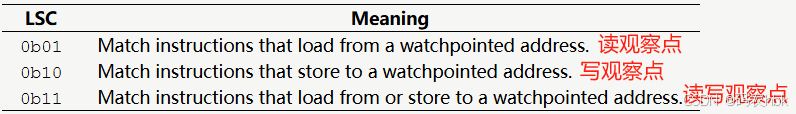
可以看出,我们gdb中使用的watch、rwatch、awatch这几种不同模式的观察点,是通过LSC这个字段来控制的!
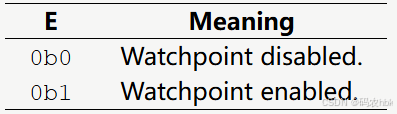
1.3) E (观察点使能控制位)
Enable watchpoint n.
2、DBGWVR<n>_EL1(Debug Watchpoint Value Registers)
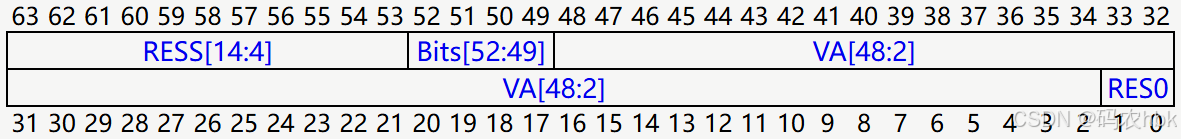
DBGWVR<n>_EL1寄存器,用于记录硬断点、观察点的地址;如:gdb针对某个函数入口设置硬断点时,最终被调试程序运行时,会将所在CPU中该debug寄存器的值设置为断点处的虚拟地址。

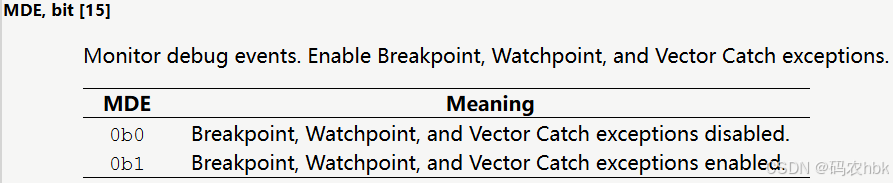
3、MDSCR_EL1(Monitor Debug System Control Register)
除了上述2个debug寄存器(DBGWVR<n>_EL1、DBGWCR<n>_EL1),还需配置MDSCR_EL1寄存器中相应位,才能最终使能硬断点、观察点。(实际上,单步调试也是依赖于这个寄存器,详见后续文章)

MDE:控制用户态的硬断点、观察点是否使能;
4、ID_AA64DFR0_EL1
SOC所支持的 DBGWCR<n>_EL1、DBGWVR<n>_EL1寄存器 数量,可以通过 ID_AA64DFR0_EL1寄存器获取。
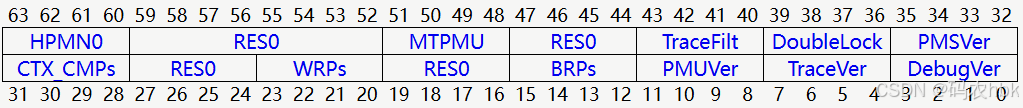
WRPs:soc上支持的观察点寄存器数量;

BRPs:soc上支持的硬断点寄存器数量;
![]()
三、硬断点、观察点 实现原理
实际上,在gdb、内核中,设置观察点、硬断点都是使用的ptrace(PTRACE_SETREGSET),只不过区别在于传递的用于设置DBGWCR<n>_EL1寄存器的data有所不同,其余的流程都一致。
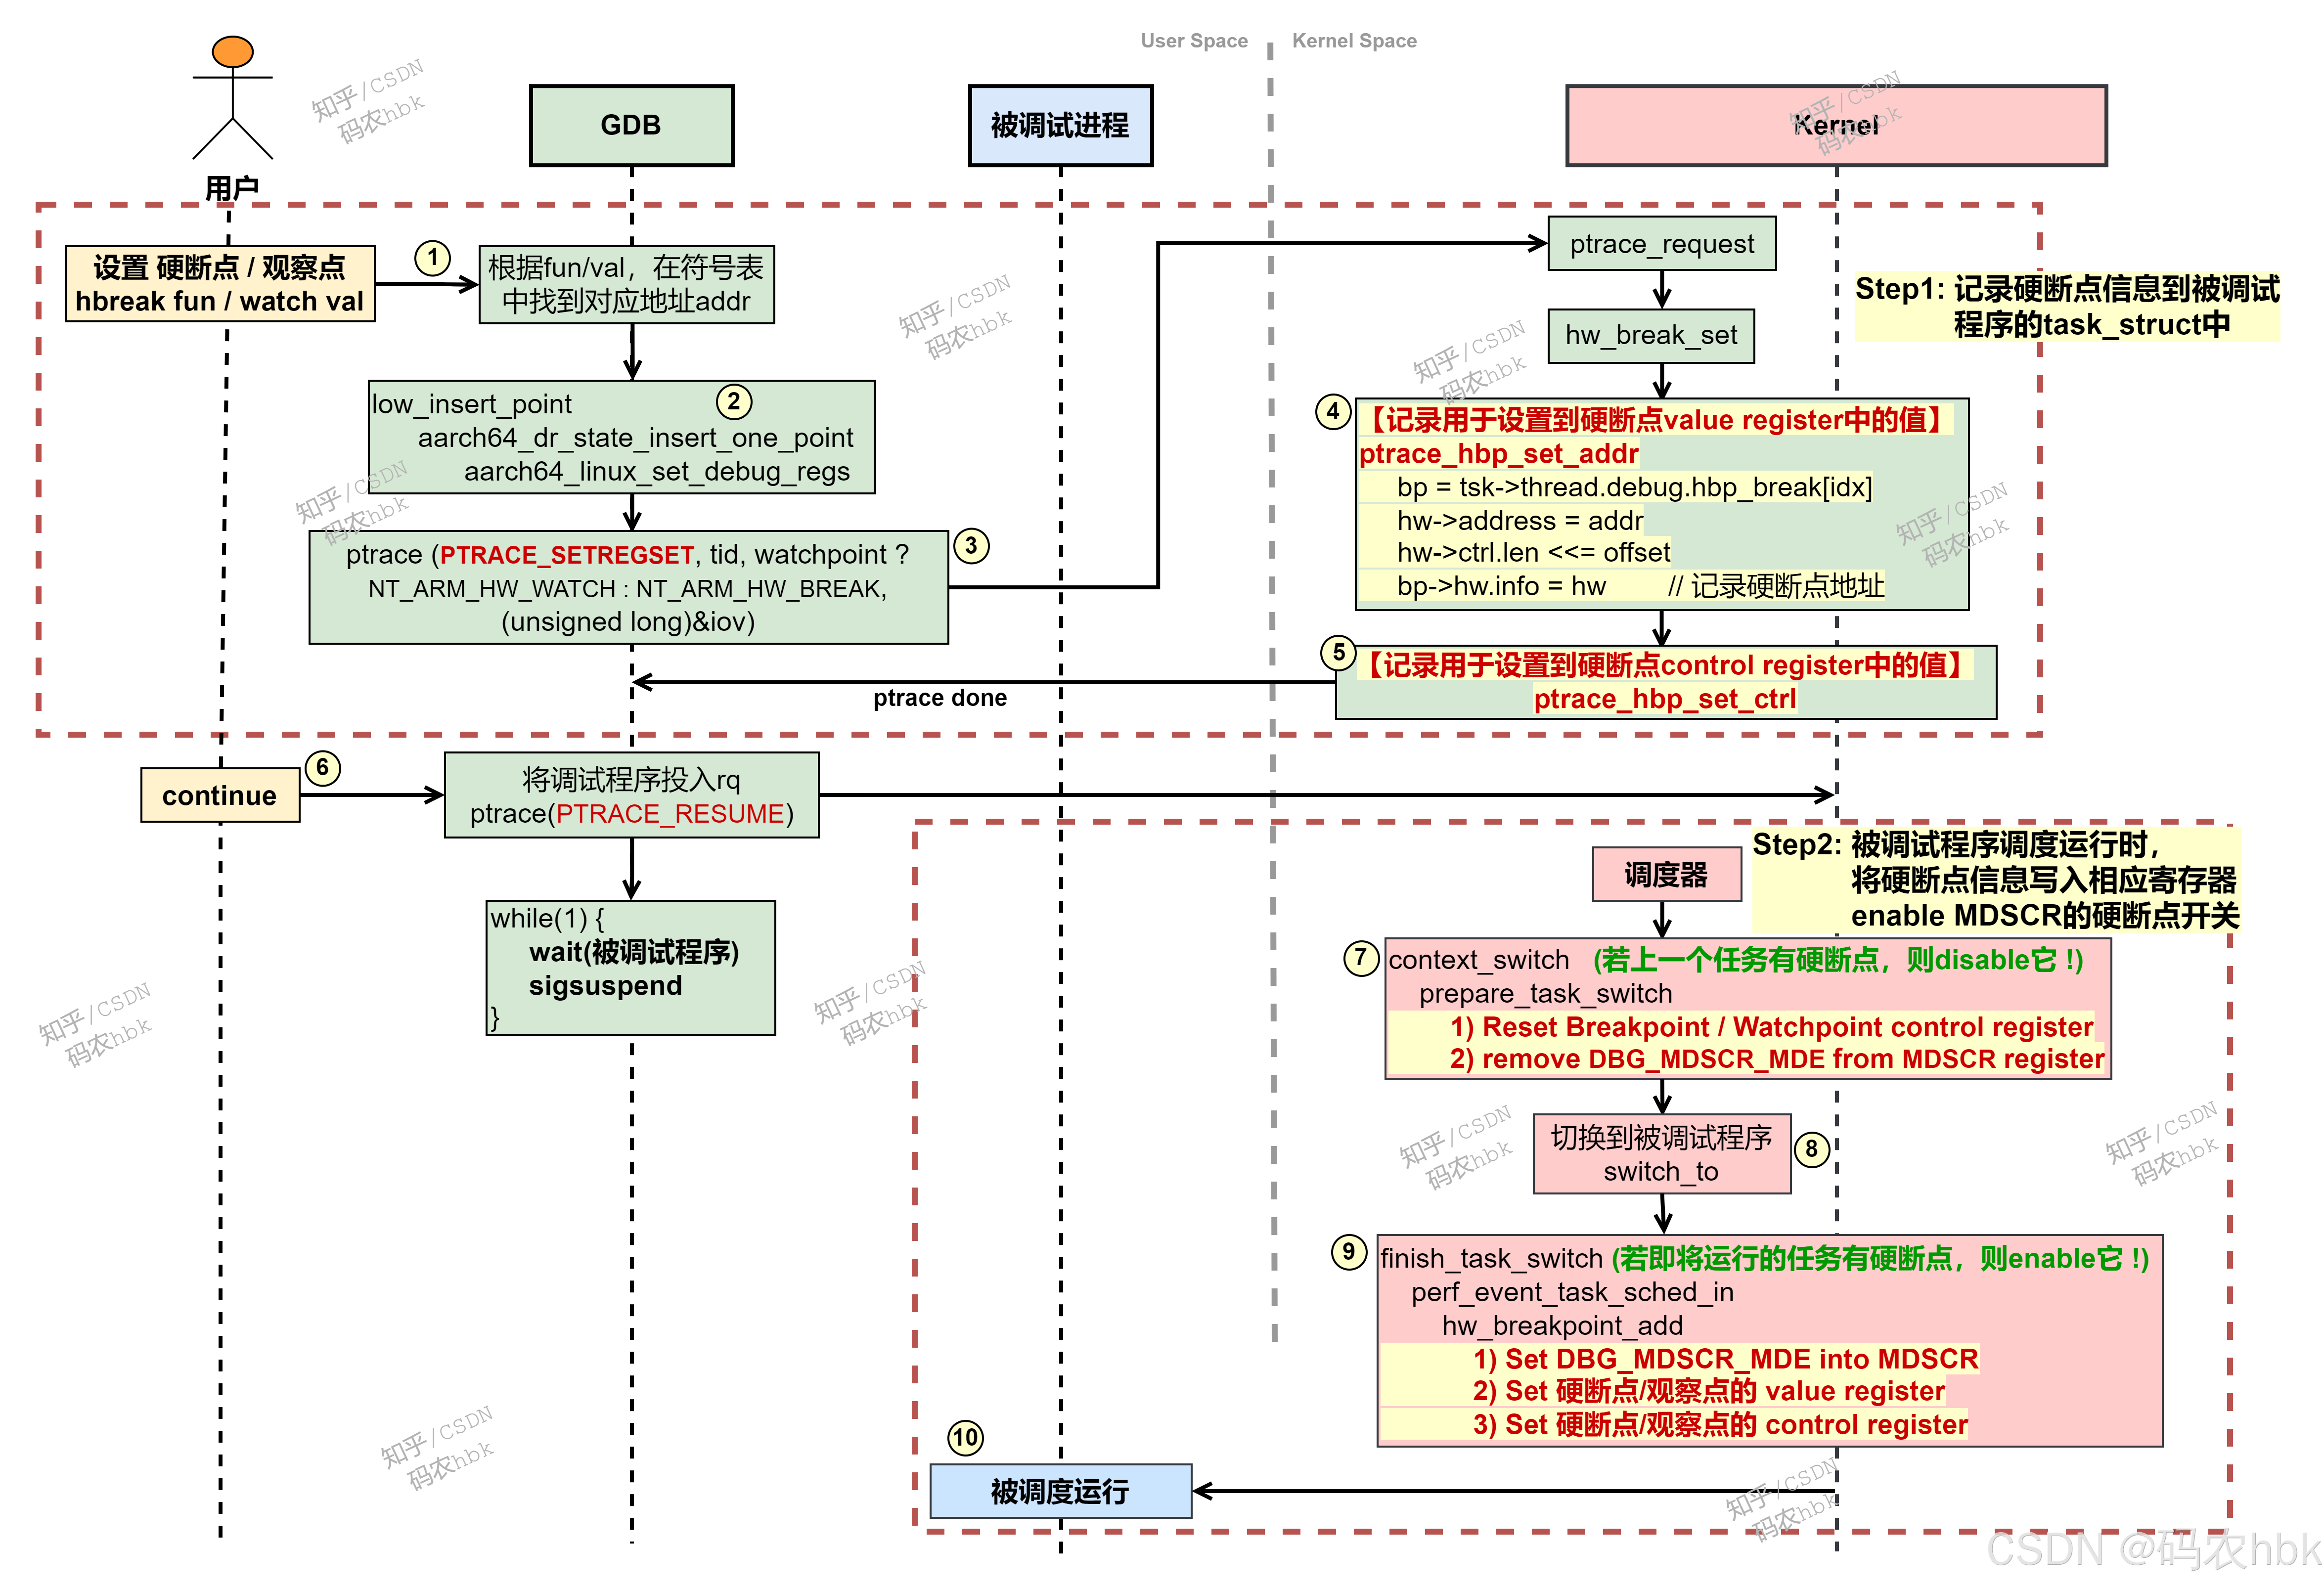
1)用户使用hbreak、watch、awatch等指令,设置硬断点、观察点,gdb根据加载的ELF中调试信息,找到断点处的虚拟地址;
2)gdb根据用户请求的硬断点、观察点类型,设置armv8架构中debug寄存器的内容,并记录到 iov对象 中;
3)gdb调用ptrace(PTRACE_SETREGSET)系统调用,将iov对象作为参数调用到内核中;
4)在内核中,对iov数据内容进行一些必要的检查,然后通过ptrace_hbp_set_addr函数,将要监控的地址信息(即:DBGWVR_EL1)记录到 “被调试进程的task_struct->thread.debug.hbp_break数组元素” 中;
5)通过ptrace_hbp_set_ctrl,将 硬断点/观察点 的控制信息(即:DBGWCR_EL1)记录到 “被调试进程的task_struct->thread.debug.hbp_break数组元素” 中,至此gdb的ptrace调用完成并返回;
6)用户执行continue命令,gdb通过ptrace(PTRACE_RESUME)系统调用,陷入内核将被调试进程唤醒并加入到就绪队列中,等待调度器选择运行;
7)当调度器选择到被调试程序进行运行时,执行context_switch的时候,会检查pre_task上是否注册了硬断点/观察点,若注册了话则先重置debug寄存器(DBGWCR、DBGWVR)的内容,并清除MDSCR_EL1寄存器中的MDE位;
8)执行switch_to完成CPU上的任务切换;
9)检查即将运行任务next_task上,是否注册了硬断点/观察点信息,若注册了话,读取任务的hbp_break数组中的内容,并将其通过msr指令设置到相应的debug寄存器(DBGWVR、DBGWCR)中;
10)任务切换完成后,返回到用户态执行被调试程序。至此,gdb针对被调试程序设置的硬断点/观察点就已生效!
综上:
(1)硬断点、观察点需要设置的寄存器内容,是gdb内部已经计算好的,ptrace(PTRACE_SETREGSET)系统调用仅仅是将gdb计算好的寄存器内容传递到内核中,经过一些必要的检查后保存到被调试进程的task_struct中(即:task->thread.debug.hbp_break)。
(2) 硬断点、观察点真正的起作用时机:是在内核任务调度前后,将被调度任务上设置的观察点、硬断点寄存器信息,写入真实debug寄存器(DBGWVR、DBGWCR)中,并通过开启MDSCR.MDE总开关,最后返回到用户态被调试程序继续运行,此时该程序上设置的硬断点、观察点就都已经处于生效状态了!
(3)硬断点/观察点的本质:程序被调度运行时,设置对应的debug寄存器;
(4)由于debug 寄存器是per-cpu的,所以每次调度的时候,都需要针对pre_task、next_task上是否记录硬断点/观察点信息进行处理,保证debug寄存器中设置的内容属于当前CPU上运行的task!
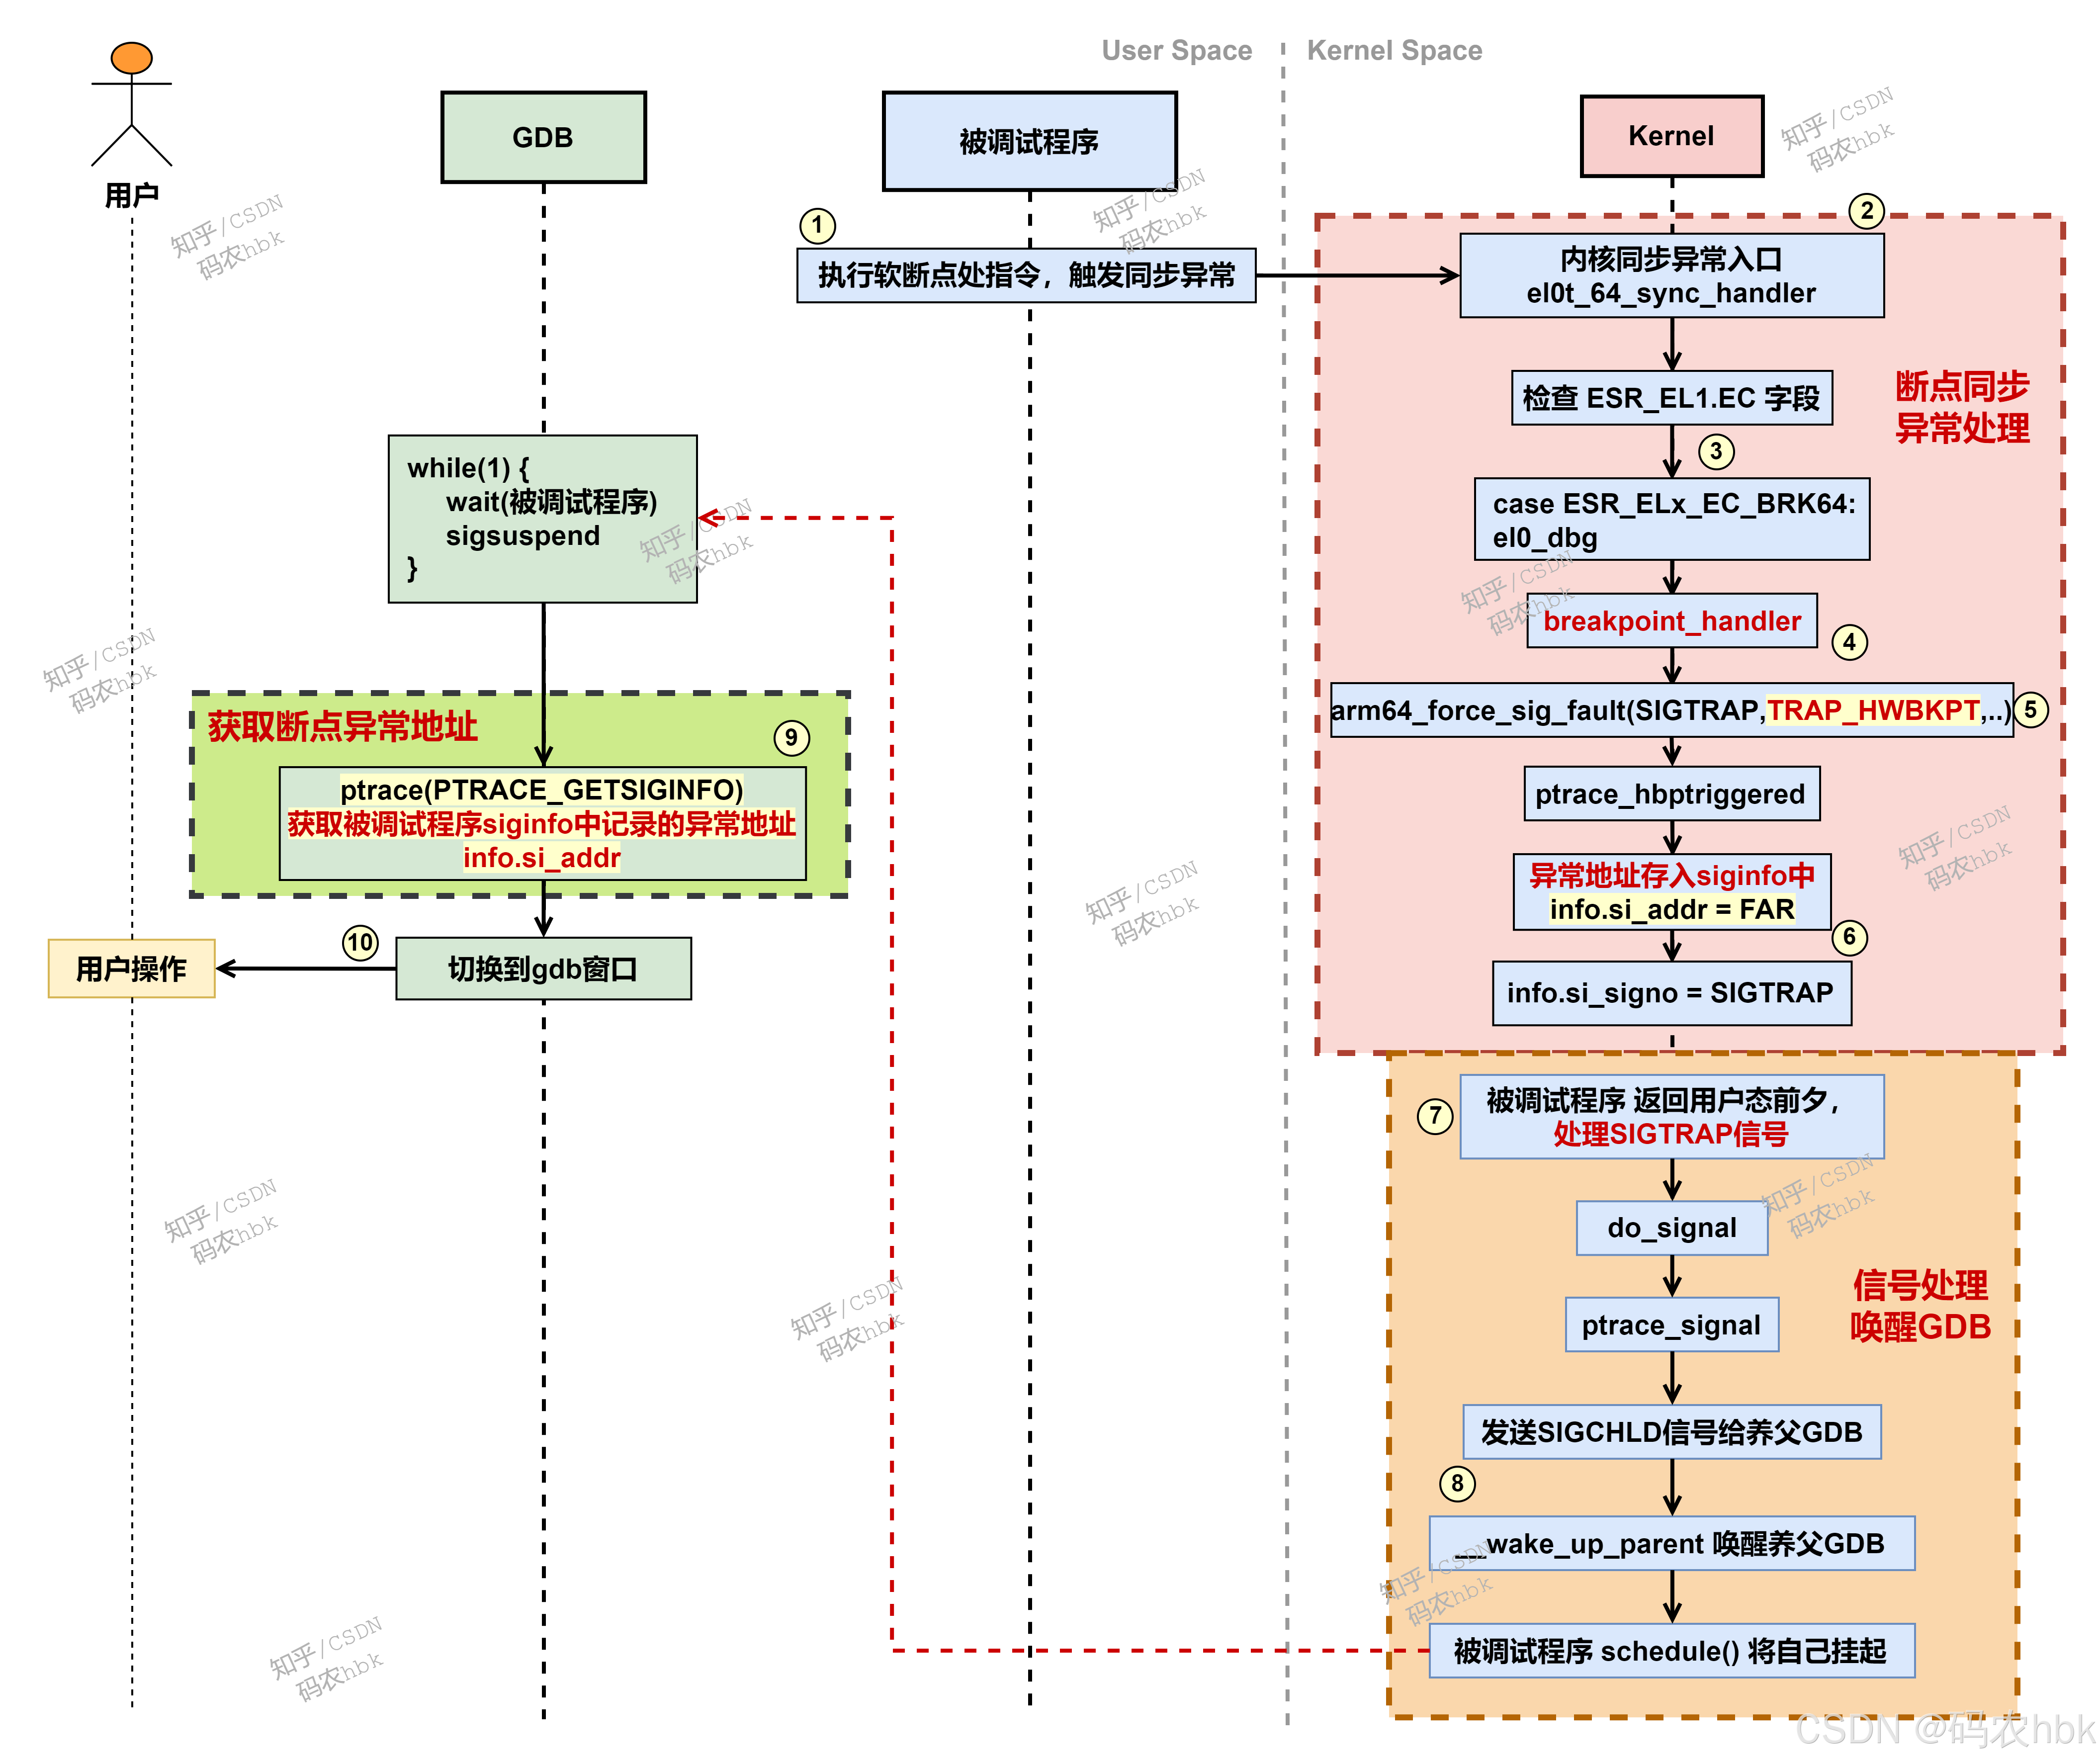
四、硬断点、观察点 触发后的处理流程
硬断点、观察点触发后的处理流程时机上与前文中的软断点触发后的处理流程类似,硬断点、观察点触发后,硬件同样会产生一个BRK64的同步异常;与软断点触发后处理流程不同的是:内核中设置到task上的siginfo.si_code是TRAP_HWBKPT,gdb获取到这个信息后,就知道被调试程序是由于硬断点/观察点触发的异常并且暂停下来的。
五、代码实现
1、hw breakpoint insert in gdb (gdb计算硬断点/观察点寄存器内容的过程)
aarch64_target::low_insert_point(enum raw_bkpt_type type = raw_bkpt_type_hw,
CORE_ADDR addr = addr,
int len = 4,
struct raw_breakpoint *bp = NULL,
int idx = 0)
struct aarch64_debug_reg_state *state = &g_state
targ_type = raw_bkpt_type_to_target_hw_bp_type (type)
switch (raw_type)
case raw_bkpt_type_hw:
return hw_execute
if (len == 3)
/* LEN is 3 means the breakpoint is set on a 32-bit thumb instruction. Set it to 2 to correctly encode length bit mask in hardware/watchpoint control register. */
len = 2
aarch64_handle_breakpoint(enum target_hw_bp_type type = targ_type,
CORE_ADDR addr = addr,
int len = len,
int is_insert = 1,
ptid_t ptid = current_lwp_ptid(),
struct aarch64_debug_reg_state *state = state,
int idx = idx)
aarch64_dr_state_insert_one_point(ptid_t ptid = ptid,
struct aarch64_debug_reg_state *state = state,
enum target_hw_bp_type type = type,
CORE_ADDR addr = addr,
int offset = 0,
int len = len, // len = 4
CORE_ADDR addr_orig = -1,
int idx = idx) {
unsigned int ctrl, *dr_ctrl_p, *dr_ref_count
CORE_ADDR *dr_addr_p
dr_addr_p = state->dr_addr_bp
dr_ctrl_p = state->dr_ctrl_bp
dr_ref_count = state->dr_ref_count_bp
ctrl = aarch64_point_encode_ctrl_reg (enum target_hw_bp_type type = type, int offset = offset, int len = len) {
unsigned int ctrl, ttype = 0
switch (type)
case hw_execute:
ttype = 0 // ctrl: 0b00000000
ctrl = ttype << 3 // ctrl: 0b00000000
ctrl |= ((1 << len) - 1) << (5 + offset)/* offset and length bitmask */ // ctrl: 0b00000001 11100000
ctrl |= (2 << 1) | 1 /* enabled at el0, (2 << 1) | 1: 0b0101 */ // ctrl: 0b00000001 11100101 (0x1e5)
return ctrl
}
dr_addr_p[idx] = addr
dr_ctrl_p[idx] = ctrl
dr_ref_count[idx] = 1
aarch64_linux_set_debug_regs(struct aarch64_debug_reg_state *state = state, int tid = ptid, int watchpoint = 0)
struct iovec iov
struct user_hwdebug_state regs
const CORE_ADDR *addr
const unsigned int *ctrl
iov.iov_base = ®s // iov_base指向reg
count = watchpoint ? aarch64_num_wp_regs : aarch64_num_bp_regs // 假设是breakpoint
addr = watchpoint ? state->dr_addr_wp : state->dr_addr_bp
ctrl = watchpoint ? state->dr_ctrl_wp : state->dr_ctrl_bp
iov.iov_len = (offsetof (struct user_hwdebug_state, dbg_regs) + count * sizeof (regs.dbg_regs[0])) // 8 + 16 * 16 = 264
for (i = 0; i < count; i++)
regs.dbg_regs[i].addr = addr[i]
regs.dbg_regs[i].ctrl = ctrl[i]
ptrace (PTRACE_SETREGSET, tid, watchpoint ? NT_ARM_HW_WATCH : NT_ARM_HW_BREAK, (unsigned long)&iov)
}2、内核中记录debug寄存器内容的相关数据结构
struct arch_hw_breakpoint_ctrl {
	u32 __reserved	: 19,
	len		: 8,
	type		: 2,
	privilege	: 2,
	enabled		: 1;
};

/* linux中记录硬断点,观察点的结构体 */
struct arch_hw_breakpoint {
	u64 address;							// 硬断点,观察点地址
	u64 trigger;							// 触发硬断点,观察点异常时, 用户态程序的运行地址
	struct arch_hw_breakpoint_ctrl ctrl;	// 硬断点观察点 control register的值
};

struct debug_info {
#ifdef CONFIG_HAVE_HW_BREAKPOINT
	/* Have we suspended stepping by a debugger? */
	int			suspended_step;
	/* Allow breakpoints and watchpoints to be disabled for this thread. */
	int			bps_disabled;
	int			wps_disabled;
	/* Hardware breakpoints pinned to this task. */
	struct perf_event	*hbp_break[ARM_MAX_BRP];
	struct perf_event	*hbp_watch[ARM_MAX_WRP];
#endif
};

struct thread_struct {
	struct cpu_context	cpu_context;	/* cpu context */
	...
	unsigned long		fault_address;	/* fault info */
	unsigned long		fault_code;	/* ESR_EL1 value */
	struct debug_info	debug;		/* debugging */
	...
};
3、ptrace(PTRACE_SETREGSET) 内核实现
ptrace_request(ktask_t *child, long request, unsigned long addr, unsigned long data) {
	switch (request) {
	case PTRACE_SETREGSET:
		struct iovec kiov
		struct iovec __user *uiov = datavp

		copy_from_user(&kiov.iov_base, &uiov->iov_base, sizeof(uiov->iov_base))
		copy_from_user(&kiov.iov_len, &uiov->iov_len, sizeof(uiov->iov_len))

		ret = ptrace_regset(child, request, unsigned int type = addr, &kiov)
			const struct user_regset_view *view = task_user_regset_view(task)
				return &user_aarch64_view

			const struct user_regset *regset = find_regset(view, type)
				for (n = 0; n < view->n; ++n) {
					regset = view->regsets + n;
					if (regset->core_note_type == type)
						return regset;
				}

			if (req == PTRACE_SETREGSET)
				copy_regset_from_user(ktask_t *target         = task,
				                      const struct user_regset_view *view = view,
									  unsigned int setno      = regset_no,
									  unsigned int offset     = 0,
									  unsigned int size       = kiov->iov_len,
									  const void __user *data = kiov->iov_base)
					regset = &view->regsets[setno]
					regset->set(target, regset, offset, size, NULL, data)
					A.K.A
					hw_break_set(ktask_t *target = target,
								 const struct user_regset *regset = regset,
								 unsigned int pos	     = offset,
								 unsigned int count      = size,
                                 const void *kbuf        = NULL,
								 const void __user *ubuf = data)
					{
						unsigned int note_type = regset->core_note_type
						u32 ctrl
						u64 addr

						offset = offsetof(struct user_hwdebug_state, dbg_regs)				// 8
						ret = user_regset_copyin_ignore(unsigned int *pos   = &pos,			// 0
														unsigned int *count = &count,		// 264  a.k.a: kiov->iov_len
														const void **kbuf   = &kbuf, 		// NULL
														const void **ubuf   = &ubuf,		// kiov->iov_base
														const int start_pos = 0,			// 0
														const int end_pos   = offset)		// 8  a.k.a: offsetof(struct user_hwdebug_state, dbg_regs)
							if (*count == 0)
								return 0
							if (end_pos < 0 || *pos < end_pos)
								unsigned int copy = (end_pos < 0 ? *count : min(*count, end_pos - *pos)) = min(*count, end_pos - *pos) = 8
								if (*kbuf)
									*kbuf += copy
								else
									*ubuf += copy			// kiov->iov_base + 8 (将入参指针ubuf指向的data地址后移8字节)
								*pos += copy				// 8
								*count -= copy				// 256

						limit = regset->n * regset->size	// limit 264, n 66, size 4

						while (count && offset < limit)
						{
							user_regset_copyin(unsigned int *pos   = &pos,							// kiov->iov_base + 8
											   unsigned int *count = &count,						// 256
											   const void **kbuf   = &kbuf,							// NULL
											   const void **ubuf   = &ubuf,							//
											   void *data          = &addr,
											   const int start_pos = offset,
											   const int end_pos   = offset + PTRACE_HBP_ADDR_SZ)	// #define PTRACE_HBP_ADDR_SZ	sizeof(u64)
							{
								if (*count == 0)
									return 0
								if (end_pos < 0 || *pos < end_pos)
									unsigned int copy = (end_pos < 0 ? *count : min(*count, end_pos - *pos))
									data += *pos - start_pos
									if (*kbuf)
										memcpy(data, *kbuf, copy)
										*kbuf += copy
									else if (__copy_from_user(data, *ubuf, copy))
										return -EFAULT
									else
										*ubuf += copy
									*pos += copy
									*count -= copy
							}

							ptrace_hbp_set_addr(note_type, struct task_struct *tsk = target, idx, addr)
							{
								struct perf_event_attr attr
								struct perf_event *bp = ptrace_hbp_get_initialised_bp(note_type, tsk, idx) {
									struct perf_event *bp = ptrace_hbp_get_event(note_type, tsk, idx)
										switch (note_type)
										case NT_ARM_HW_BREAK:
											idx = array_index_nospec(idx, ARM_MAX_BRP)
											bp = tsk->thread.debug.hbp_break[idx]
											return bp

									if (!bp) {
										bp = ptrace_hbp_create(note_type, tsk, idx) {
											switch (note_type)
											case NT_ARM_HW_BREAK:
												type = HW_BREAKPOINT_X
											case NT_ARM_HW_WATCH
												type = HW_BREAKPOINT_RW

											ptrace_breakpoint_init(&attr)
												hw_breakpoint_init(attr)
													attr->type = PERF_TYPE_BREAKPOINT
													attr->size = sizeof(*attr)
													attr->pinned = 1
													attr->sample_period = 1
												attr->exclude_kernel = 1

											attr.bp_addr	= 0
											attr.bp_len	    = HW_BREAKPOINT_LEN_4
											attr.bp_type	= type  				// HW_BREAKPOINT_X
											attr.disabled	= 1

											bp = register_user_hw_breakpoint(&attr, triggered = ptrace_hbptriggered, NULL, tsk) {
												perf_event_create_kernel_counter(attr, -1, tsk, overflow_handler = triggered, context)
													event = perf_event_alloc(attr, cpu, task, NULL, NULL, overflow_handler, context, -1)
														struct perf_event *event = kmem_cache_alloc_node(perf_event_cache,...)
														event->attr		= *attr
														event->overflow_handler	= overflow_handler (A.K.A ptrace_hbptriggered)		<<<<<  hw breakpoint callback fun
														...
														return event
													perf_install_in_context(ctx, event, event->cpu)
											}
											ptrace_hbp_set_event {
												switch (note_type)
													case NT_ARM_HW_BREAK:
														idx = array_index_nospec(idx, ARM_MAX_BRP)
														tsk->thread.debug.hbp_break[idx] = bp					//  Set hardware breakpoint info into task's thread
													case NT_ARM_HW_WATCH:
														idx = array_index_nospec(idx, ARM_MAX_WRP)
														tsk->thread.debug.hbp_watch[idx] = bp
											}
										}
									}
								}
								attr = bp->attr
								attr.bp_addr = addr										// 用户设置的breakpoint地址

								modify_user_hw_breakpoint(bp, &attr)					// *** 这个通用接口用于更新bp中记录的hw breakpoint信息 ***
									modify_user_hw_breakpoint_check(bp, attr, false)
									{
										struct arch_hw_breakpoint hw = { }
										hw_breakpoint_parse(bp, attr, &hw)
											hw_breakpoint_arch_parse(bp, attr, hw)
												arch_build_bp_info(bp, attr, hw)
													switch (attr->bp_type)
													case HW_BREAKPOINT_X:
														hw->ctrl.type = ARM_BREAKPOINT_EXECUTE
													switch (attr->bp_len)
													case HW_BREAKPOINT_LEN_4:
														hw->ctrl.len = ARM_BREAKPOINT_LEN_4

													hw->address = attr->bp_addr			// *** 记录hw breakpoint addr ***
													hw->ctrl.privilege = AARCH64_BREAKPOINT_EL0
													hw->ctrl.enabled = !attr->disabled

												alignment_mask = 0x3
												offset = hw->address & alignment_mask

												hw->address &= ~alignment_mask			// hw breakpoint address去除低2位
												hw->ctrl.len <<= offset

										hw_breakpoint_copy_attr(struct perf_event_attr *to = &bp->attr, struct perf_event_attr *from = attr)
											to->bp_addr = from->bp_addr
											to->bp_type = from->bp_type
											to->bp_len  = from->bp_len
											to->disabled = from->disabled

										bp->hw.info = hw		/***** Store hw breakpoint info *****/
									}
							}
							offset += PTRACE_HBP_ADDR_SZ

							user_regset_copyin(&pos, &count, &kbuf, &ubuf, &ctrl, offset, offset + PTRACE_HBP_CTRL_SZ)

							ptrace_hbp_set_ctrl(note_type, struct task_struct *tsk = target, idx, u32 uctrl = ctrl)
							{
								struct perf_event_attr attr
								struct arch_hw_breakpoint_ctrl ctrl

								struct perf_event *bp = ptrace_hbp_get_initialised_bp(note_type, tsk, idx)

								attr = bp->attr													// ***** Reuse bp's attr *****

								decode_ctrl_reg(u32 reg = uctrl,								// reg: 0b00000001 11100101
												struct arch_hw_breakpoint_ctrl *ctrl = &ctrl)
									ctrl->enabled	= reg & 0x1									// ctrl->enabled  : 1
									reg >>= 1													// reg            : 0b00000000 11110010
									ctrl->privilege	= reg & 0x3									// ctrl->privilege: 2 (0b00000010)
									reg >>= 2													// reg            : 0b00000000 00111100
									ctrl->type	    = reg & 0x3									// ctrl->type     : 0
									reg >>= 2													// reg            : 0b00000000 00001111
									ctrl->len	    = reg & 0xff								// ctrl->len      : 15 (0b00001111)

								ptrace_hbp_fill_attr_ctrl(unsigned int note_type,
														  struct arch_hw_breakpoint_ctrl ctrl = ctrl,
														  struct perf_event_attr *attr        = &attr)
									int len, type, offset
									arch_bp_generic_fields(ctrl, int *gen_len = &len, int *gen_type = &type, int *offset = &offset)
										switch (ctrl.type)
											case ARM_BREAKPOINT_EXECUTE:
												*gen_type = HW_BREAKPOINT_X						// HW_BREAKPOINT_X: 4
										*offset = __ffs(ctrl.len) = 0							// ffs函数用于查找一个整数中的第一个置位值(也就是bit为1的位). ffs(3) = 0, ffs(8) = 2
										switch (ctrl.len >> *offset)
											case ARM_BREAKPOINT_LEN_4:							// ARM_BREAKPOINT_LEN_4: 0xf
												*gen_len = HW_BREAKPOINT_LEN_4					// HW_BREAKPOINT_LEN_4 : 4

									attr->bp_len	= len										// len: 4
									attr->bp_type	= type										// type: 4
									attr->bp_addr	+= offset									// offset: 0

								modify_user_hw_breakpoint(bp, &attr)							// *** 这个通用接口用于更新bp中记录的hw breakpoint信息 ***
								{
									modify_user_hw_breakpoint_check(bp, attr, false)
										struct arch_hw_breakpoint hw = { }
										hw_breakpoint_parse(bp, attr, &hw)
											hw_breakpoint_arch_parse(bp, attr, hw)
												arch_build_bp_info(bp, attr, hw)
													switch (attr->bp_type)
													case HW_BREAKPOINT_X:
														hw->ctrl.type = ARM_BREAKPOINT_EXECUTE
													switch (attr->bp_len)
													case HW_BREAKPOINT_LEN_4:
														hw->ctrl.len = ARM_BREAKPOINT_LEN_4

													hw->address = attr->bp_addr
													hw->ctrl.privilege = AARCH64_BREAKPOINT_EL0
													hw->ctrl.enabled = !attr->disabled

												if (hw->ctrl.type == ARM_BREAKPOINT_EXECUTE)
													alignment_mask = 0x3
												offset = hw->address & alignment_mask

												hw->address &= ~alignment_mask			// hw->address去除低2位
												hw->ctrl.len <<= offset

										hw_breakpoint_copy_attr(struct perf_event_attr *to = &bp->attr, struct perf_event_attr *from = attr)
											to->bp_addr = from->bp_addr
											to->bp_type = from->bp_type
											to->bp_len  = from->bp_len
											to->disabled = from->disabled

										bp->hw.info = hw		/***** Store hw breakpoint info *****/
								}
							}

							offset += PTRACE_HBP_CTRL_SZ

							user_regset_copyin_ignore(&pos, &count, &kbuf, &ubuf, offset, offset + PTRACE_HBP_PAD_SZ)

							offset += PTRACE_HBP_PAD_SZ
							idx++
						}
					}
		if (!ret)
			copy_to_user(&uiov->iov_len, &kiov.iov_len, sizeof(uiov->iov_len))
	}
}
4、Hardware Breakpoint / Watchpoints take effect time
__schedule {
context_switch
prepare_task_switch {
perf_event_task_sched_out
__perf_event_task_sched_out
perf_event_context_sched_out
task_ctx_sched_out
ctx_sched_out
group_sched_out
event_sched_out
event->pmu->del
A.K.A
hw_breakpoint_del (or perf_trace_del ???)
arch_uninstall_hw_breakpoint
hw_breakpoint_control(bp, ops = HW_BREAKPOINT_UNINSTALL) {
struct arch_hw_breakpoint *info = counter_arch_bp(bp)
return &bp->hw.info
struct debug_info *debug_info = ¤t->thread.debug
enum dbg_active_el dbg_el = debug_exception_level(info->ctrl.privilege)
if (info->ctrl.type == ARM_BREAKPOINT_EXECUTE)
/* Breakpoint */
ctrl_reg = AARCH64_DBG_REG_BCR
val_reg = AARCH64_DBG_REG_BVR
slots = this_cpu_ptr(bp_on_reg)
max_slots = core_num_brps
reg_enable = !debug_info->bps_disabled
else
/* Watchpoint */
ctrl_reg = AARCH64_DBG_REG_WCR
val_reg = AARCH64_DBG_REG_WVR
slots = this_cpu_ptr(wp_on_reg)
max_slots = core_num_wrps
reg_enable = !debug_info->wps_disabled
i = hw_breakpoint_slot_setup(slots, max_slots, bp, ops)
switch (ops)
case HW_BREAKPOINT_UNINSTALL:
/* Reset the control register. */
write_wb_reg(ctrl_reg, i, 0)
/* Release the debug monitors for the correct exception level */
disable_debug_monitors(dbg_el) {
disable = ~DBG_MDSCR_MDE
mdscr = mdscr_read()
mdscr &= disable
mdscr_write(mdscr)
}
}
}
switch_to {
__switch_to { // linux-5.16.8/arch/arm64/kernel/process.c
/* Context-switcher for restoring suspended breakpoints */
/*
* current next
* disabled: 0 0 => The usual case, NOTIFY_DONE
* 0 1 => Disable the registers
* 1 0 => Enable the registers
* 1 1 => NOTIFY_DONE. per-task bps will
* get taken care of by perf.
*/
hw_breakpoint_thread_switch(struct task_struct *next) {
/* Update breakpoints. */
if (current_debug_info->bps_disabled != next_debug_info->bps_disabled) {
### This is used when single-stepping after a breakpoint exception.
toggle_bp_registers(reg = AARCH64_DBG_REG_BCR, DBG_ACTIVE_EL0, int enable = !next_debug_info->bps_disabled)
switch (reg)
case AARCH64_DBG_REG_BCR:
slots = this_cpu_ptr(bp_on_reg)
max_slots = core_num_brps
case AARCH64_DBG_REG_WCR:
slots = this_cpu_ptr(wp_on_reg)
max_slots = core_num_wrps
for (i = 0; i < max_slots; ++i)
ctrl = read_wb_reg(reg, i)
if (enable)
ctrl |= 0x1
else
ctrl &= ~0x1
write_wb_reg(reg, i, ctrl)
}
/* Update watchpoints. */
if (current_debug_info->wps_disabled != next_debug_info->wps_disabled) {
toggle_bp_registers(reg = AARCH64_DBG_REG_WCR, DBG_ACTIVE_EL0, !next_debug_info->wps_disabled)
// Same as above
}
}
cpu_switch_to
}
}
finish_task_switch(prev) {
perf_event_task_sched_in
__perf_event_task_sched_in
perf_event_context_sched_in
perf_event_sched_in
ctx_sched_in
ctx_pinned_sched_in / ctx_flexible_sched_in
visit_groups_merge
merge_sched_in
group_sched_in
event_sched_in
event->pmu->add(event, PERF_EF_START)
A.K.A
hw_breakpoint_add (or perf_trace_add???)
arch_install_hw_breakpoint
hw_breakpoint_control(bp, ops = HW_BREAKPOINT_INSTALL) /* Here, ops is hard-code to HW_BREAKPOINT_INSTALL, so DBG_MDSCR_MDE will be set to MDSCR_EL1 */
{
u32 ctrl
struct arch_hw_breakpoint *info = counter_arch_bp(bp) /* Get hardware breakpoint info */
return &bp->hw.info
struct debug_info *debug_info = ¤t->thread.debug
enum dbg_active_el dbg_el = debug_exception_level(info->ctrl.privilege)
if (info->ctrl.type == ARM_BREAKPOINT_EXECUTE)
/* Breakpoint */
ctrl_reg = AARCH64_DBG_REG_BCR
val_reg = AARCH64_DBG_REG_BVR
slots = this_cpu_ptr(bp_on_reg)
max_slots = core_num_brps
reg_enable = !debug_info->bps_disabled
else
/* Watchpoint */
ctrl_reg = AARCH64_DBG_REG_WCR
val_reg = AARCH64_DBG_REG_WVR
slots = this_cpu_ptr(wp_on_reg)
max_slots = core_num_wrps
reg_enable = !debug_info->wps_disabled
i = hw_breakpoint_slot_setup(slots, max_slots, bp, ops)
switch (ops) {
case HW_BREAKPOINT_INSTALL:
/* Ensure debug monitors are enabled at the correct exception level */ #### Write DBG_MDSCR_MDE to MDSCR_EL1
enable_debug_monitors {
// Breakpoint, Watchpoint, and Vector Catch exceptions enabled.
u32 enable = DBG_MDSCR_MDE
mdscr = mdscr_read()
read_sysreg(mdscr_el1)
mdscr |= enable
mdscr_write(mdscr)
flags = local_daif_save() /* save debug state */
write_sysreg(mdscr, mdscr_el1)
local_daif_restore(flags) /* restore debug state */
}
// The fallthrough macro is used for acknowledging the intended flow within switch statements
// and that the developer didn't simply forget to "break" prior to the next switch case.
fallthrough;
case HW_BREAKPOINT_RESTORE:
/* Setup the address register. */
write_wb_reg(val_reg, i, info->address)
/* Setup the control register. */
ctrl = encode_ctrl_reg(info->ctrl)
u32 val = (ctrl.len << 5) | (ctrl.type << 3) | (ctrl.privilege << 1) | ctrl.enabled
return val
write_wb_reg(ctrl_reg, i, reg_enable ? ctrl | 0x1 : ctrl & ~0x1)
}
}
}
}5、观察点触发时,内核的处理流程
el0t_64_sync_handler {
	unsigned long esr = read_sysreg(esr_el1)
	switch (ESR_ELx_EC(esr))
	case ESR_ELx_EC_BREAKPT_LOW:
	case ESR_ELx_EC_SOFTSTP_LOW:
	case ESR_ELx_EC_WATCHPT_LOW:
	case ESR_ELx_EC_BRK64:
	el0_dbg {
		unsigned long far = read_sysreg(far_el1)	/* Only watchpoints write FAR_EL1, otherwise its UNKNOWN */

		do_debug_exception(unsigned long addr_if_watchpoint = far, unsigned int esr, struct pt_regs *regs) {
			const struct fault_info *inf = esr_to_debug_fault_info(esr)
			unsigned long pc = instruction_pointer(regs)
			inf->fn(addr_if_watchpoint, esr, regs)
			A.K.A
			watchpoint_handler(unsigned long addr = far, unsigned int esr, struct pt_regs *regs) {
				slots = this_cpu_ptr(wp_on_reg)
				wp = slots[i]
				watchpoint_report(wp, addr, regs) {
					struct arch_hw_breakpoint *info = counter_arch_bp(wp)

					info->trigger = addr	// 保存触发观察点异常的地址, 最终保存在task的siginfo中, 由gdb通过ptrace(PTRACE_GETSIGINFO)获取, 然后再跟gdb自己保存在state->dr_addr_wp中的探测地址比较来判断触发异常的地址是否是设置的硬断点/观察点

					/* Same as above */
					perf_bp_event(bp, void *data = regs) {
						struct pt_regs *regs = data
						perf_swevent_event(bp, 1, &sample, regs) {
							perf_swevent_overflow
								__perf_event_overflow
									event->overflow_handler(event, data, regs)	// it's set in register_user_hw_breakpoint when handle PTRACE_SETREGSET request
									A.K.A
									ptrace_hbptriggered {
										struct arch_hw_breakpoint *bkpt = counter_arch_bp(bp)
										const char *desc = "Hardware breakpoint trap (ptrace)"
										arm64_force_sig_fault(signo = SIGTRAP, code = TRAP_HWBKPT, far = bkpt->trigger, desc) {
											force_sig_fault(signo, code, (void __user *)far)
												force_sig_fault_to_task {	/* 发送信号给触发观察点的task */
													info.si_signo = sig		// SIGTRAP
													info.si_code  = code	// TRAP_HWBKPT
													info.si_addr  = addr	// The addr that hit hardware watchpoint
													force_sig_info_to_task(&info)
												}
										}
									}
						}
					}
				}
			}
		}
	}
}
6、gdb被唤醒,检查当前唤醒原因是否为watchpoint触发导致
linux_process_target::wait_for_event_filtered {
	ret = my_waitpid (-1, wstatp, options | WNOHANG)

	if (ret > 0)
	linux_process_target::filter_event(int lwpid = ret, int wstat = *wstatp) {
		child = find_lwp_pid (ptid_t (lwpid))

		thread = get_lwp_thread (child)

		child->stopped = 1

		child->last_status = wstat

		linux_process_target::save_stop_reason {
			siginfo_t siginfo
			ptrace (PTRACE_GETSIGINFO, lwpid_of (current_thread),(PTRACE_TYPE_ARG3) 0, &siginfo)
				// kernel return task->last_siginfo

			if (siginfo.si_signo == SIGTRAP) {

				### case1:
				if (GDB_ARCH_IS_TRAP_BRKPT (siginfo.si_code) && GDB_ARCH_IS_TRAP_HWBKPT (siginfo.si_code))
					if (!check_stopped_by_watchpoint (lwp))
						lwp->stop_reason = TARGET_STOPPED_BY_SW_BREAKPOINT

				### case2:
				else if (GDB_ARCH_IS_TRAP_BRKPT (siginfo.si_code))
					lwp->stop_reason = TARGET_STOPPED_BY_SW_BREAKPOINT

				### case3:
				else if (GDB_ARCH_IS_TRAP_HWBKPT (siginfo.si_code))
					if (!check_stopped_by_watchpoint (lwp))
						lwp->stop_reason = TARGET_STOPPED_BY_HW_BREAKPOINT

				### case4:
				else if (siginfo.si_code == TRAP_TRACE)
					if (!check_stopped_by_watchpoint (lwp))
						lwp->stop_reason = TARGET_STOPPED_BY_SINGLE_STEP
			}
		}
	}
}
六、总结
硬断点、观察点的本质就是设置对应的硬件debug寄存器,每个被调试程序在内核的task_struct对象中都会保存属于自身的硬断点、观察点寄存器设置内容,而这些内容通常是gdb通过ptrace系统调用进行设置的。
gdb设置硬断点、观察点的操作,仅仅是将对应的debug寄存器内容保存到被调试程序的task_sturct中。
硬断点、观察点真正起作用的时机:是借助内核的任务调度机制,在调度期间将属于被调度任务的硬断点、观察点寄存器内容写入对应的debug寄存器中,使得硬断点、观察点生效。


 被折叠的 条评论
为什么被折叠?
被折叠的 条评论
为什么被折叠?
 到【灌水乐园】发言


