【echarts样例】X轴为显示一周的时间轴

7 篇文章 1 订阅

源码

代码片段:

var data = [
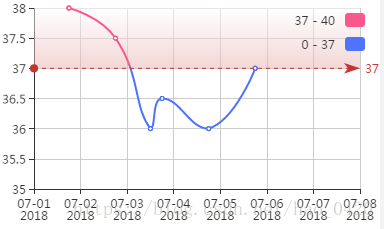
    {name:'"2018-07-05 18:00:29"', value:["2018-07-05 18:00:29", 37]},
    {name:'2018-07-04 18:00:29', value:["2018-07-04 18:00:29", 36]},
    {name:'2018-07-03 18:00:29', value:["2018-07-03 18:00:29", 36.5]},
    {name:'2018-07-03 12:00:29', value:["2018-07-03 12:00:29", 36]},
    {name:'2018-07-02 18:00:29', value:["2018-07-02 18:00:29", 37.5]},
    {name:'2018-07-01 18:00:29', value:["2018-07-01 18:00:29", 38]}
];
//时间显示范围
var anchor = [
    {name:'2018-07-01', value:['2018-07-01', 0]},
    {name:'2018-07-08', value:['2018-07-08', 0]}
];
    // 指定图表的配置项和数据
    option = {
        backgroundColor: '#fff',//背景色
        grid: {
            left: 35,
            right: 20,
            top: 10,
            bottom:40,
            show:false
        },
        tooltip: {
            // trigger: 'axis',
            formatter: function (param) {
                return  param.value[0] + "<br>" + param.value[1] + "°C";
            }
        },
        xAxis: {
            type:"time",
            splitNumber: 10,
            axisLabel: {
                // rotate: 60,
                textStyle: {
                fontSize: 8
            }
        }
        },
        yAxis: {
            min: 35
        },
        visualMap: {
            top: 10,
            right: 10,
            pieces: [{
                gte: 0,
                lte: 37,
                color: '#4D74FA'
            },{
                gt: 37,
                lte: 40,
                color: '#FA578B'
            }],
            outOfRange: {
                color: '#FA578B'
            }
            // show : false
        },
        series: [{
            data: data,
            markLine: {
                silent: true,
                data: [{
                    yAxis: 37
                }]
            },
            type: 'line',
            smooth: true,
            markArea:{
                data: [
                    [
                        {yAxis: 37},
                        {}
                    ]
                ],
                itemStyle:{
                    opacity: 0.5,
                    color: {
                        type: 'linear',
                        x: 0,
                        y: 0,
                        x2: 0,
                        y2: 1,
                        colorStops: [{
                                offset: 0, color: '#fff' // 0% 处的颜色
                            },
                            {
                                offset: 1, color: '#E7AEAD' // 100% 处的颜色
                            }
                        ],
                        globalCoord: false // 缺省为 false
                    }
                }
            }
            // areaStyle: {
            //     normal: {
            //         color: new echarts.graphic.LinearGradient(0, 0, 0, 1, [{
            //             offset: 0,
            //             color: 'rgb(255, 158, 68)'
            //         }, {
            //             offset: 1,
            //             color: '#fff'
            //         }])
            //     }
            // },
        },
        {
            name:'.anchor',
            type:'line',
            showSymbol:false,
            data:anchor,
            itemStyle:{normal:{opacity:0}}, //不绘制该线条
            lineStyle:{normal:{opacity:0}}
        }]
    };

运行结果:


  • 1
    点赞
  • 9
    收藏
    觉得还不错? 一键收藏
  • 0
    评论
Echarts的x轴可以设置为时间轴,通过将xAxis中的type值设为time来实现。在这种情况下,不需要指定xAxis对象的data,而是通过series对象中的value\[0\]来显示时间轴的Label。value\[0\]可以是时间戳,也可以是形如"2018-12-5 10:20:30"的日期格式,但不能是无效的时间格式类型。同时,可以使用moment.js来格式化时间戳,以便显示在图表中。以下是一个示例代码: ```javascript var option = { xAxis: { type: 'time', axisLabel: { formatter: function(value, index) { return moment(value).format('YYYY-MM-DD HH:mm:ss'); } } }, // 其他配置项... }; var myChart = echarts.init(document.getElementById('chart'), theme); myChart.setOption(option); ``` 在这个示例中,x轴的类型被设置为time,通过axisLabel中的formatter函数来格式化时间戳,以便在图表中显示。你可以根据自己的需求进行进一步的配置和调整。 #### 引用[.reference_title] - *1* *3* [Echart图表X轴为时间轴的解释](https://blog.csdn.net/weixin_34162695/article/details/92336986)[target="_blank" data-report-click={"spm":"1018.2226.3001.9630","extra":{"utm_source":"vip_chatgpt_common_search_pc_result","utm_medium":"distribute.pc_search_result.none-task-cask-2~all~insert_cask~default-1-null.142^v91^control_2,239^v3^insert_chatgpt"}} ] [.reference_item] - *2* [如何设置x轴为时间轴的echars图表?](https://blog.csdn.net/m0_58060036/article/details/118091860)[target="_blank" data-report-click={"spm":"1018.2226.3001.9630","extra":{"utm_source":"vip_chatgpt_common_search_pc_result","utm_medium":"distribute.pc_search_result.none-task-cask-2~all~insert_cask~default-1-null.142^v91^control_2,239^v3^insert_chatgpt"}} ] [.reference_item] [ .reference_list ]

“相关推荐”对你有帮助么?

  • 非常没帮助
  • 没帮助
  • 一般
  • 有帮助
  • 非常有帮助
提交
评论
添加红包

请填写红包祝福语或标题

红包个数最小为10个

红包金额最低5元

当前余额3.43前往充值 >
需支付:10.00
成就一亿技术人!
领取后你会自动成为博主和红包主的粉丝 规则
hope_wisdom
发出的红包
实付
使用余额支付
点击重新获取
扫码支付
钱包余额 0

抵扣说明:

1.余额是钱包充值的虚拟货币,按照1:1的比例进行支付金额的抵扣。
2.余额无法直接购买下载,可以购买VIP、付费专栏及课程。

余额充值