


本文章内容来自于:https://docs.microsoft.com/en-us/dotnet/core/diagnostics/metrics-collection
OpenTelemetry /təˈlemətri/ 是CNCF(Cloud Native Computing Foundation) 推出的标准化生成和收集遥测数据的开源项目。
Prometheus /prəˈmiːθiəs/ 是搞监控和预警的
Grafana /grəˈfɑːnˌɑː/ 展示监控数据的
简要流程:
使用opentelemetry-dotnet从.NET程序中收集需要的数据,暴露出API等待Prometheus来收集数据
使用windows_exporter监控Windows机器
prometheus收集数据
grafana 展示数据
环境搭建:
主要使用Docker快速搭建出单机版监控体系
搭建windows_exporter
https://github.com/prometheus-community/windows_exporter 下载最新版
命令行启动即可,具体需要的参数可以看文档
.\windows_exporter-0.18.1-386.exe --collectors.enabled "cpu,iis,net,tcp"
搭建prometheus
创建配置文件prometheus.yml
global:
  scrape_interval:     15s # By default, scrape targets every 15 seconds.

  # Attach these labels to any time series or alerts when communicating with
  # external systems (federation, remote storage, Alertmanager).
  external_labels:
    monitor: 'codelab-monitor'

# A scrape configuration containing exactly one endpoint to scrape:
# Here it's Prometheus itself.
scrape_configs:
  # The job name is added as a label `job=<job_name>` to any timeseries scraped from this config.
  - job_name: 'prometheus'
    # Override the global default and scrape targets from this job every 5 seconds.
    scrape_interval: 5s
    static_configs:
      - targets: ['localhost:9090']
  - job_name: 'windows-exporter' # 监控Windows机器的
    static_configs:
      - targets: ['192.168.230.1:9182']
  - job_name: 'OpenTelemetryTest' # 监控.NET程序的
    scrape_interval: 1s # poll very quickly for a more responsive demo
    static_configs:
      - targets: ['192.168.230.1:9184']
启动程序
docker run \
    --name prometheus \
    -d \
    -p 9090:9090 \
    -v /home/prometheus/prometheus.yml:/etc/prometheus/prometheus.yml \
    prom/prometheus:v2.35.0
页面地址: http://192.168.230.130:9090/targets 可以查看各监控点链接状态
搭建grafana
docker启动
docker run \
    --name "grafana" \
    -d \
    -p 3000:3000 \
    grafana/grafana-oss:8.5.3
http://192.168.230.130:3000/
账号密码都是admin
根据界面提示接入prometheus即可
搭建.net遥测
新建一个.net console 程序,导入以下包
  <ItemGroup>
    <PackageReference Include="OpenTelemetry.Exporter.Prometheus" Version="1.3.0-beta.2" />
  </ItemGroup>
程序如下:
using System;
using System.Diagnostics.Metrics;
using System.Reflection;
using System.Threading;

using Microsoft.Extensions.Options;

using OpenTelemetry;
using OpenTelemetry.Metrics;

class Program
{
    static Meter s_meter = new Meter("HatCo.HatStore", "1.0.0");
    static Counter<int> s_hatsSold = s_meter.CreateCounter<int>(name: "hats-sold",
                                                                unit: "Hats",
                                                                description: "The number of hats sold in our store");

    static void Main(string[] args)
    {
        using MeterProvider meterProvider = Sdk.CreateMeterProviderBuilder()
                .AddMeter("HatCo.HatStore")
                .AddPrometheusExporter(opt =>
                {
                    opt.StartHttpListener = true;
                    opt.HttpListenerPrefixes = new string[]
                    {
                        $"http://192.168.230.1:9184",
                    };
                })
                .Build();

        Console.WriteLine("Press any key to exit");
        while (!Console.KeyAvailable)
        {
            // Pretend our store has a transaction each second that sells 4 hats
            Thread.Sleep(1000);
            s_hatsSold.Add(4);
        }
    }
}
代码解读:
Meter 是用来检测程序内数据的神器,通过使用该类,搭配dotnet-counters 可以快速查看程序运行情况,详见https://docs.microsoft.com/en-us/dotnet/core/diagnostics/metrics-instrumentation
MeterProvider用Meter获取数据,通过在内部的HTTPListener对外开放数据,所以有两点需要注意,第一是如果地址不是localhost,则需要管理员身份运行程序,第二是需要开放防火墙
剩下的操作就是看看http://192.168.230.130:9090/targets 的连接是否正常

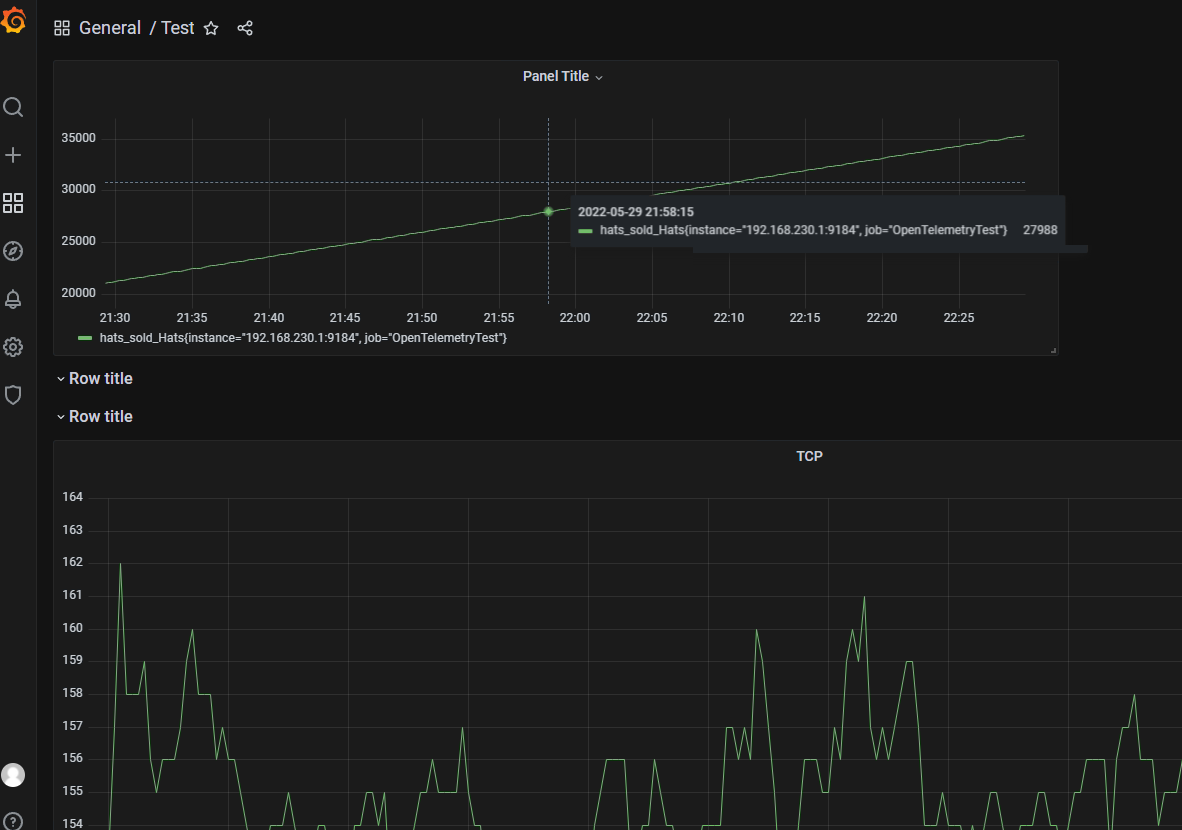
然后配置下grafana就能看到效果
参考链接:
https://docs.microsoft.com/en-us/dotnet/core/diagnostics/metrics-collection
https://grafana.com/grafana/dashboards/14694
https://grafana.com/grafana/download?platform=docker
https://hub.docker.com/r/grafana/grafana-oss/tags
https://prometheus.io/docs/prometheus/latest/configuration/configuration/#static_config
https://prometheus.io/download/
https://github.com/open-telemetry/opentelemetry-dotnet
https://stackoverflow.com/questions/2564669/net-httplistener-prefix-issue-with-anything-other-than-localhost
https://grafana.com/grafana/dashboards/14694
声明
本文采用知识共享署名-非商业性使用-相同方式共享 2.5 中国大陆许可协议进行许可,发表在CSDN和博客园,欢迎读者转载,但未经作者同意必须保留此段声明,且在文章页面明显位置给出原文连接!请读者/爬虫们尊重版权


 被折叠的 条评论
为什么被折叠?
被折叠的 条评论
为什么被折叠?
 到【灌水乐园】发言


