


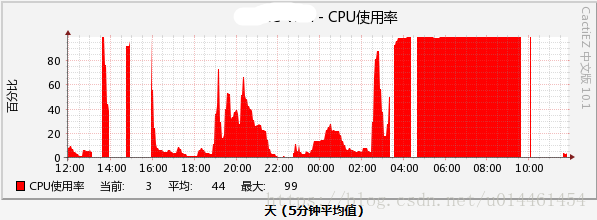
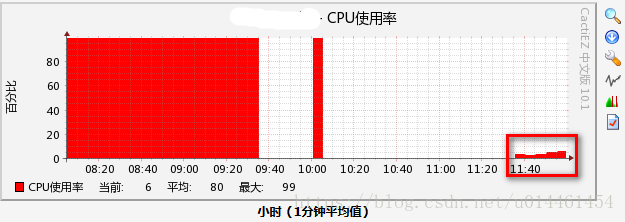
透过Cacti发现一台CISCO Route的CPU使用率都到90%以上了,赶快查看原因?
UM-WF#sh processes cpu sorted | include SNMP
CPU utilization for five seconds: 99%/8%; one minute: 99%; five minutes: 99%
PID Runtime(uS) Invoked uSecs 5Sec 1Min 5Min TTY Process
233 4151587520 680981 37631 76.10% 77.15% 76.76% 0 SNMP ENGINE
231 3337772000 1302328 2562 8.79% 8.76% 8.74% 0 IP SNMP
93 1840900000 1222887 1505 3.63% 3.67% 3.72% 0 IP Input
UM-WF#sh log
*Aug 9 10:08:34: %SNMP-3-INPUT_QFULL_ERR: Packet dropped due to input queue full
*Aug 9 10:08:34: %SNMP-3-INPUT_QFULL_ERR: Packet dropped due to input queue full
*Aug 9 10:09:00: %SNMP-3-INPUT_QFULL_ERR: Packet dropped due to input queue full
通过上述查证,证明了第一号战犯是SNMP ENGINE,奇怪的是过去运作几年了都没有出现问题过。于是,
UM-WF#sh run | begin snmp
snmp-server community public RO //启用只读的snmp
只有这么一行,再加点限制
snmp-server host 172.x.x.x public //Specify hosts to receive SNMP notifications
snmp-server inform retries 0 //snmp v1的inform具有重传特写,默认是3
过一段时间观察还没有降下来,还是这么高。。。,再改,加个ACL上去,限定主机存取。
access-list 98 permit 172.x.x.x
access-list 98 deny any
snmp-server community public RO 98
再来观察效果,终于降下来了。


 921
921


 被折叠的 条评论
为什么被折叠?
被折叠的 条评论
为什么被折叠?
 到【灌水乐园】发言


