


 本文详细介绍了HTML5的canvas画布中的线性渐变、径向渐变和文本渐变,以及SVG图形的制作,包括矩形、圆形、直线和多边形的绘制,并探讨了canvas与SVG在图形表现和动画效果上的区别。
目录
一、画布渐变
1.线性渐变
使用createLinearGradient(x轴开始的坐标,y轴开始的坐标,x轴结束的坐标,y轴结束的坐标)、grd.addColorStop(渐变开始与结束之间的位置,颜色)、fillStyle、fillRect就可以制作线性渐变
//线性渐变
var grd=context.createLinearGradient(0,0,400,400);
grd.addColorStop(0,"red");
grd.addColorStop(0.4,"yellow");
grd.addColorStop(0.7,"blue");
grd.addColorStop(1,"green");
context.fillStyle=grd;
context.fillRect(10,10,500,500);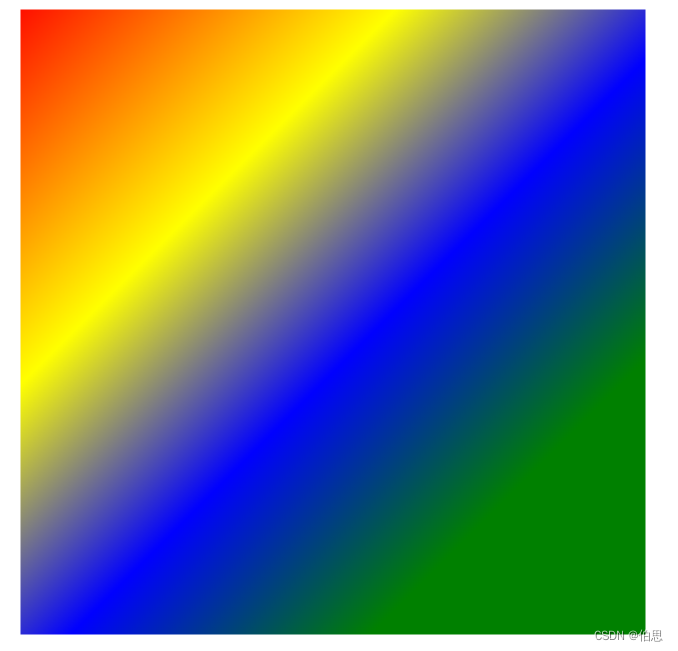
2.径向渐变
使用createRadialGradient(x轴开始的坐标,y轴开始的坐标,半径开始时的大小,x轴结束的坐标,y轴结束的坐标,半径结束时的大小)、grd.addColorStop(渐变开始与结束之间的位置,颜色)、fillStyle、fillRect就可以制作径向渐变
//径向渐变
var grd = context.createRadialGradient(300, 300, 10, 300, 300, 200);
grd.addColorStop(0, "#fff");
grd.addColorStop(0.2, "orange");
grd.addColorStop(0.4, "yellow");
grd.addColorStop(0.5, "green");
grd.addColorStop(0.6, "blue");
grd.addColorStop(0.8, "#27bee4");
grd.addColorStop(1, "black");
context.fillStyle = grd;
context.arc(300, 300, 200, 0, Math.PI * 2);
context.fill();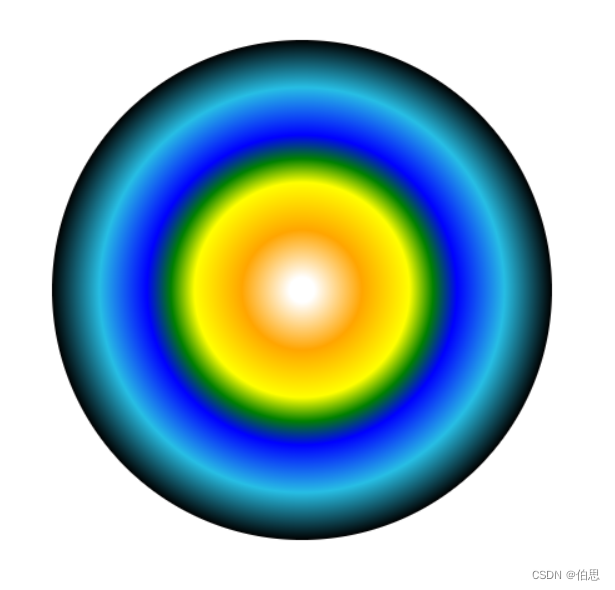
3.文本渐变
使用font(定义字体大小,使用何种字体、createLinearGradient(渐变开始点的X轴坐标, 表示渐变开始点的Y轴坐标, 表示渐变结束点的X轴坐标, 表示渐变结束点的Y轴坐标)、addColorStop(渐变开始与结束之间的位置,颜色)、fillStyle、fillText(文字内容, x坐标, y坐标)就可以制作文字渐变
//文本渐变
context.font = "100px 幼圆";
var gradient = context.createLinearGradient(0, 0, cas.width, 0);
gradient.addColorStop("0", "magenta");
gradient.addColorStop("0.5", "blue");
gradient.addColorStop("1.0", "red");
context.fillStyle = gradient;
context.fillText("Big smile!", 10, 90);
二、svg
一、制作图形
1.制作矩形
使用rect标签制作矩形,里面的属性分别是x/y:绘图位置、width/height:矩形长宽、fill:填充颜色,默认黑色、stroke:描边的颜色、stroke-width:描边的宽度、rx/ry:圆角
<body>
    <svg width="600" height="600">
    	<!--矩形-->
        <rect x="30" y="30" width="200" height="200" fill="none" stroke="green" stroke-width="5" rx="50" ry="100"></rect>
    </svg>
</body>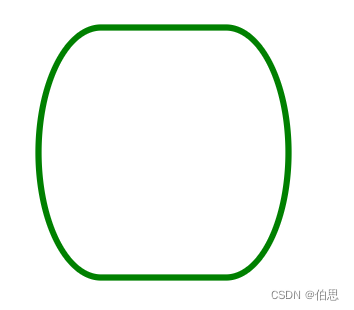
2.制作圆形
绘制圆形:使用circle,还可以使用rect标签结合圆角的值实现圆形或椭圆形的绘制
cx:圆形的中心点x轴坐标
cy:圆形的中心点y轴坐标
r:圆形的半径
stroke-opacity:设置线条的透明度
fill-opacity:设置填充的透明度
<body>
    <svg width="600" height="600">
        <circle cx="300" cy="300" r="100" fill="red" stroke="green" stroke-width="10" stroke-opacity="0.3"></circle>
    </svg>
</body>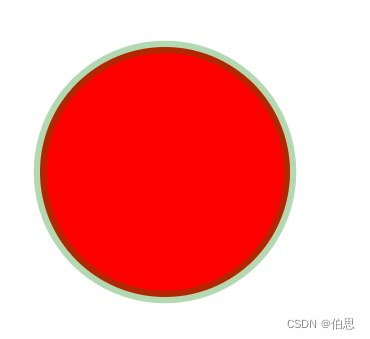
3.绘制直线和折线
绘制直线使用line标签,绘制折线使用polyline标签
<body>
    <svg width="600" height="600">

        <!--绘制直线 line标签-->
        <line x1="0" y1="0" x2="100" y2="0" stroke="red"></line>
        <!--绘制折线-->
        <polyline points="0,0,0,100,50,100" stroke="green"></polyline>
    </svg>
</body>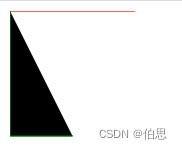
4.绘制闭合多边形
绘制闭合多边形使用polylgon标签
<body>
    <svg width="600" height="600">
        <!--绘制闭合多边形 polylgon-->
        <polygon points="200 0 200 100 300 100 500 0" stroke="green" fill="none"></polygon>
    </svg>
</body>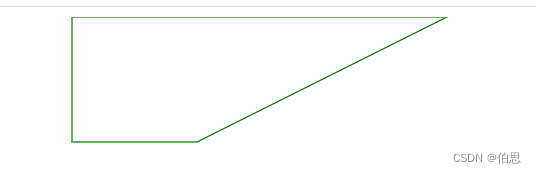
二、动画
svg中提供三种常用动画标记,基础动画、形变动画和路径动画
svg动画属性
attributeType:css/xml规定的属性值的名称空间
attributeName:规定元素的那个属性会产生动画效果
from/to:从哪到哪
dur:动画时长
fill:动画结束后的状态,保持freeze结束状态/remove恢复初始状态
1.基础动画
<svg width="1000" height="1000">
    <circle cx="100" cy="100" r="10"> -->
        <animate attributeType="XML" attributeName="cx" from="100" to="500" dur="5"  begin="click" id="aaa" ></animate>
        <animate attributeType="XML" attributeName="cx" from="500" to="100" dur="5" begin="aaa.end" repeatCount="indefinite"></animate>
    </circle>
</svg>
2.形变动画
<svg width="1000" height="1000">
    <rect x="300" y="300" width="300" height="200" fill="red">
            <animateTransform attributeName="transform" type="rotate" from="0 300 300" to="360 300 300" dur="2" repeatCount="indefinite"></animateTransform>
    </rect>
</svg>
3.路径动画
<svg width="500" height="500" viewBox="-100 -100 500 500">
   <path d="Mo o co 300 300 300 300 0" stroke="red" stroke-width="2" fill="none"></path>
   <rect x="0" y="0" width="40" height="40" fill="lightgreen">
       <animateMotion path="Mo o co 300 300 300 300 0" dur="5s" begin="click" fill="freeze" rotate="auto"></animateMotion>
   </rect>
</svg>
ps:动画这块因为我不知道怎么搞动态图,所以我就不展示效果图了,感兴趣的朋友可以复制代码去试一下。
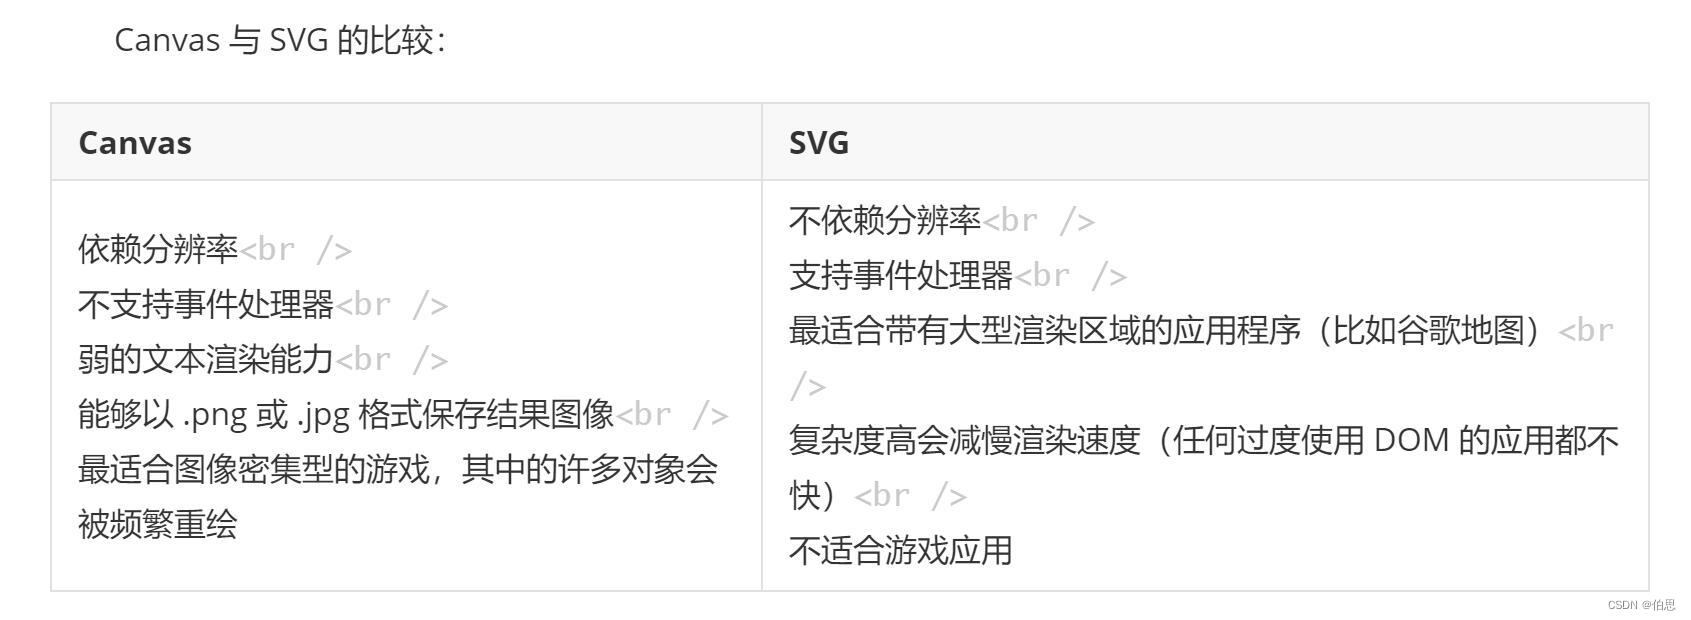
三、canvas画布和svg图形的区别
1、Canvas是使用javaScript程序绘制动态生成的,SVG是使用xml文档描述来绘图。从这点来看:SVG更适合用来做动态交互,而且SVG绘图更容易编辑
2、SVG是基于矢量的,所以它能够很好的处理图形大小的变大。canvas是基于位图的图像,他不能改变大小,只能缩放显示,最适合带有大型渲染区域的应用程序(比如谷歌地图)
3、canvas支持的颜色比SVG多,更适合图像密集型的游戏之类使用,其中的许多对象会被频繁重绘


 290
290

 被折叠的 条评论
为什么被折叠?
被折叠的 条评论
为什么被折叠?
 到【灌水乐园】发言


