


首次使用ab做并发能力的测试
servier.XML配置如下,使用tomcat默认的BIO模式:
<Connector executor="tomcatThreadPool" port="8080" protocol="HTTP/1.1"
maxThreads="10000" acceptCount="5000" enableLookups="false" URIEncoding="utf-8"
connectionTimeout="20000"
redirectPort="8443" />
使用ab做并发能力测试:
第一次测试50000连接数/500每次:
C:\Users\kxm>ab -k -n 5000 -c 500 http://localhost:8080/SMS
This is ApacheBench, Version 2.3 <$Revision: 655654 $>
Copyright 1996 Adam Twiss, Zeus Technology Ltd, http://www.zeustech.net/
Licensed to The Apache Software Foundation, http://www.apache.org/
Benchmarking localhost (be patient)
Completed 500 requests
....
Completed 5000 requests
Finished 5000 requests
Concurrency Level: 500
Time taken for tests: 4.005 seconds
Complete requests: 5000
Failed requests: 0
Write errors: 0
Non-2xx responses: 5000
Keep-Alive requests: 0
Total transferred: 715000 bytes
HTML transferred: 0 bytes
Requests per second: 1248.37 [#/sec] (mean)
Time per request: 400.523 [ms] (mean)
Time per request: 0.801 [ms] (mean, across all concurrent requests)
Transfer rate: 174.33 [Kbytes/sec] received
Connection Times (ms)
min mean[+/-sd] median max
Connect: 0 0 0.5 0 4
Processing: 36 385 121.4 369 992
Waiting: 29 252 145.6 241 839
Total: 36 386 121.4 369 992
Percentage of the requests served within a certain time (ms)
50% 369
66% 373
75% 396
80% 399
90% 459
95% 570
98% 840
99% 969
100% 992 (longest request)
最长请求的时间为992ms,接近1s。
第二次同样并发数测试,在缓存的帮助下,情况好多了,结果如下:
C:\Users\kxm>ab -k -n 5000 -c 500 http://localhost:8080/SMS
This is ApacheBench, Version 2.3 <$Revision: 655654 $>
Copyright 1996 Adam Twiss, Zeus Technology Ltd, http://www.zeustech.net/
Licensed to The Apache Software Foundation, http://www.apache.org/
Benchmarking localhost (be patient)
Completed 500 requests
...
Concurrency Level: 500
Time taken for tests: 3.690 seconds
Complete requests: 5000
Failed requests: 0
Write errors: 0
Non-2xx responses: 5000
Keep-Alive requests: 0
Total transferred: 715000 bytes
HTML transferred: 0 bytes
Requests per second: 1354.94 [#/sec] (mean)
Time per request: 369.021 [ms] (mean)
Time per request: 0.738 [ms] (mean, across all concurrent requests)
Transfer rate: 189.21 [Kbytes/sec] received
Connection Times (ms)
min mean[+/-sd] median max
Connect: 0 0 0.5 0 9
Processing: 36 352 60.2 367 393
Waiting: 3 182 104.9 181 385
Total: 37 353 60.2 368 393
Percentage of the requests served within a certain time (ms)
50% 368
66% 374
75% 379
80% 384
90% 387
95% 390
98% 391
99% 392
100% 393 (longest request)
多次测试的结果最终稳定为为420+ms(longest request)
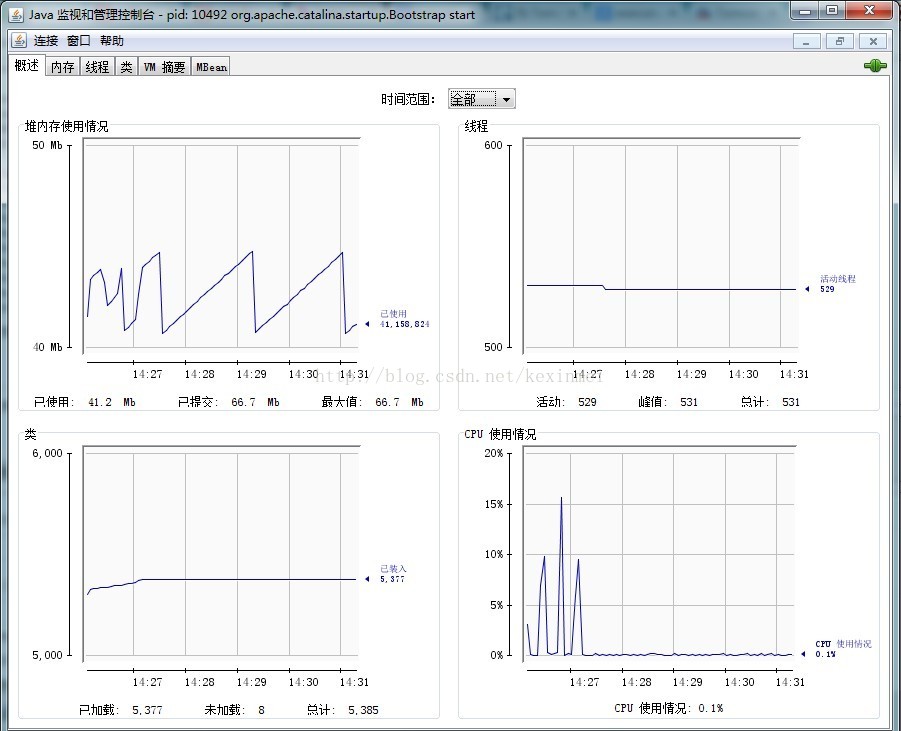
监视JVM情况如下,这是没有调整JVM参数的默认情况,可以看到堆的呈明显锯齿状:
调整tomcat的采用NIO模式:
<Connector executor="tomcatThreadPool" port="8080" protocol="org.apache.coyote.http11.Http11NioProtocol" maxThreads="10000" acceptCount="5000" enableLookups="false" URIEncoding="utf-8" connectionTimeout="20000" redirectPort="8443" />第一次测试并发:
C:\Users\kxm>ab -k -n 5000 -c 500 http://localhost:8080/SMS
This is ApacheBench, Version 2.3 <$Revision: 655654 $>
Copyright 1996 Adam Twiss, Zeus Technology Ltd, http://www.zeustech.net/
Licensed to The Apache Software Foundation, http://www.apache.org/
Benchmarking localhost (be patient)
Completed 500 requests
·················
Concurrency Level: 500
Time taken for tests: 4.552 seconds
Complete requests: 5000
Failed requests: 0
Write errors: 0
Non-2xx responses: 5000
Keep-Alive requests: 0
Total transferred: 715000 bytes
HTML transferred: 0 bytes
Requests per second: 1098.36 [#/sec] (mean)
Time per request: 455.226 [ms] (mean)
Time per request: 0.910 [ms] (mean, across all concurrent requests)
Transfer rate: 153.38 [Kbytes/sec] received
Connection Times (ms)
min mean[+/-sd] median max
Connect: 0 1 0.5 1 3
Processing: 39 437 197.5 410 1552
Waiting: 35 337 185.0 304 1373
Total: 40 437 197.4 410 1552
Percentage of the requests served within a certain time (ms)
50% 410
66% 414
75% 425
80% 430
90% 458
95% 791
98% 1317
99% 1425
100% 1552 (longest request)
This is ApacheBench, Version 2.3 <$Revision: 655654 $>
Copyright 1996 Adam Twiss, Zeus Technology Ltd, http://www.zeustech.net/
Licensed to The Apache Software Foundation, http://www.apache.org/
Benchmarking localhost (be patient)
Completed 500 requests
```````````````(省略)
Concurrency Level: 500
Time taken for tests: 4.086 seconds
Complete requests: 5000
Failed requests: 0
Write errors: 0
Non-2xx responses: 5000
Keep-Alive requests: 0
Total transferred: 715000 bytes
HTML transferred: 0 bytes
Requests per second: 1223.62 [#/sec] (mean)
Time per request: 408.623 [ms] (mean)
Time per request: 0.817 [ms] (mean, across all concurrent requests)
Transfer rate: 170.88 [Kbytes/sec] received
Connection Times (ms)
min mean[+/-sd] median max
Connect: 0 1 0.5 1 2
Processing: 38 390 65.8 411 426
Waiting: 3 202 115.5 201 421
Total: 39 391 65.8 412 426
Percentage of the requests served within a certain time (ms)
50% 412
66% 415
75% 416
80% 417
90% 419
95% 423
98% 424
99% 425
100% 426 (longest request)
二、BIO、NIO、AIO
NIO通常采用Reactor模式,AIO通常采用Proactor模式。AIO简化了程序的编写,stream的读取和写入都有OS来完成,不需要像NIO那样子遍历Selector。Windows基于IOCP实现AIO,Linux只有eppoll模拟实现了AIO。
Java7之前的JDK只支持NIO和BIO,从7开始支持AIO。
4种通信方式:TCP/IP+BIO, TCP/IP+NIO, UDP/IP+BIO, UDP/IP+NIO。
TCP/IP+BIO、
Socket和ServerSocket实现,ServerSocket实现Server端端口监听,Socket用于建立网络IO连接。
不适用于处理多个请求 1.生成Socket会消耗过多的本地资源。2. Socket连接的建立一般比较慢。
BIO情况下,能支持的连接数有限,一般都采取accept获取Socket以后采用一个thread来处理,one connection one thread。无论连接是否有真正数据请求,都需要独占一个thread。
可以通过设立Socket池来一定程度上解决问题,但是使用池需要注意的问题是:1. 竞争等待比较多。 2. 需要控制好超时时间。
TCP/IP+NIO
使用Channel(SocketChannel和ServerSocketChannel)和Selector。
Server端通常由一个thread来监听connect事件,另外多个thread来监听读写事件。这样做的好处是这些连接只有在真是请求的时候才会创建thread来处理,one request one thread。这种方式在server端需要支持大量连接但这些连接同时发送请求的峰值不会很多的时候十分有效。
UDP/IP+BIO
DatagramSocket和DatagramPacket。DatagramSocket负责监听端口以及读写数据,DatagramPacket作为数据流对象进行传输。
UDP/IP是无连接的,无法进行双向通信,除非双方都成为UDP Server。
UDP/IP+NIO
通过DatagramChannel和ByteBuffer实现。DatagramChannel负责端口监听及读写。ByteBuffer负责数据流传输。
如果要将消息发送到多台机器,如果为每个目标机器都建立一个连接的话,会有很大的网络流量压力。这时候可以使用基于UDP/IP的Multicast协议传输,Java中可以通过MulticastSocket和DatagramPacket来实现。
Multicast一般多用于多台机器的状态同步,比如JGroups。SRM, URGCP都是Multicast的实现方式。eBay就采用SRM来实现将数据从主数据库同步到各个搜索节点机器。


 被折叠的 条评论
为什么被折叠?
被折叠的 条评论
为什么被折叠?
 到【灌水乐园】发言


