


1. 安装 geoserver 服务:略

2. 启动 geoserver:

3. 登录 geoserver 控制台:( 默认账号、密码为 admin、geoserver )
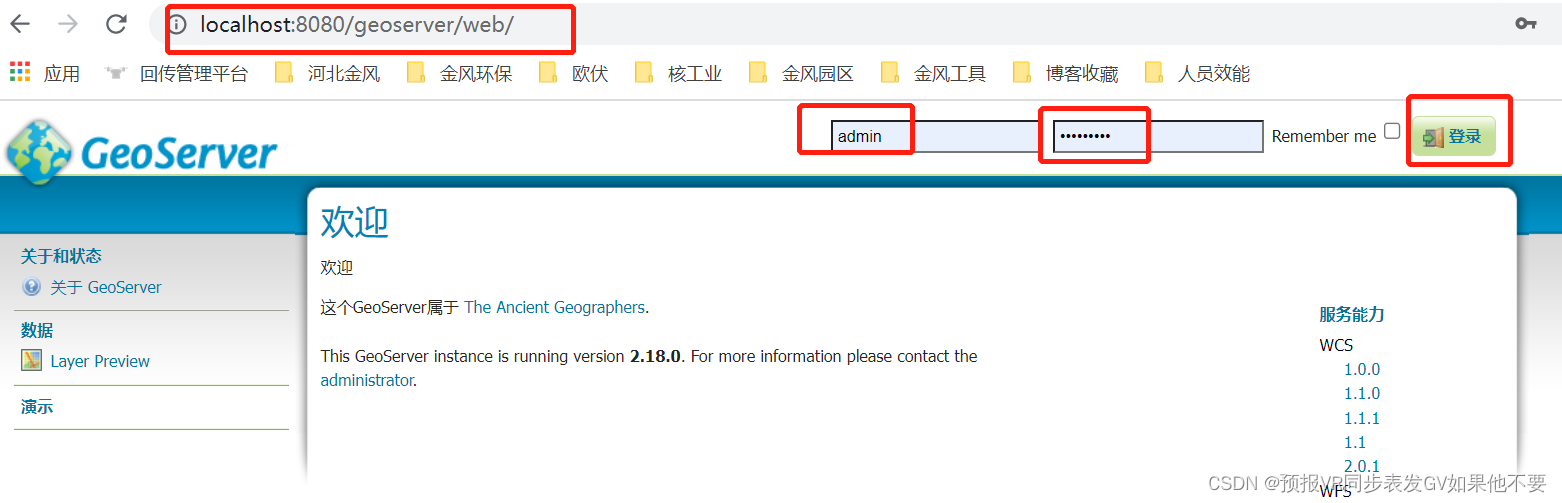
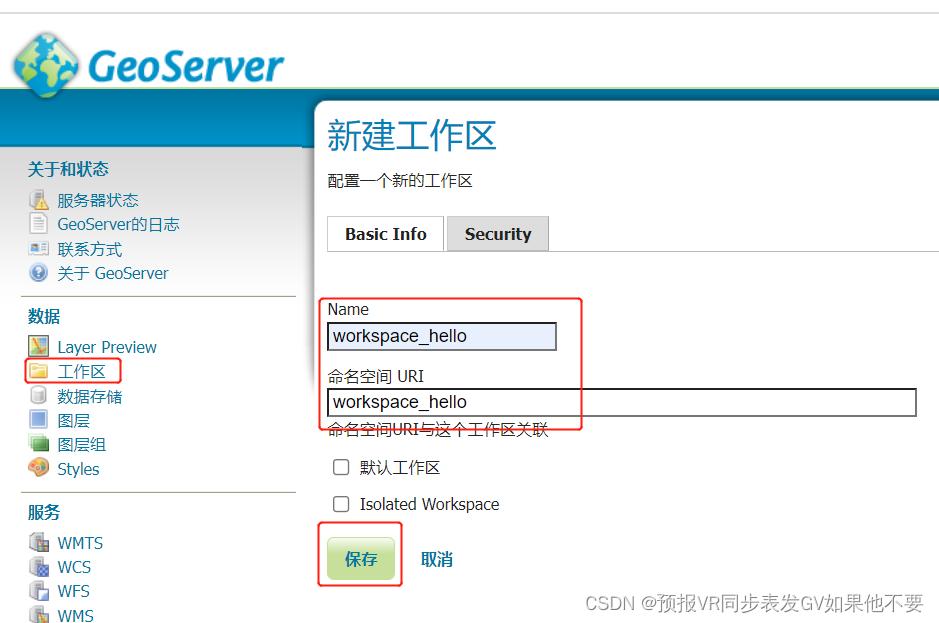
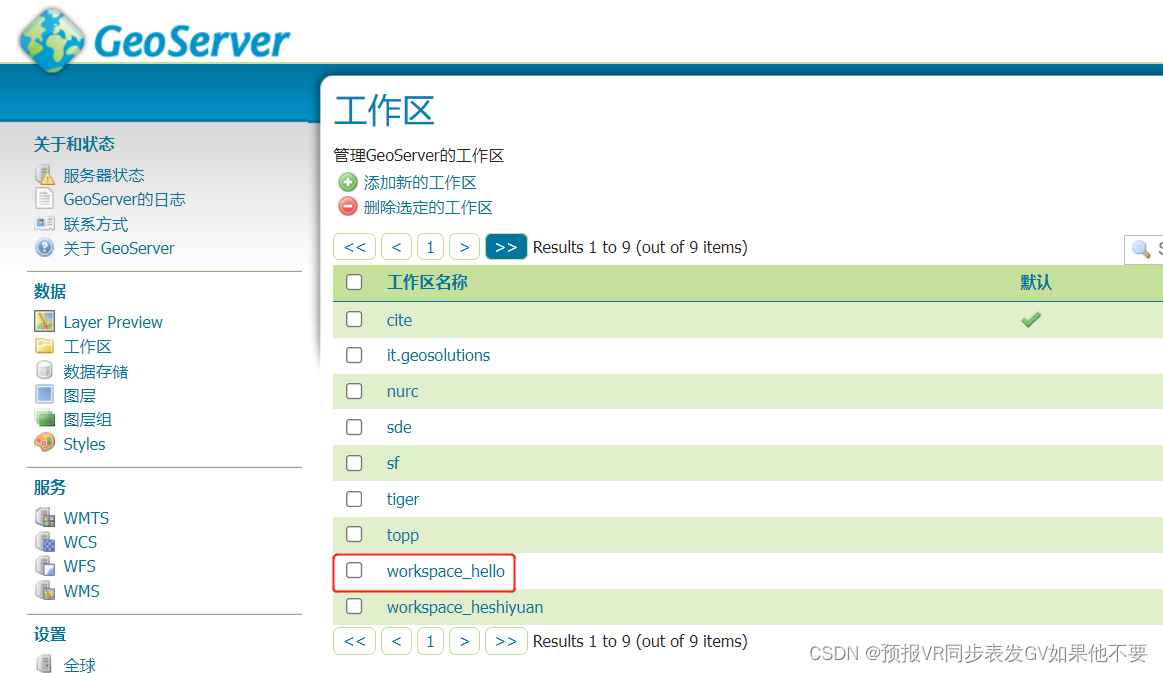
4. 新建工作区:
5. 添加新的数据存储和Mysql关联:
5.1. 在Mysql 中新建一张 tb_area 表:
建表语句:
CREATE TABLE `tb_area` (
  `id` int(11) NOT NULL AUTO_INCREMENT COMMENT '主键',
  `city_name` varchar(128) NOT NULL COMMENT '地区名称',
  `infected_number` int(11) NOT NULL COMMENT '感染人数',
  `coordinate_set` polygon NOT NULL COMMENT '边界坐标点集合',
  PRIMARY KEY (`id`)
) ENGINE=InnoDB AUTO_INCREMENT=19 DEFAULT CHARSET=utf8mb4
插入几条数据:
按照如下这种格式插入几条数据:
INSERT INTO tb_area( city_name,infected_number,coordinate_set )
VALUES ('中国国家博物馆', 30,GEOMFROMTEXT('POLYGON((116.405995 39.913701,
                        116.409426 39.913853,
                        116.409426 39.910076,
                        116.406246 39.909965,
                        116.405995 39.913701))'));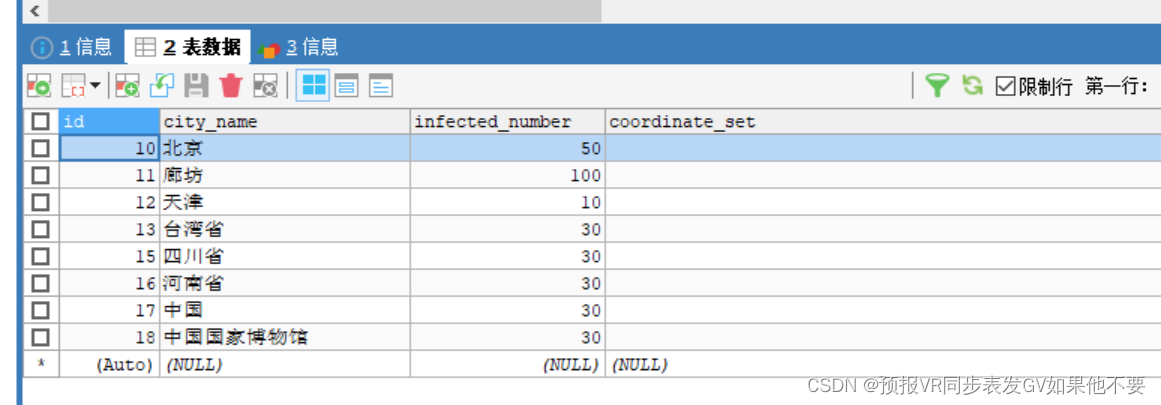
ps: sqlyog不支持查看 polygon 类型字段的值,可以使用navicat 查看。

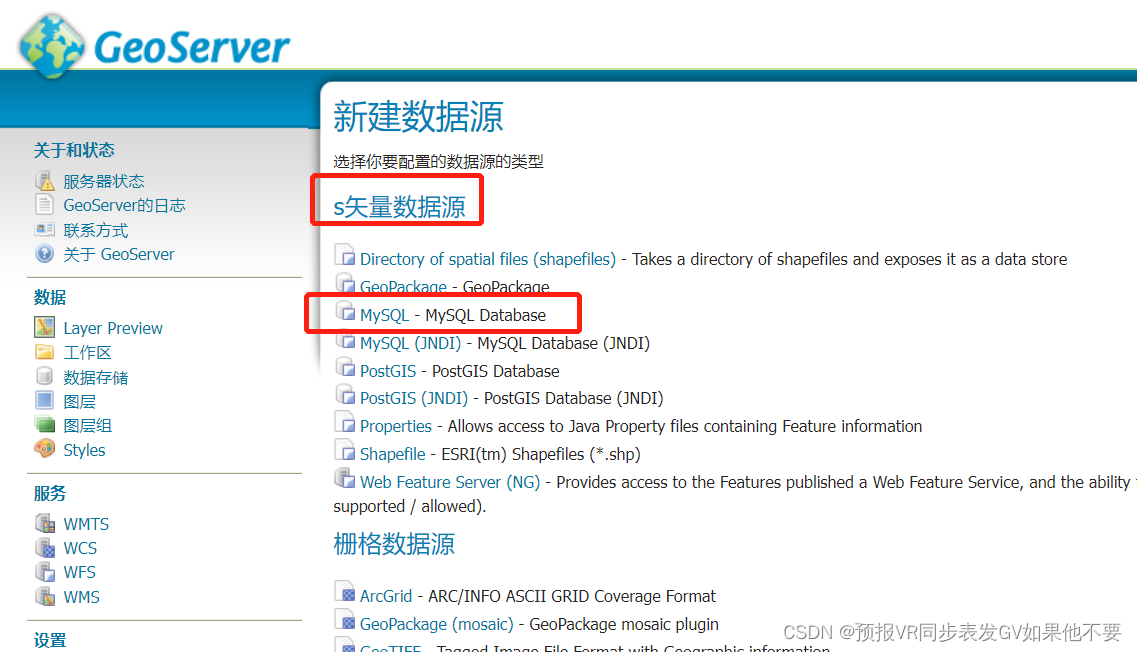
安装geoserver 后默认是不支持添加mysql数据源的,需要从官网下载对应geoserver版本的mysql插件,如下所示:
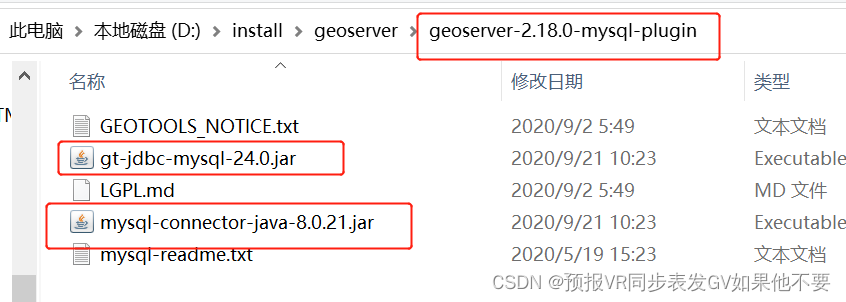
将其复制到如下文件夹下:

重新启动geoserver,再次进入就可以看到mysql了。
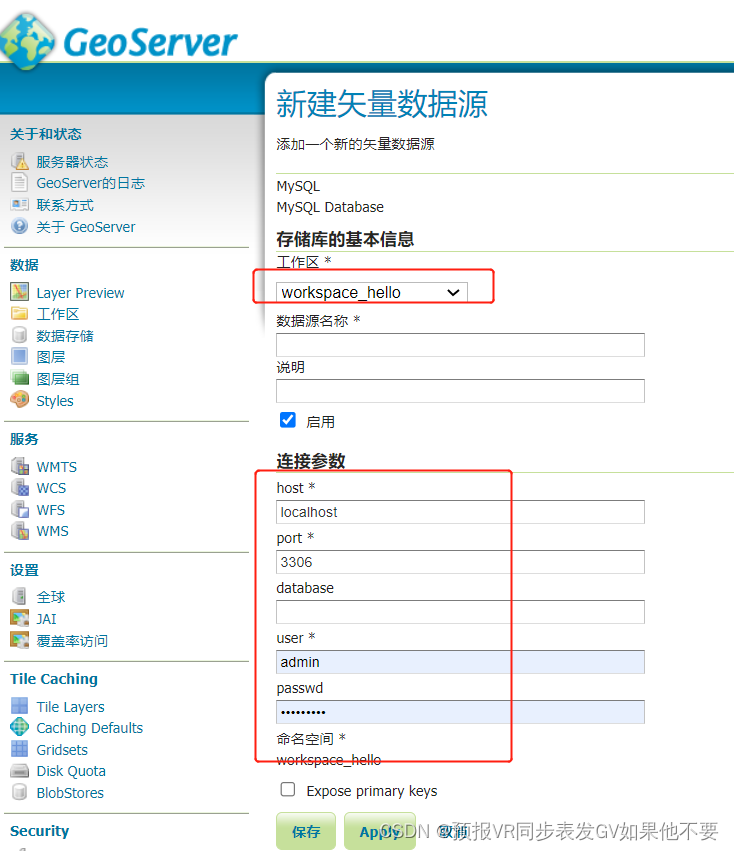
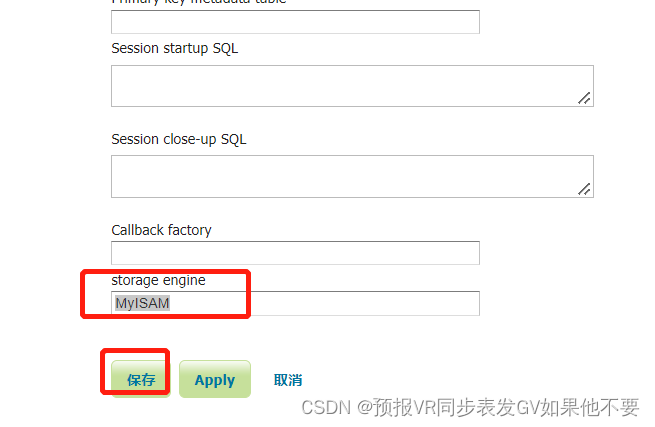
填写Mysql 的地址、端口、数据库名称、用户名、密码,最后填写 MyISAM,点击“保存”即可。
新建图层:

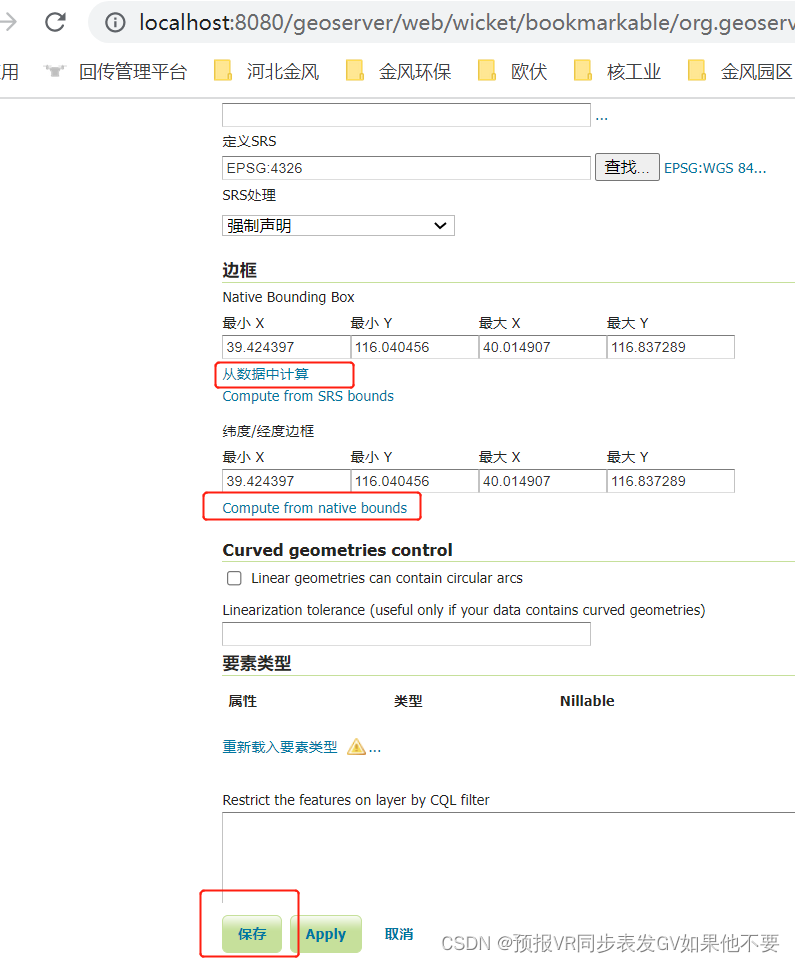
为图层设置style:

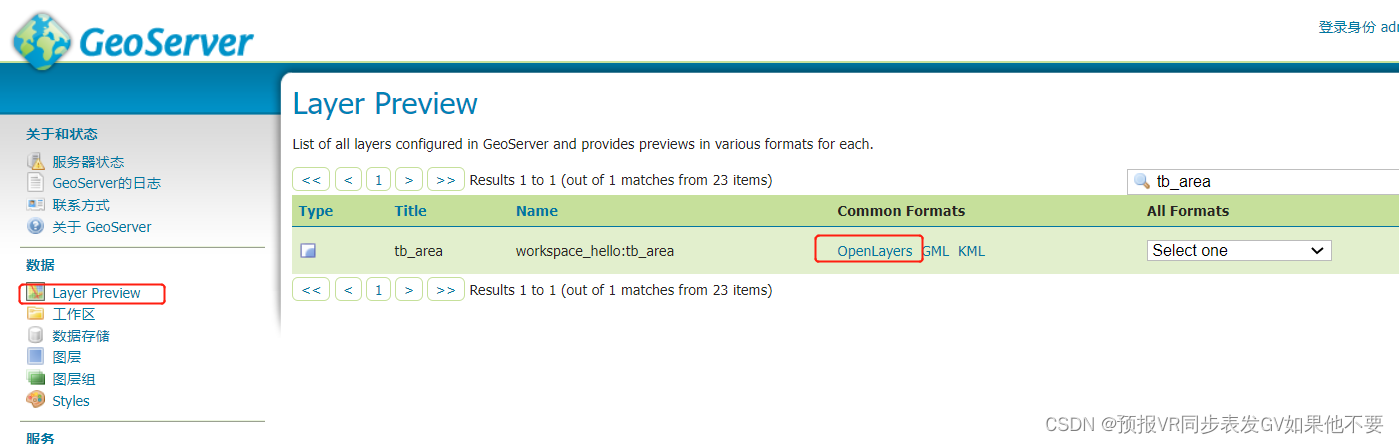
获取该图层的wms地址:
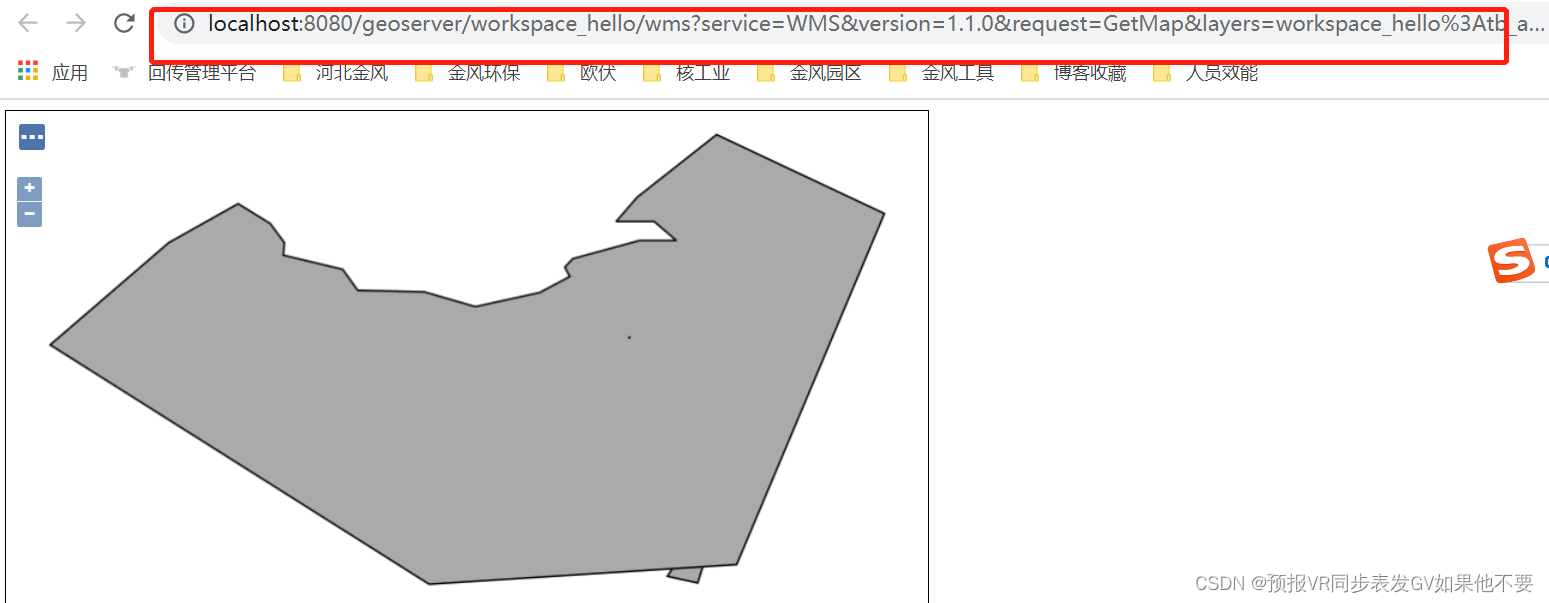
修改该图层的style之后:
将url复制出来urlDecode之后:
http://localhost:8080/geoserver/workspace_hello/wms?
service=WMS&
version=1.1.0&
request=GetMap&
layers=workspace_hello:tb_area&
bbox=73.985242,21.837319,135.064267,54.740713&
width=768&
height=413&
srs=EPSG:404000&
styles=&
format=application/openlayers
下载leaflet js库:
<!-- 引入 文件 -->
<link rel="stylesheet" href="./leaflet/leaflet.css" />
<script src="./leaflet/leaflet.js"> </script>

<!--
<link rel="stylesheet" href="https://unpkg.com/leaflet@1.7.1/dist/leaflet.css" integrity="sha512-xodZBNTC5n17Xt2atTPuE1HxjVMSvLVW9ocqUKLsCC5CXdbqCmblAshOMAS6/keqq/sMZMZ19scR4PsZChSR7A==" crossorigin="" />
<script src="https://unpkg.com/leaflet@1.7.1/dist/leaflet.js"
    integrity="sha512-XQoYMqMTK8LvdxXYG3nZ448hOEQiglfqkJs1NOQV44cWnUrBc8PkAOcXy20w0vlaXaVUearIOBhiXZ5V3ynxwA=="
    crossorigin=""></script>
-->
<!-- 增加地图高度 -->
<style>
    #mapDiv {
        height: 600px;
    }
</style>
<!-- 创建一个 地图的div id 必须有 但是自定义 -->
<div id="mapDiv"></div>
<script>
    // 用的腾讯地图的瓦片
    // var url = 'http://rt0.map.gtimg.com/realtimerender?z={z}&x={x}&y={-y}&type=vector&style=0';

    // 百度地图
    var url = "http://webrd01.is.autonavi.com/appmaptile?lang=zh_cn&size=1&scale=1&style=7&x={x}&y={y}&z={z}";

    //初始化 地图
    var leafletMap = L.map('mapDiv').setView([41, 123], 5);

    //将图层加载到地图上,并设置最大的聚焦还有map样式
    L.tileLayer(url, {
        maxZoom: 18,
        id: 'mapbox.streets'
    }).addTo(leafletMap);

    //增加一个marker ,地图上的标记,并绑定了一个popup,默认打开
    L.marker([41, 123])
        .addTo(leafletMap)
        .bindPopup("i am alerxxxt")
        .openPopup();

    // todo 加一个setInterval 不断增大 半径试一下有没有核爆冲击波效果
    //增加一个圈,设置圆心、半径、样式
    var radius=50;
    var time=0;
  /*   var interval = window.setInterval(function(){
                                        if( time >= 40 ){
                                            window.clearInterval( interval );
                                            return;
                                        }
                                        L.circle([41, 123], radius, {
                                                        color: 'yellow',
                                                        fillColor: 'red',
                                                        fillOpacity: 0.5
                                                }).addTo(leafletMap)
                                                  .bindPopup("我是一个圆。");
                                        radius+=10000;
                                        time++;
                                },500);
     */


    //故宫博物院多边形
    L.polygon([
                [39.921882, 116.392974],
                [39.922145, 116.400997],
                [39.913917, 116.401426],
                [39.914246, 116.393317],
                [39.921882, 116.392974]
              ],
              {
                color: 'yellow',
                fillColor: 'red',
                fillOpacity: 0.3
              }).addTo(leafletMap)
    .bindPopup("我是故宫博物院");

    console.log( "555" );
  /*   window.setTimeout(function(){
        loadGeoserverLayer();
    },500); */
    loadGeoserverLayer();

    // 最开始发现经纬度录反了,但是geoserver认这个经纬度,所以在geoserver中预览图层中可以看到,但是leaftlet加载百度地图和geoserver图层后看不到,
    // 将经纬度交换一下,使用leaflet加载百度地图和geoserver图层后可以显示了,但是gepserver预览看不到图层了

    function loadGeoserverLayer(){
        L.tileLayer.wms("http://localhost:8080/geoserver/workspace_hello/wms",
                        {
                            // bbox: '39.424397,116.040456,40.014907,116.837289',
                            // width: 569,
                            // height: 768,
                            // srs: 'EPSG:4326',
                            // styles: '',
                            // request: 'GetMap',
                            // version: '1.1.0',
                            //service:'WMS',
                            layers: 'workspace_hello:tb_area',
                            format: 'image/svg',
                            // format: 'application/openlayers',
                            // transparent: true, // 如果该项为true,WMS服务返回透明图片。
                            color: 'yellow',
                            fillColor: 'red',
                            fillOpacity: 0.1
                        },
                        {
                            color: 'yellow',
                            fillColor: 'red',
                            fillOpacity: 0.1
                        })
                    .addTo(leafletMap);
    }


    //为点击地图的事件 增加popup
    var popup = L.popup();
    function onMapClick(e) {
        popup.setLatLng(e.latlng)
             .setContent("You clicked the map at " + e.latlng.toString())
             .openOn(leafletMap);
    }
    leafletMap.on('click', onMapClick);

</script>
访问 test.html
在idea中通过如下方式以服务器访问方式访问test.html:
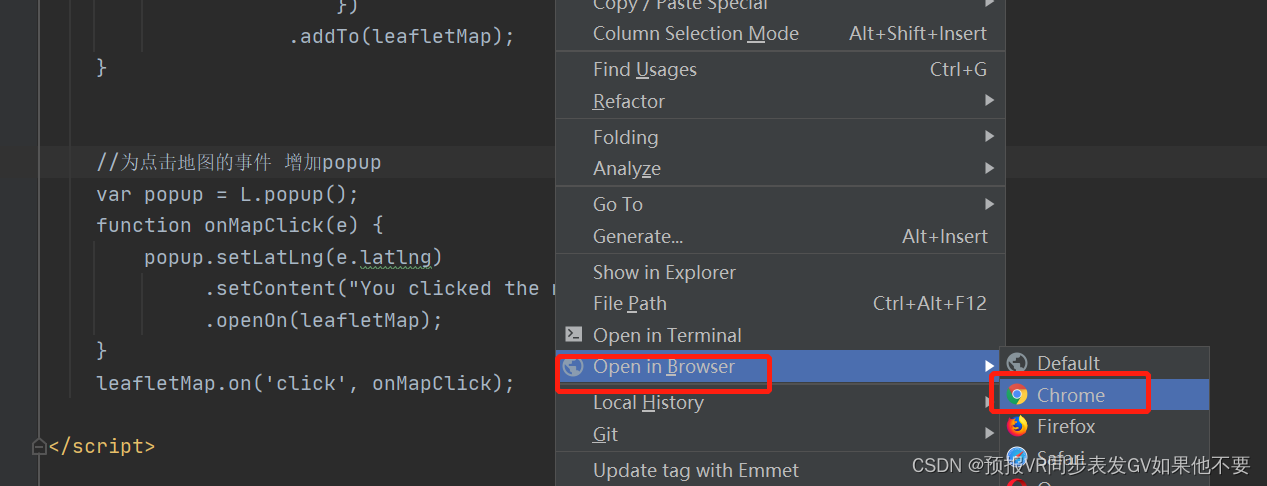

默认情况下是只能看到百度地图,无法看到加载的geoserver图层的,f12看看报没报跨域,如果是跨域问题,自行百度 "leaflet加载 geoserver wms 跨域问题",解决好之后还是无法看到,原因可能是需要修改图层的坐标系:
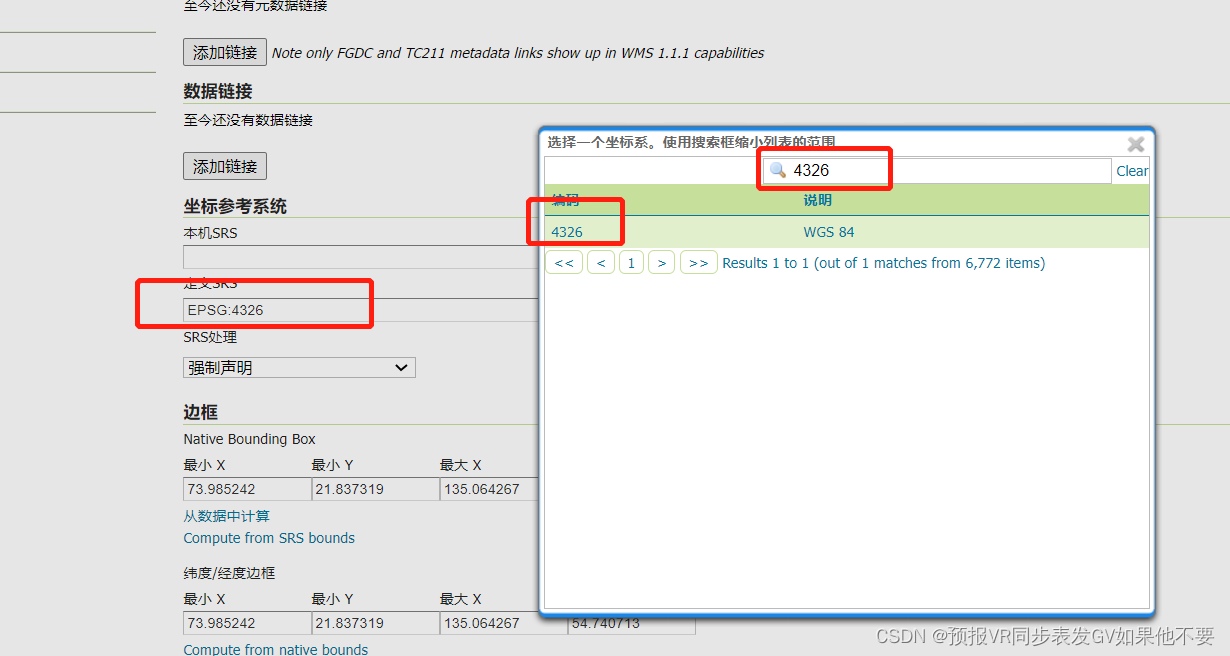
默认情况下不是这个 4326参考系,需要搜索出兵设置为该坐标系,重新发布该图层,在刷新test.html就看到百度地图上蒙了一层图层了。
修改geoserver 的默认样式:未完待续...
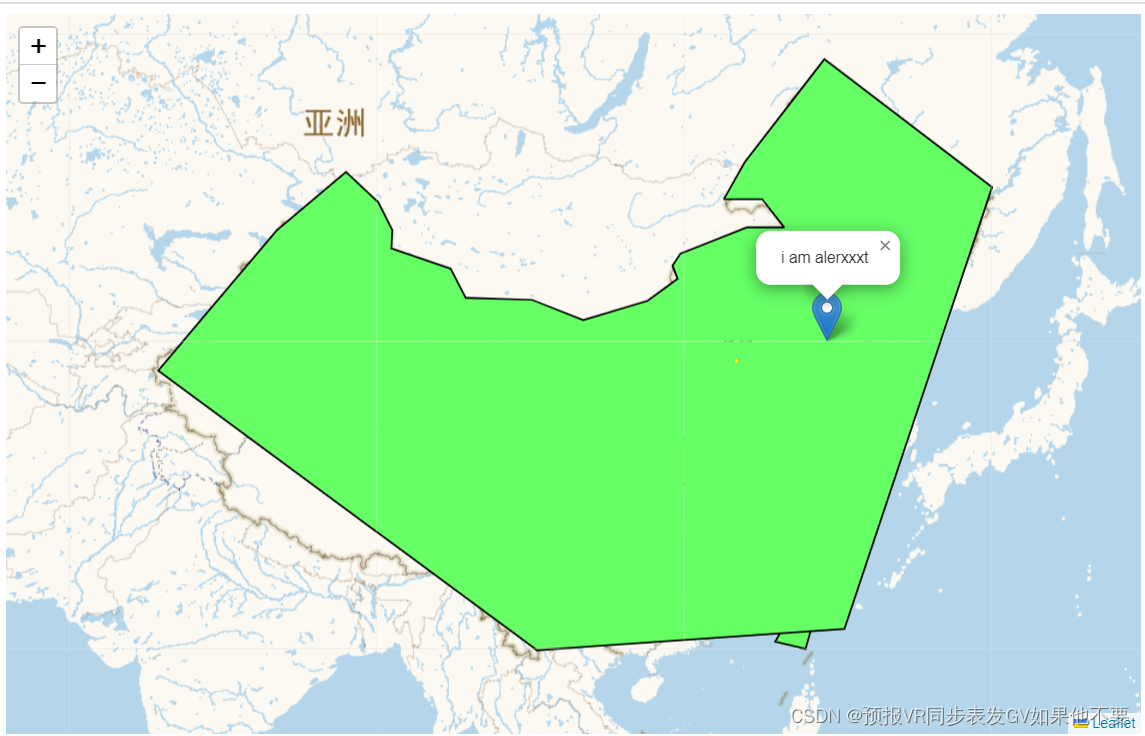
使用默认的 "green" style:

效果如下:
新建一个半透明 green的 style:
打开 green style 的代码内容:
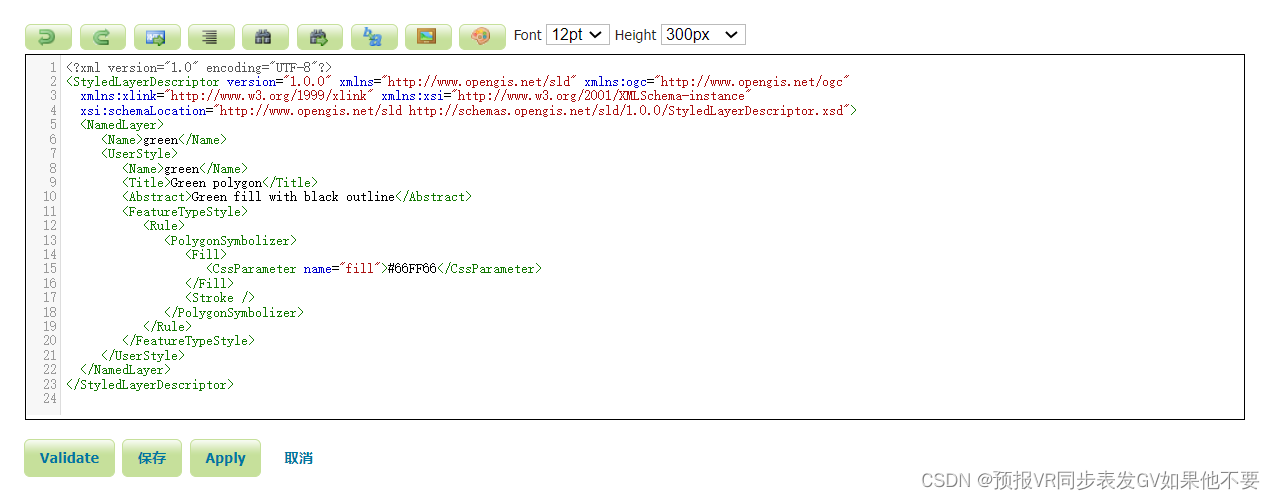
新建一个green_half的style,代码内容使用上面的,并为"<Fill>"标签添加子标签" <CssParameter name="fill-opacity">0.5</CssParameter>":

修改图层的style为 "green_half" 后效果如下:
为该图层不同的区域设置不同的style:
新建一张表录入几条数据:

找到系统的style "population"的代码:
<?xml version="1.0" encoding="UTF-8"?>
<StyledLayerDescriptor version="1.0.0" xmlns="http://www.opengis.net/sld" xmlns:ogc="http://www.opengis.net/ogc"
xmlns:xlink="http://www.w3.org/1999/xlink" xmlns:xsi="http://www.w3.org/2001/XMLSchema-instance" xmlns:gml="http://www.opengis.net/gml"
xsi:schemaLocation="http://www.opengis.net/sld http://schemas.opengis.net/sld/1.0.0/StyledLayerDescriptor.xsd">
<NamedLayer>
<Name>USA states population</Name>
<UserStyle>
<Name>population</Name>
<Title>Population in the United States</Title>
<Abstract>A sample filter that filters the United States into three
categories of population, drawn in different colors</Abstract>
<FeatureTypeStyle>
<Rule>
<Title>< 2M</Title>
<ogc:Filter>
<ogc:PropertyIsLessThan>
<ogc:PropertyName>PERSONS</ogc:PropertyName>
<ogc:Literal>2000000</ogc:Literal>
</ogc:PropertyIsLessThan>
</ogc:Filter>
<PolygonSymbolizer>
<Fill>
<!-- CssParameters allowed are fill (the color) and fill-opacity -->
<CssParameter name="fill">#4DFF4D</CssParameter>
<CssParameter name="fill-opacity">0.7</CssParameter>
</Fill>
</PolygonSymbolizer>
</Rule>
<Rule>
<Title>2M - 4M</Title>
<ogc:Filter>
<ogc:PropertyIsBetween>
<ogc:PropertyName>PERSONS</ogc:PropertyName>
<ogc:LowerBoundary>
<ogc:Literal>2000000</ogc:Literal>
</ogc:LowerBoundary>
<ogc:UpperBoundary>
<ogc:Literal>4000000</ogc:Literal>
</ogc:UpperBoundary>
</ogc:PropertyIsBetween>
</ogc:Filter>
<PolygonSymbolizer>
<Fill>
<!-- CssParameters allowed are fill (the color) and fill-opacity -->
<CssParameter name="fill">#FF4D4D</CssParameter>
<CssParameter name="fill-opacity">0.7</CssParameter>
</Fill>
</PolygonSymbolizer>
</Rule>
<Rule>
<Title>> 4M</Title>
<!-- like a linesymbolizer but with a fill too -->
<ogc:Filter>
<ogc:PropertyIsGreaterThan>
<ogc:PropertyName>PERSONS</ogc:PropertyName>
<ogc:Literal>4000000</ogc:Literal>
</ogc:PropertyIsGreaterThan>
</ogc:Filter>
<PolygonSymbolizer>
<Fill>
<!-- CssParameters allowed are fill (the color) and fill-opacity -->
<CssParameter name="fill">#4D4DFF</CssParameter>
<CssParameter name="fill-opacity">0.7</CssParameter>
</Fill>
</PolygonSymbolizer>
</Rule>
<Rule>
<Title>Boundary</Title>
<LineSymbolizer>
<Stroke>
<CssParameter name="stroke-width">0.2</CssParameter>
</Stroke>
</LineSymbolizer>
<TextSymbolizer>
<Label>
<ogc:PropertyName>STATE_ABBR</ogc:PropertyName>
</Label>
<Font>
<CssParameter name="font-family">Times New Roman</CssParameter>
<CssParameter name="font-style">Normal</CssParameter>
<CssParameter name="font-size">14</CssParameter>
</Font>
<LabelPlacement>
<PointPlacement>
<AnchorPoint>
<AnchorPointX>0.5</AnchorPointX>
<AnchorPointY>0.5</AnchorPointY>
</AnchorPoint>
</PointPlacement>
</LabelPlacement>
</TextSymbolizer>
</Rule>
</FeatureTypeStyle>
</UserStyle>
</NamedLayer>
</StyledLayerDescriptor>
我们将 "PERSONS" 修改为数据库表的字段 "infected_number"( 感染人数 ),修改后的完整代码为:
<?xml version="1.0" encoding="UTF-8"?>
<StyledLayerDescriptor version="1.0.0" xmlns="http://www.opengis.net/sld" xmlns:ogc="http://www.opengis.net/ogc"
  xmlns:xlink="http://www.w3.org/1999/xlink" xmlns:xsi="http://www.w3.org/2001/XMLSchema-instance" xmlns:gml="http://www.opengis.net/gml"
  xsi:schemaLocation="http://www.opengis.net/sld http://schemas.opengis.net/sld/1.0.0/StyledLayerDescriptor.xsd">
  <NamedLayer>
    <Name>infected_degree</Name>
    <UserStyle>
      <Name>infected_degree</Name>
      <Title>infected_degree</Title>
      <Abstract>infected_degree</Abstract>
      <FeatureTypeStyle>
        <Rule>
          <Title>0</Title>
          <ogc:Filter>
            <ogc:PropertyIsLessThan>
             <ogc:PropertyName>infected_number</ogc:PropertyName>
             <ogc:Literal>1</ogc:Literal>
            </ogc:PropertyIsLessThan>
          </ogc:Filter>
          <PolygonSymbolizer>
             <Fill>
                <CssParameter name="fill">#FF0000</CssParameter>
                <CssParameter name="fill-opacity">0.2</CssParameter>
             </Fill>
          </PolygonSymbolizer>
        </Rule>
        <Rule>
          <Title>1~9</Title>
          <ogc:Filter>
            <ogc:PropertyIsBetween>
              <ogc:PropertyName>infected_number</ogc:PropertyName>
              <ogc:LowerBoundary>
                <ogc:Literal>1</ogc:Literal>
              </ogc:LowerBoundary>
              <ogc:UpperBoundary>
                <ogc:Literal>9</ogc:Literal>
              </ogc:UpperBoundary>
            </ogc:PropertyIsBetween>
          </ogc:Filter>
          <PolygonSymbolizer>
             <Fill>
                <CssParameter name="fill">#FF0000</CssParameter>
                <CssParameter name="fill-opacity">0.4</CssParameter>
             </Fill>
          </PolygonSymbolizer>
        </Rule>
         <Rule>
          <Title>10~99</Title>
          <ogc:Filter>
            <ogc:PropertyIsBetween>
              <ogc:PropertyName>infected_number</ogc:PropertyName>
              <ogc:LowerBoundary>
                <ogc:Literal>10</ogc:Literal>
              </ogc:LowerBoundary>
              <ogc:UpperBoundary>
                <ogc:Literal>99</ogc:Literal>
              </ogc:UpperBoundary>
            </ogc:PropertyIsBetween>
          </ogc:Filter>
          <PolygonSymbolizer>
             <Fill>
                <CssParameter name="fill">#FF0000</CssParameter>
                <CssParameter name="fill-opacity">0.6</CssParameter>
             </Fill>
          </PolygonSymbolizer>
        </Rule>
        <Rule>
          <Title>100~999</Title>
          <ogc:Filter>
            <ogc:PropertyIsBetween>
              <ogc:PropertyName>infected_number</ogc:PropertyName>
              <ogc:LowerBoundary>
                <ogc:Literal>100</ogc:Literal>
              </ogc:LowerBoundary>
              <ogc:UpperBoundary>
                <ogc:Literal>999</ogc:Literal>
              </ogc:UpperBoundary>
            </ogc:PropertyIsBetween>
          </ogc:Filter>
          <PolygonSymbolizer>
             <Fill>
                <CssParameter name="fill">#FF0000</CssParameter>
                <CssParameter name="fill-opacity">0.8</CssParameter>
             </Fill>
          </PolygonSymbolizer>
        </Rule>
         <Rule>
          <Title>1000~9999</Title>
          <ogc:Filter>
            <ogc:PropertyIsBetween>
              <ogc:PropertyName>infected_number</ogc:PropertyName>
              <ogc:LowerBoundary>
                <ogc:Literal>1000</ogc:Literal>
              </ogc:LowerBoundary>
              <ogc:UpperBoundary>
                <ogc:Literal>9999</ogc:Literal>
              </ogc:UpperBoundary>
            </ogc:PropertyIsBetween>
          </ogc:Filter>
          <PolygonSymbolizer>
             <Fill>
                <CssParameter name="fill">#FF0000</CssParameter>
                <CssParameter name="fill-opacity">1</CssParameter>
             </Fill>
          </PolygonSymbolizer>
        </Rule>
     </FeatureTypeStyle>
    </UserStyle>
    </NamedLayer>
</StyledLayerDescriptor>
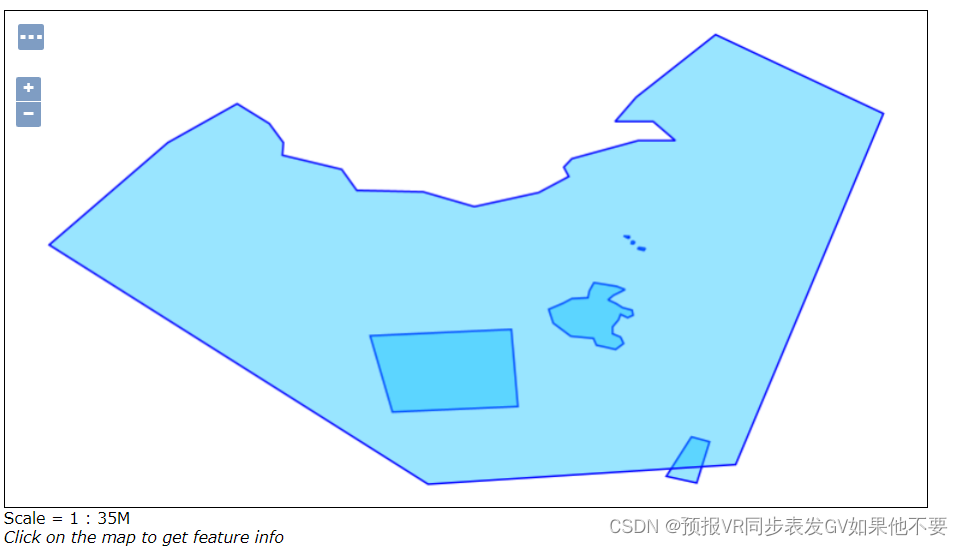
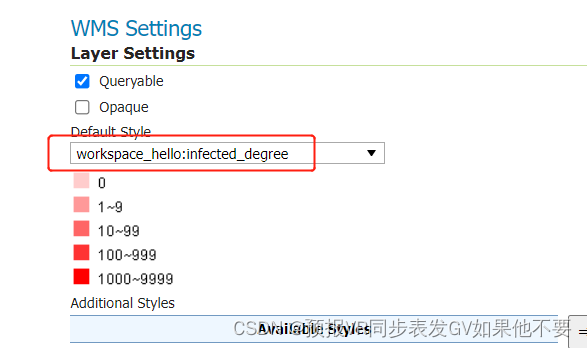
表示感染人数为0时,填充颜色不透明度为0.2;感染人数为1~9时,填充颜色不透明度为0.4,;感染人数为10~99时,填充颜色不透明度为0.6;感染人数为100~999时,填充颜色不透明度为0.8,;感染人数为1000~9999时,填充颜色不透明度为1。
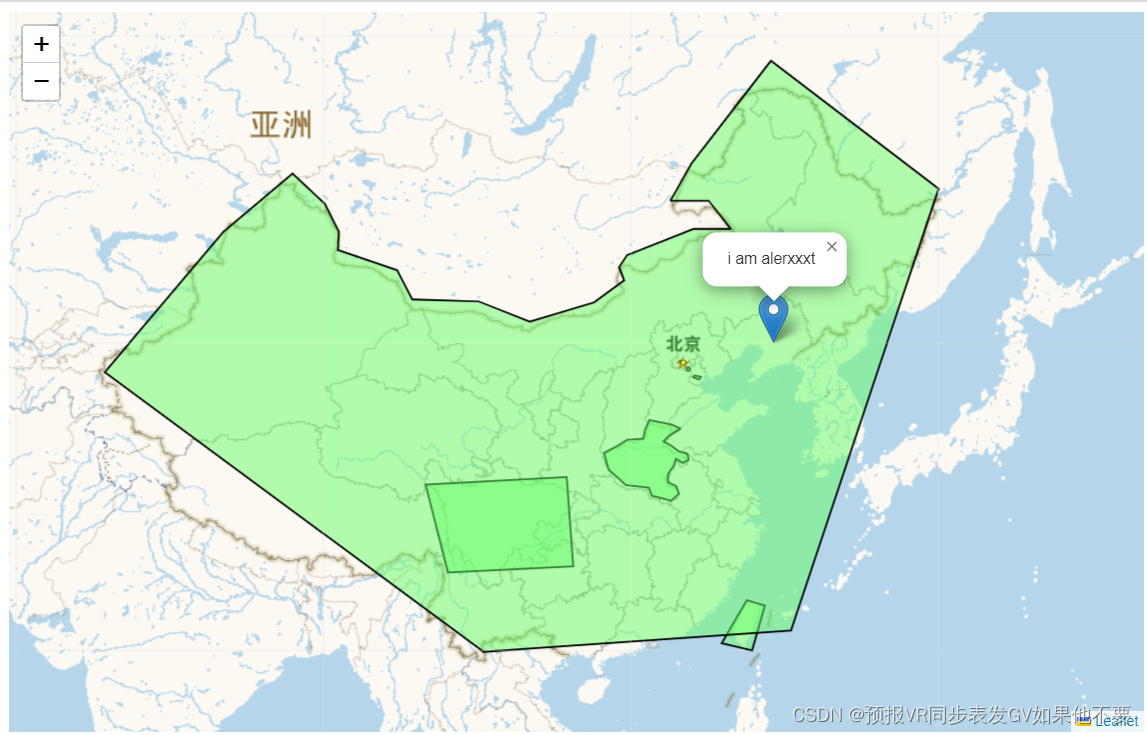
新建一个style "infected_degree"( 感染程序 ),修改该图层的 style 为 "infected_degree":
使用leaflet.js加载到百度地图上效果为:


 3267
3267


 被折叠的 条评论
为什么被折叠?
被折叠的 条评论
为什么被折叠?
 到【灌水乐园】发言


