


xhprof是php得高性能分析应用,以图形化的形式形象的展示出php项目的性能瓶颈与每个类或者模块在运行时的耗时,php程序员就可以对自己项目进行针对性的优化。
一、下载 xhprof-0.9.4
http://pecl.php.net/package/xhprof
tar -zxf xhprof-0.9.4.tgz
cd xhprof-0.9.4/extension/
which php-config
phpize
./configure --with-php-config=/usr/bin/php-config
make && make install
二、配置php.ini:
[xhprof]
extension=xhprof.so;
; directory used by default implementation of the iXHProfRuns
; interface (namely, the XHProfRuns_Default class) for storing
; XHProf runs.
;
;xhprof.output_dir=
xhprof.output_dir=/usr/local/xhprof/xhprof_log
三、使用xhprof
存放日志
mkdir -p /usr/local/xhprof/xhprof_log把
xhprof_lib/utils/xhprof_lib.php
xhprof_lib/utils/xhprof_runs.php
放到要检测的项目能访问的目录里,php代码需要加载这2个php
php代码:
xhprof_enable(XHPROF_FLAGS_NO_BUILTINS | XHPROF_FLAGS_CPU | XHPROF_FLAGS_MEMORY);

................这里是要被监控的代码块

$data = xhprof_disable();

include_once "xhprof_lib/utils/xhprof_lib.php";
include_once "xhprof_lib/utils/xhprof_runs.php";
$objXhprofRun = new XHProfRuns_Default();//数据会保存在php.ini中xhprof.output_dir设置的目录去中
$run_id = $objXhprofRun->save_run($data, "test");
var_dump($run_id);
把examples xhprof_html xhprof_lib三个目录放到/usr/local/xhprof里边
搭建apache 指向xhprof_html/index.php
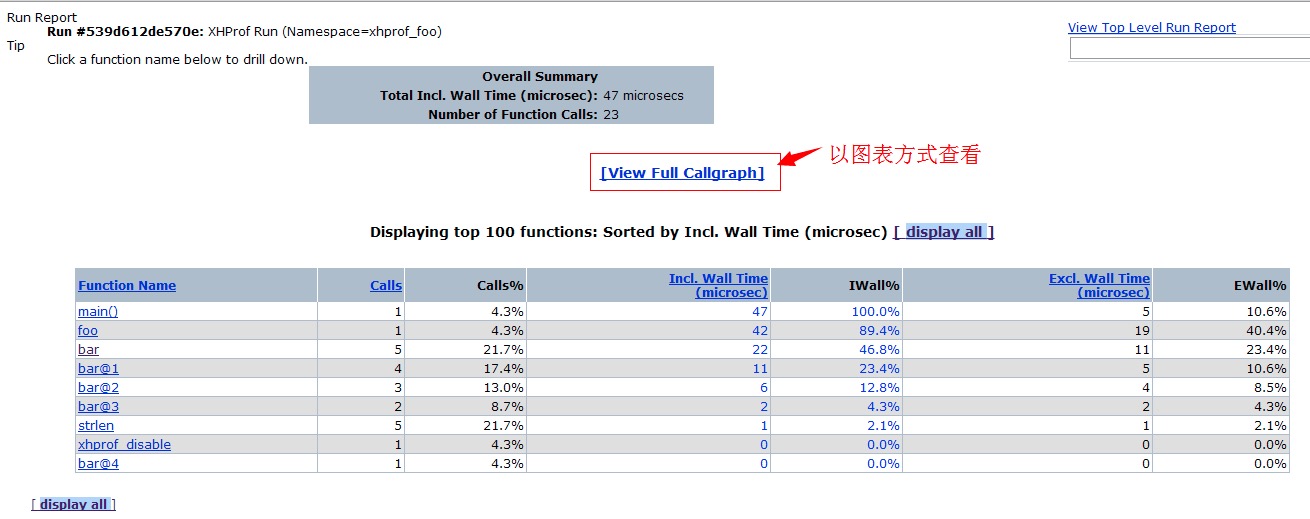
访问自己的服务器,例如:
http://myxhprof.net/index.php?run=553a1c8fecda0&source=test
如无法访问查看目录权限
ps -axu| grep httpd
查看字进程的所有者
chown -R web:web xhprof_log
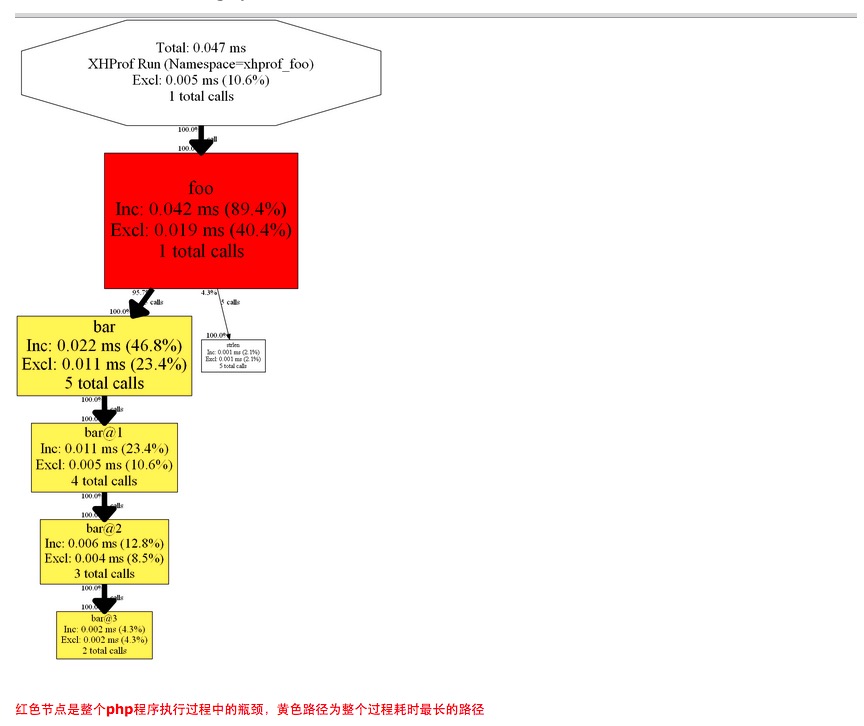
[View Full Callgraph]
需要安装graphviz图形绘制工具
http://www.graphviz.org/Download_linux_rhel.php


 1444
1444

 被折叠的 条评论
为什么被折叠?
被折叠的 条评论
为什么被折叠?
 到【灌水乐园】发言


