


下载echarts微信版 地址:https://github.com/ecomfe/echarts-for-weixin
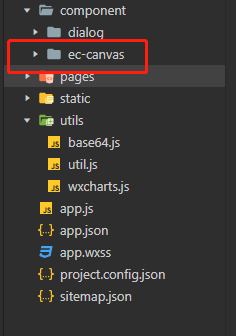
将ec-canvas目录 放在小程序项目目录中
在页面开启使用echarts
{
  "usingComponents": {
    "ec-canvas": "../../component/ec-canvas/ec-canvas"
  }
}
在wxml页面中,tuData是传给图的数据
<view class="ques-item" wx:for="{{itemanalysis}}" wx:key="*this" wx:for-index="index" wx:for-item="item">
        <view wx:if="{{item.type == 2}}" style="width:{{canvaswidth}}px;">
          <ec-canvas id="mychart-dom-pie" canvas-id="mychart-pie" tuData="{{item.distribution}}" ec="{{ ec }}"></ec-canvas>
        </view>
        <view wx:else style="width:{{canvaswidth}}px;">
          <ec-canvas id="mychart-dom-bar" canvas-id="mychart-bar" tuData="{{item.distribution}}" ec="{{ ec1 }}"></ec-canvas>
        </view>
      </view>
在js文件中引入echarts组件,并初始化方法,这部分写在page最外层
import * as echarts from '../../component/ec-canvas/echarts';
function initChart(canvas, width, height, data) {//这里多加一个参数
  const chart = echarts.init(canvas, null, {
    width: width,
    height: height
  })
  canvas.setChart(chart);
  var option = {
    series: [
      {
        name: '试题分析',
        type: 'pie',
        radius: ['25%', '40%'],
        animationType: 'scale',
        silent: true,
        labelLine: {
          normal: {
            show: true
          }
        },
        label: {
          formatter: '{b|{b}:}\n{per|{d}%}  ',
          backgroundColor: '#fff',
          borderColor: '#aaa',
          borderWidth: 0,
          borderRadius: 4,
          rich: {
            b: {
              fontSize: 10,
              lineHeight: 10
            },
            per: {
              fontSize: 10,
              align:'center'
            }
          }
        },
        data: data,
        color: ["#3DCCB4", "#FF6B66"]
      }
    ]
  }
  chart.setOption(option);
  return chart;
}
function initChartBar(canvas, width, height, data) {//这里多加一个参数
  var optionsArr = ["A","B","C","D","E","F","G","H","I","J","K"];
  const chart = echarts.init(canvas, null, {
    width: width,
    height: height
  })
  canvas.setChart(chart);
  var option = {
    grid: {
      height: '90',
      bottom: 25,
      top:20
    },
    xAxis: {
      type: 'category',
      data: optionsArr.slice(0,data.length),
      axisLine: {
        show: false
      },
      axisTick: {
        show: false
      }
    },
    yAxis: {
      show: false,
      scale: true
    },
    series: [{
      data: data,
      barWidth: 10,
      itemStyle: {
        normal: {
          color: function (params) {
            console.log(params)
            if(params.data.right)
              return '#3DCCB4'
            else
              return '#FF6B66'
          },
        }

      },
      type: 'bar'
    }, {
        data: [100, 100, 100, 100, 100, 100, 100],
        type: 'bar',
        barWidth: 10,
        barGap:'-100%',
        barCategoryGap:'40%',
        itemStyle:{
          normal: { color:'rgba(61, 204, 180, 0.1)'}
        }
      }]
  };
  chart.setOption(option);
  return chart;
}
在page的data中
data: {
    ec: {
      onInit: initChart
    },
    ec1: {
      onInit: initChartBar
    },
    itemanalysis:[],
    scrollHeight: wx.getSystemInfoSync().windowHeight-100,
    canvaswidth: wx.getSystemInfoSync().windowWidth-150,
  },


 1050
1050


 被折叠的 条评论
为什么被折叠?
被折叠的 条评论
为什么被折叠?
 到【灌水乐园】发言


