


区域边界及级联
1.获取区域边界JSON数据,下载后放到项目里
https://datav.aliyun.com/portal/school/atlas/area_selector
data() {
    return {
      areaFeaturesData: null, // 南通市json数据
      areaLayer: null, // 区域边界图层
      isCheckClick: false,
      currentArea: null, // 当前json所属区划code
      areaLayerStyle: {
        'color': 'red', // 边框颜色
        'weight': 2, // 边框粗细
        'opacity': 0.4, // 透明度
        'fillColor': 'red', // 区域填充颜色
        'fillOpacity': 0.1 // 区域填充颜色的透明
      }
    }
  }

methods: {
// 获取JSON文件中的json数据
this.$axios.get(`/json/sjkbmap/area.json`).then((data) => {
  this.areaFeaturesData = data.data
   this.initAreaForJson()
 })
initAreaForJson() { // 初始化区域边界Json
	this.areaLayer = L.geoJSON(this.areaFeaturesData, {style: this.areaLayerStyle, onEachFeature: this.onEachFeature}).addTo(this.map)
	this.bindAreaLayerEvent()
}

onEachFeature(feature, layer) { // 设置鼠标移动到对应区域时悬浮显示内容
	var a = '名称:' + obj.name + '<br>无人机:' + (obj.wrjsl ? obj.wrjsl : 0)
	layer.bindTooltip(a, {sticky: true, className: 'leaflet-custom-tooltip'})
}

bindAreaLayerEvent() {  // 绑定区域边界事件(移入区域时,对应区域高亮、移出取消高亮、点击对应区域时级联显示点击的区域及子区域)
      // 监听鼠标移动事件
      this.areaLayer.on('mouseover', (data) => {
        console.log('mouseover')
        // 鼠标移到区域范围内时高亮
        var feature = data.layer
        feature.setStyle({
          'color': 'blue', // 边框颜色
          'weight': 2, // 边框粗细
          'opacity': 0.4, // 透明度
          'fillColor': 'blue', // 区域填充颜色
          'fillOpacity': 0.6 // 区域填充颜色的透明
        })
      })
      this.areaLayer.on('mouseout', () => {
        // 移出区域范围取消高亮
        this.areaLayer.setStyle(this.areaLayerStyle)
      })
      this.areaLayer.on('click', (data) => {
        this.currentArea = {
          code: data.layer.feature.properties.adcode,
          pointArr: data.layer.feature.geometry.coordinates
        }
        this.areaLayer.clearLayers()
        var areaJson = null
        this.areaFeaturesData.features.forEach((item, index) => {
          if (item.properties.adcode === data.layer.feature.properties.adcode) {
            areaJson = item
          }
        })
        var center = [areaJson.properties.center[1], areaJson.properties.center[0]]
        this.map.setView(center, '10')
        this.areaLayer = L.geoJSON(areaJson, {style: this.areaLayerStyle}).addTo(this.map)
        this.bindAreaLayerEvent()
      })
    }
}
右键菜单
js、css文件下载地址:
链接:https://pan.baidu.com/s/1pX_ZmEA2il_k42cX25dhnQ 提取码:vz6r
import '@/components/leaflet/leaflet.contextmenu.js'
import '@/components/leaflet/leaflet.contextmenu.css'

map.options: {
        preferCanvas: true,
        contextmenu: true,
        contextmenuWidth: 140,
        contextmenuItems: [{
          text: '刷新',
          iconCls: 'fa fa-undo',
          callback: this.refresh
        }]
}

// 监听鼠标右键事件,然后动态添加菜单
this.map.on('contextmenu', (evt) => {
var that = this
var id = '1'
var contextmenu = evt.contextmenu
contextmenu.removeAllItems()    // 删除全部菜单
var contextmenuItems = {
  text: '刷新',
  iconCls: 'fa fa-undo',
  callback: function() {
    that.contextmenuEvent(id)	// 具体业务方法
  }
}
contextmenu.addItem(contextmenuItems)   // 添加菜单
})
热力图
// 热力图
npm i leaflet.heat

import 'leaflet.heat'

 /** 热力图 */
let heatDataList = []
for (let i = 0; i < 50; i++) {
  var v = {
	wd: '纬度',
	jd:‘经度’
}
  let group = [v.wd, v.jd]
  heatDataList.push(group)
}
// 生成热力图图层,并添加到地图中
var heat = L.heatLayer(heatDataList, {
  radius: 12,
  minOpacity: 0.7
}).addTo(this.map)

//清空热力图
heat.setLatLngs([])
经纬度网格
方法一:
addLonLatLine() { // 添加网格线
      this.lonLatGridLineLayer = L.featureGroup().addTo(this.map)
      let zoom = this.map.getZoom()
      let bounds = this.map.getBounds()
      let north = bounds.getNorth()
      let east = bounds.getEast()
      // 经纬度间隔
      let d = 90 / Math.pow(2, zoom - 1)
      // 经线网格
      for (let index = -180; index <= 360; index += d) {
        // 判断当前视野内
        if (bounds.contains([north, index])) {
          // 绘制经线
          let lonLine = L.polyline(
            [
              [-90, index],
              [90, index]
            ],
            { weight: 1, color: 'grey' }
          )
          this.lonLatGridLineLayer.addLayer(lonLine)
          // 标注
          let text = index.toFixed(1) + '°'
          // 动态计算小数位数
          if (zoom > 10) {
            text = index.toFixed((zoom - 8) / 2) + '°'
          }
          let divIcon = L.divIcon({
            html: `<div style="white-space: nowrap;color:black;">${text}</div>`,
            iconAnchor: [0, -5]
          })
          let textMarker = L.marker([north, index], { icon: divIcon })
          this.lonLatGridLineLayer.addLayer(textMarker)
          if (d > 90) {
            d = 90
          }
          // 纬线网格
          for (let index = -90; index <= 90; index += d) {
            if (bounds.contains([index, east])) {
              let lonLine = L.polyline(
                [
                  [index, -180],
                  [index, 360]
                ],
                { weight: 1, color: 'grey' }
              )
              this.lonLatGridLineLayer.addLayer(lonLine)
              // 标注
              let text = index.toFixed(1) + '°'
              if (zoom > 10) {
                text = index.toFixed((zoom - 8) / 2) + '°'
              }
              let divIcon = L.divIcon({
                html: `<div style="white-space: nowrap;color:black;">${text}</div>`,
                iconAnchor: [(text.length + 1) * 6, 0]
              })
              let textMarker = L.marker([index, east], { icon: divIcon })
              this.lonLatGridLineLayer.addLayer(textMarker)
            }
          }
        }
      }
    }

方法二:
1.npm install leaflet-lonlat-gridlines
2.import {LeafletDrawLonlatLine} from "leaflet-lonlat-gridlines";
3.
this.lonLatGridLines = new LeafletDrawLonlatLine(this.map)
// 经纬线设置为蓝色
this.lonLatGridLines.setLineColor('blue')
// 经纬线度数文本颜色调整为红色
this.lonLatGridLines.setTextColor('red')
// 经纬线度数文本只显示北边(经度值)和东边(纬度值)
this.lonLatGridLines.setTextPosition('right')
// 初始化话的时候,触发一次绘制*/
this.lonLatGridLines.drawLonlatTileGrid()
// 添加绘制地图事件(即拖动地图时,清除上一次的图层的同时绘制新的图层)*/
this.lonLatGridLines.addDrawEvent()

方法三:
代码地址:https://github.com/cloudybay/leaflet.latlng-graticule
import '@/components/leaflet/leaflet.latlng-graticule.js'
L.latlngGraticule({
        showLabel: true,
        opacity: 1,
        weight: 0.8,
        color: 'red',
        font: '20px Verdana',
        dashArray: [0, 0],
        lngLineCurved: 0,
        latLineCurved: 0,
        zoomInterval: [
          {start: 2, end: 2, interval: 60},
          {start: 3, end: 3, interval: 30},
          {start: 4, end: 4, interval: 15},
          {start: 5, end: 5, interval: 7.5},
          {start: 6, end: 6, interval: 4},
          {start: 7, end: 7, interval: 2},
          {start: 8, end: 8, interval: 1},
          {start: 9, end: 9, interval: 0.5},
          {start: 10, end: 10, interval: 0.25},
          {start: 11, end: 11, interval: 0.125},
          {start: 12, end: 12, interval: 0.0625},
          {start: 13, end: 13, interval: 0.033333333},
          {start: 14, end: 14, interval: 0.016666666666},
          {start: 15, end: 15, interval: 0.008333333},
          {start: 16, end: 16, interval: 0.004166667},
          {start: 17, end: 17, interval: 0.002083333},
          {start: 18, end: 18, interval: 0.001041667}
        ]
      }).addTo(this.map)
台风
相关表sql文件及前端js、vue文件地址:
链接:https://pan.baidu.com/s/1LCUXo2J-WA5eXzZ7fFSLUQ
提取码:9kr5
1、引入
import LayerTyphoon from '@/components/leaflet-typhoon/LayerTyphoon.vue'

2、定义
<LayerTyphoon ref="layerTyphoon" :map="map" :dataList="typhoonList"></LayerTyphoon>

3、赋值台风数据信息
typhoonList = 台风信息
雷达扩散
实际效果:
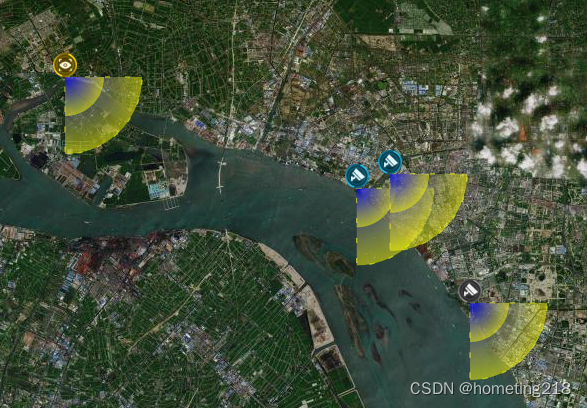
npm install --save leaflet-radar

drawJkqy(data) {  // 监控区域范围
  if (data.param) {	// 开启范围区域
    this.tbBGeoList.forEach((item, index) => {
      var location = '' + item.wd + ' ' + item.jd	// 纬度 + 空格 + 经度
      let radar = new Radar({
        radius: 5000, // 半径
        angle: 90, // 角度
        direction: 135, // 方向
        location: location // 位置(纬度 + 空格 + 经度)
      }, {
        online: {
          color: '#dd2',
          dashArray: [5, 15],
          weight: 1,
          opacity: 1,
          fillColor: '#d21',
          fillOpacity: 0.5
        },
        animat: {
          color: '#238',
          weight: 0,
          opacity: 0,
          fillColor: '#ff0',
          fillOpacity: 0.5,
          pmIgnore: true
        },
        step: 12
      })
      radar.addTo(this.map)
      this.group.push(radar)
    })
  } else {	// 关闭
    if (this.group && this.group.length > 0) {
      this.group.forEach((item, index) => {
        this.map.removeLayer(item)
      })
    }
  }
}


 1675
1675


 被折叠的 条评论
为什么被折叠?
被折叠的 条评论
为什么被折叠?
 到【灌水乐园】发言


