


1.首先在index.html里添加
<script src='https://webapi.amap.com/mapsv=1.3&key=自己的key&plugin=AMap.DistrictSearch'>
 </script>
    <script src="https://webapi.amap.com/ui/1.0/main.js"></script>
2.在项目里npm下载并引入echarts
import echarts from "echarts";3.实例化地图
1.html部分
<div class="echarts">
    <div class="top"></div>
    <div class="bot">
      <div class="left">
            //清除浏览器默认右键事件
        <div class="sctterMap" ref="sctterMap" @contextmenu.prevent></div>
        <div class="mapChoose">
          <span v-for="(item,index) in parentInfo" :key="item.code">
            <span
              class="title"
              @click="chooseArea(item,index)"
            >{{item.cityName=='江西省'?'江西省':item.cityName}}</span>
            <span class="icon" v-show="index+1!=parentInfo.length">></span>
          </span>
        </div>

      </div>

    </div>
  </div>
2.css部分
.echarts {
  width: 100%;
  height: 100%;
  background: url("../assets/切图/1.png") no-repeat;
//背景 替换自己的图片
  background-size: 100% 100%;
  display: flex;
  flex-direction: column;
  color: #fff;
  font-size: 13px;
  .bot {
    height: 100%;
    width: 100%;
    display: flex;
    .left {
      width: 35%;
      height: 100%;
      position: relative;
      .sctterMap {
        width: 100%;
        height: 75%;
        background: url("../assets/切图/圆.png") no-repeat center;
//背景 替换自己的图片
        background-size: 90% 60%;
        position: relative;
      }
      .mapChoose {
        position: absolute;
        left: 20px;
        top: 5px;
        color: #eee;

        .title {
          padding: 5px;
          border-top: 1px solid rgba(147, 235, 248, 0.8);
          border-bottom: 1px solid rgba(147, 235, 248, 0.8);
          cursor: pointer;
        }

        .icon {
          font-family: "simsun";
          font-size: 25px;
          margin: 0 11px;
        }
      }

    }

  }

}
3.js部分
data() {
return {
myCharts: null,
geoJson: {
features: []
},
parentInfo: [
//全国的编码为100000,这里从江西下钻
{
cityName: "江西省",
code: 360000
}
],
index: 0,
duration: 3000,
// 初始值
startVal: 0,
// 最终值
endVal: 112018
};
},
mounted() {
//全国的编码为100000,这里从江西下钻
this.getGeoJson(360000);
this.initMychart();
},
methods: {
getGeoJson(adcode) {
let that = this;
AMapUI.loadUI(["geo/DistrictExplorer"], DistrictExplorer => {
var districtExplorer = new DistrictExplorer();
districtExplorer.loadAreaNode(adcode, function(error, areaNode) {
if (error) {
console.error(error);
return;
}
let Json = areaNode.getSubFeatures();
if (Json.length > 0) {
that.geoJson.features = Json;
} else if (Json.length === 0) {
that.geoJson.features = that.geoJson.features.filter(
item => item.properties.adcode == adcode
);
if (that.geoJson.features.length === 0) return;
}
that.getMapData();
});
});
},
//获取数据
getMapData() {
let mapData = this.geoJson.features.map(item => {
return {
name: item.properties.name,
value: Math.random() * 1000,
cityCode: item.properties.adcode
};
});
mapData = mapData.sort(function(a, b) {
return b.value - a.value;
});
this.initEcharts(mapData);
},
initEcharts(mapData) {
console.log(mapData, "地图数据");
var min = mapData[mapData.length - 1].value;
var max = mapData[0].value;
if (mapData.length === 1) {
min = 0;
}
this.myChart = echarts.init(this.$refs.sctterMap);
echarts.registerMap("Map", this.geoJson); //注册
this.myChart.setOption(
{
geo: [
{
// 这个是重点 —— 这里设置为地图的阴影
map: "Map",
top: "11%",
roam: false, // 禁止拖拽
silent: true, // 禁止hover效果
zoom: 1.1, // 地图比例
// center: [105.194115019531, 36.582111640625], // 地图中心位置, 此处的纬度与下面的center相差1度是形成阴影的距离,可自己随意调整
itemStyle: {
normal: {
borderColor: "#fff",
areaColor: "transparent"
}
}
},
{
// 这个是重点 —— 这里设置为地图的阴影
map: "Map",
top: "12%",
roam: false, // 禁止拖拽
silent: true, // 禁止hover效果
zoom: 1.1, // 地图比例
// center: [105.194115019531, 36.582111640625], // 地图中心位置, 此处的纬度与下面的center相差1度是形成阴影的距离,可自己随意调整
itemStyle: {
normal: {
borderColor: "#fff",
areaColor: "transparent"
}
}
}
],
tooltip: {
trigger: "item",
formatter: p => {
let val = p.value;
if (!val) {
val = 0;
}
let txtCon = p.name + ":" + val.toFixed(2);
return txtCon;
}
},
visualMap: {
min: min,
max: max,
left: "3%",
bottom: "5%",
calculable: false,
seriesIndex: [0],
inRange: {
color: ["#0f6153", "#29957b", "#01b053", "#94cf52"]
},
textStyle: {
color: "#24CFF4"
}
},
series: [
{
// geoIndex: 1 ,
name: "地图",
type: "map",
map: "Map",
roam: false, //是否可缩放
zoom: 1.1, //缩放比例
data: mapData,
label: {
normal: {
show: true,
color: "rgb(249, 249, 249)", //省份标签字体颜色
formatter: p => {
switch (p.name) {
case "内蒙古自治区":
p.name = "内蒙古";
break;
case "西藏自治区":
p.name = "西藏";
break;
case "新疆维吾尔自治区":
p.name = "新疆";
break;
case "宁夏回族自治区":
p.name = "宁夏";
break;
case "广西壮族自治区":
p.name = "广西";
break;
case "香港特别行政区":
p.name = "香港";
break;
case "澳门特别行政区":
p.name = "澳门";
break;
default:
break;
}
return p.name;
}
},
emphasis: {
show: true,
color: "#f75a00"
}
},
itemStyle: {
normal: {
areaColor: "#0a363b",
borderColor: "#2affde",
borderWidth: 1.5,
shadowBlur: 15,
shadowColor: "#2affde",
shadowOffsetX: 5,
shadowOffsetY: 3
},
emphasis: {
areaColor: "#8dd7fc",
borderWidth: 1.6,
shadowBlur: 25
}
}
}
]
},
true
);
window.addEventListener("resize", () => {
this.myChart.resize();
});
let that = this;
this.myChart.off("click");
// 右键返回
this.myChart.on("contextmenu", params => {
if (that.parentInfo.length - 1 > 0) {
that.parentInfo.splice(-1);
that.getGeoJson(that.parentInfo[that.parentInfo.length - 1].code);
params.event.preventDefault();
}
});
// 左键下钻
this.myChart.on("click", params => {
console.log(params, "数据");
if (
that.parentInfo[that.parentInfo.length - 1].code ==
params.data.cityCode
) {
return;
}
this.index += 1;
let data = params.data;
that.parentInfo.push({
cityName: data.name,
code: data.cityCode
});
that.getGeoJson(data.cityCode);
});
},
//选择切换市县
chooseArea(val, index) {
if (this.parentInfo.length === index + 1) {
return;
}
this.parentInfo.splice(index + 1);
this.getGeoJson(this.parentInfo[this.parentInfo.length - 1].code);
},
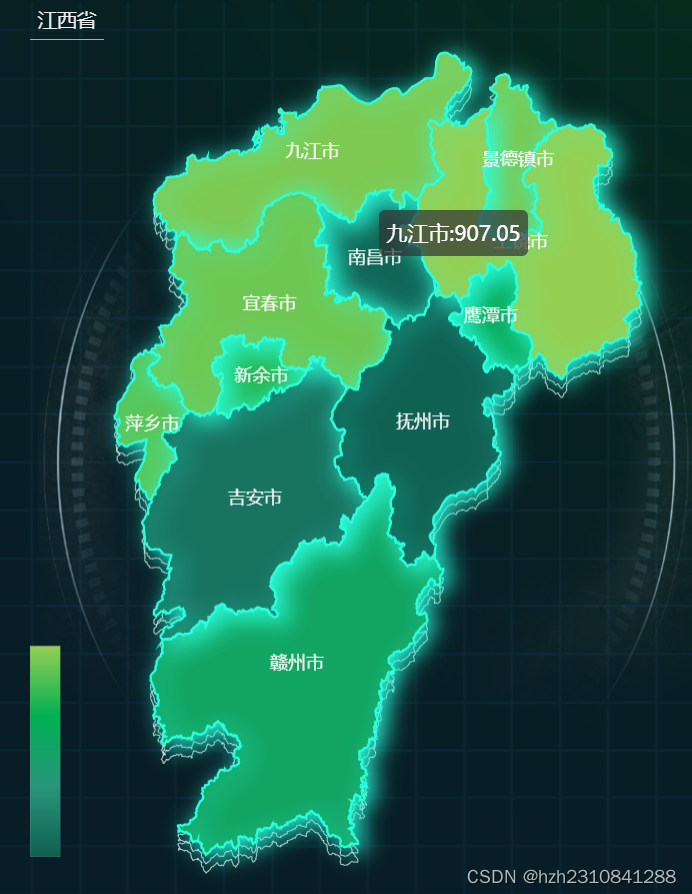
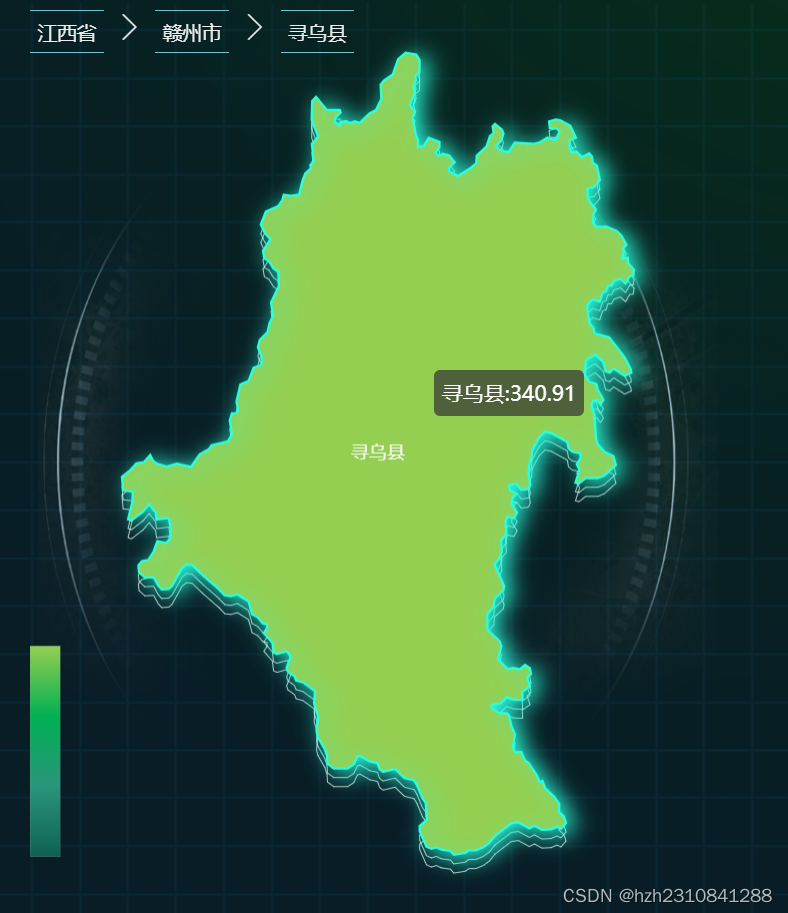
}4.效果


 3506
3506


 被折叠的 条评论
为什么被折叠?
被折叠的 条评论
为什么被折叠?
 到【灌水乐园】发言


