


这一节实在是有些长,翻译完后统计了一下,快到2w字了。考虑到阅读的方便和网络的速度,打算把这节分为5个部分,第一部分为双缓冲技术的一个简介和所有的代码,如果能够看懂代码,不用看译文也就可以了。第二部分为Plotter控件的公有函数的实现,第三部分为Plotter的事件处理函数的实现,第四部分为Plotter控件的私有函数实现,第五部分为辅助类PlotSettings的实现。
这里给出一些常用的中英文对照(不一定准确,我这样用的):
Rubber band(橡皮筋线,或者橡皮线), pixmap(图像,双缓冲中用到的图像,有时也直呼pixmap),off-screen pixmap(离线图像)
Plot(plot,这一节实现的就是一个绘制曲线的控件Plotter,有时原文也叫plot,有点小名的意思,没有翻译,直接呼之)
废话少说,以下是译文:
双缓冲技术是GUI编程中常用的技术。所谓的双缓冲就是把需要绘制的控件保存到一个图像中,然后在把图像拷贝到需要绘制的控件上。在Qt的早期版本中,为了用户界面更加清爽,经常用这个技术来消除闪烁。
在Qt4中,QWidget能够自动处理闪烁,因此我们不用再担心这个问题。尽管如此,如果控件绘制复杂且需要经常刷新,双缓冲技术还是很有用的。我们可以把控件永久保存在一个图像中,随时准备下一次绘制事件的到来,一旦接到一个控件的绘制事件,就把图片拷贝到控件上。如果我们要做的只是小范围的修改,这个技术更是尤为有用,如要绘制一条橡皮筋线,就不必刷新整个控件了。
在本章的最后一节,我们实现的是一个叫做Plotter的自定义控件。这个控件使用了双缓冲技术,也涉及到了Qt编程的其他方面:如键盘的事件处理,布局和坐标系统。
Plotter控件用来显示一条或者多条曲线,这些曲线由一组向量坐标表示。用户可以在显示的曲线上画一个橡皮筋线,Plotter控件对橡皮筋线包围的区域进行放大。用户用鼠标左键在控件上选择一个点,然后拖动鼠标走到另一点,然后释放鼠标,就在控件上绘制一条橡皮筋线。
Figure 5.7 Zooming in on the Plotter Widget
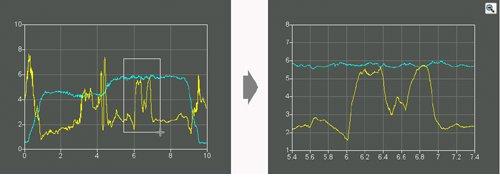
用户可以多次用橡皮筋线进行放大,也可以用ZoomOut按钮缩小,然后用ZoomIn按钮再放大。ZoomOut和ZoomIn按钮只是在控件第一次放大或者缩小操作后变得可见,如果用户不缩放图形,则这两个按钮会一直不可见,这样可以使绘图区域不那么混乱。
Plotter控件可以存储任何数量的曲线的数据。同时它还维护一个PlotSettings对象的堆栈区域,每一个PlotSettings对象都是对应一个特定的放缩值。
首先看一下头文件的代码(对头文件的解析在代码中用注释的形式给出):
#ifndef PLOTTER_H
#define PLOTTER_H
#include < QMap > // 包含的Qt的头文件
#include < QPixmap >
#include < QVector >
#include < QWidget >
class QToolButton; // 两个前向声明
class PlotSettings;
class Plotter : public QWidget
{
Q_OBJECT
public :
Plotter(QWidget * parent = 0 );
void setPlotSettings( const PlotSettings & settings);
void setCurveData( int id, const QVector < QPointF > & data);
void clearCurve( int id);
QSize minimumSizeHint() const ; // 重写QWidget::minimumSizeHint()
QSize sizeHint() const ; // 重写QWidget::sizeHint()
public slots:
void zoomIn(); // 放大曲线
void zoomOut(); // 缩小显示曲线
protected : // 重写的事件处理函数
void paintEvent(QPaintEvent * event );
void resizeEvent(QResizeEvent * event );
void mousePressEvent(QMouseEvent * event );
void mouseMoveEvent(QMouseEvent * event );
void mouseReleaseEvent(QMouseEvent * event );
void keyPressEvent(QKeyEvent * event );
void wheelEvent(QWheelEvent * event );
private :
void updateRubberBandRegion();
void refreshPixmap();
void drawGrid(QPainter * painter);
void drawCurves(QPainter * painter);
enum { Margin = 50 };
QToolButton * zoomInButton;
QToolButton * zoomOutButton;
QMap < int , QVector < QPointF > > curveMap; // 曲线数据
QVector < PlotSettings > zoomStack; // PlotSettings堆栈区域
int curZoom;
bool rubberBandIsShown;
QRect rubberBandRect;
QPixmap pixmap; // 显示在屏幕的控件的一个拷贝,任何绘制总是先在pixmap进行,然 // 后拷贝到控件上
};
// PlotSettings确定x,y轴的范围,和刻度的个数
class PlotSettings
{
public :
PlotSettings();
void scroll( int dx, int dy);
void adjust();
double spanX() const { return maxX - minX; }
double spanY() const { return maxY - minY; }
double minX;
double maxX;
int numXTicks;
double minY;
double maxY;
int numYTicks;
private :
static void adjustAxis( double & min, double & max, int & numTicks);
};
#endif
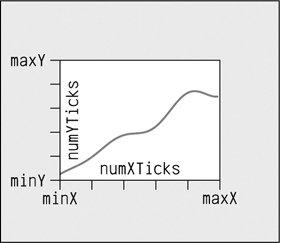
图5-8表示了Plotter控件和PlotSettings的关系。
通常,numXTicks和numYTicks是有一个的误差,如果numXTicks为5,实际上Plotter会在x轴上绘制6个刻度。这样可以简化以后的计算(至于怎么样简化的,就看程序和后文吧吧)。
Figure 5-8 PlotSettings's member variables
现在来看源文件(代码有些长,先用代码格式给出完整源文件代码):
#include
<
QtGui
>
#include < cmath >
#include " plotter.h "
Plotter::Plotter(QWidget * parent)
: QWidget(parent)
{
setBackgroundRole(QPalette::Dark);
setAutoFillBackground( true );
setSizePolicy(QSizePolicy::Expanding, QSizePolicy::Expanding);
setFocusPolicy(Qt::StrongFocus);
rubberBandIsShown = false ;
zoomInButton = new QToolButton( this );
zoomInButton -> setIcon(QIcon( " :/images/zoomin.png " ));
zoomInButton -> adjustSize();
connect(zoomInButton, SIGNAL(clicked()), this , SLOT(zoomIn()));
zoomOutButton = new QToolButton( this );
zoomOutButton -> setIcon(QIcon( " :/images/zoomout.png " ));
zoomOutButton -> adjustSize();
connect(zoomOutButton, SIGNAL(clicked()), this , SLOT(zoomOut()));
setPlotSettings(PlotSettings());
}
void Plotter::setPlotSettings( const PlotSettings & settings)
{
zoomStack.clear();
zoomStack.append(settings);
curZoom = 0 ;
zoomInButton -> hide();
zoomOutButton -> hide();
refreshPixmap();
}
void Plotter::zoomOut()
{
if (curZoom > 0 ) {
-- curZoom;
zoomOutButton -> setEnabled(curZoom > 0 );
zoomInButton -> setEnabled( true );
zoomInButton -> show();
refreshPixmap();
}
}
void Plotter::zoomIn()
{
if (curZoom < zoomStack.count() - 1 ) {
++ curZoom;
zoomInButton -> setEnabled(curZoom < zoomStack.count() - 1 );
zoomOutButton -> setEnabled( true );
zoomOutButton -> show();
refreshPixmap();
}
}
void Plotter::setCurveData( int id, const QVector < QPointF > & data)
{
curveMap[id] = data;
refreshPixmap();
}
void Plotter::clearCurve( int id)
{
curveMap.remove(id);
refreshPixmap();
}
QSize Plotter::minimumSizeHint() const
{
return QSize( 6 * Margin, 4 * Margin);
}
QSize Plotter::sizeHint() const
{
return QSize( 12 * Margin, 8 * Margin);
}
void Plotter::paintEvent(QPaintEvent * /* event */ )
{
QStylePainter painter( this );
painter.drawPixmap( 0 , 0 , pixmap);
if (rubberBandIsShown) {
painter.setPen(palette().light().color());
painter.drawRect(rubberBandRect.normalized()
.adjusted( 0 , 0 , - 1 , - 1 ));
}
if (hasFocus()) {
QStyleOptionFocusRect option;
option.initFrom( this );
option.backgroundColor = palette().dark().color();
painter.drawPrimitive(QStyle::PE_FrameFocusRect, option);
}
}
void Plotter::resizeEvent(QResizeEvent * /* event */ )
{
int x = width() - (zoomInButton -> width()
+ zoomOutButton -> width() + 10 );
zoomInButton -> move(x, 5 );
zoomOutButton -> move(x + zoomInButton -> width() + 5 , 5 );
refreshPixmap();
}
void Plotter::resizeEvent(QResizeEvent * /* event */ )
{
int x = width() - (zoomInButton -> width()
+ zoomOutButton -> width() + 10 );
zoomInButton -> move(x, 5 );
zoomOutButton -> move(x + zoomInButton -> width() + 5 , 5 );
refreshPixmap();
}
void Plotter::resizeEvent(QResizeEvent * /* event */ )
{
int x = width() - (zoomInButton -> width()
+ zoomOutButton -> width() + 10 );
zoomInButton -> move(x, 5 );
zoomOutButton -> move(x + zoomInButton -> width() + 5 , 5 );
refreshPixmap();
}
void Plotter::mousePressEvent(QMouseEvent * event )
{
QRect rect(Margin, Margin,
width() - 2 * Margin, height() - 2 * Margin);
if ( event -> button() == Qt::LeftButton) {
if (rect.contains( event -> pos())) {
rubberBandIsShown = true ;
rubberBandRect.setTopLeft( event -> pos());
rubberBandRect.setBottomRight( event -> pos());
updateRubberBandRegion();
setCursor(Qt::CrossCursor);
}
}
}
void Plotter::mouseMoveEvent(QMouseEvent * event )
{
if (rubberBandIsShown) {
updateRubberBandRegion();
rubberBandRect.setBottomRight( event -> pos());
updateRubberBandRegion();
}
}
void Plotter::mouseReleaseEvent(QMouseEvent * event )
{
if (( event -> button() == Qt::LeftButton) && rubberBandIsShown) {
rubberBandIsShown = false ;
updateRubberBandRegion();
unsetCursor();
QRect rect = rubberBandRect.normalized();
if (rect.width() < 4 || rect.height() < 4 )
return ;
rect.translate( - Margin, - Margin);
PlotSettings prevSettings = zoomStack[curZoom];
PlotSettings settings;
double dx = prevSettings.spanX() / (width() - 2 * Margin);
double dy = prevSettings.spanY() / (height() - 2 * Margin);
settings.minX = prevSettings.minX + dx * rect.left();
settings.maxX = prevSettings.minX + dx * rect.right();
settings.minY = prevSettings.maxY - dy * rect.bottom();
settings.maxY = prevSettings.maxY - dy * rect.top();
settings.adjust();
zoomStack.resize(curZoom + 1 );
zoomStack.append(settings);
zoomIn();
}
}
void Plotter::keyPressEvent(QKeyEvent * event )
{
switch ( event -> key()) {
case Qt::Key_Plus:
zoomIn();
break ;
case Qt::Key_Minus:
zoomOut();
break ;
case Qt::Key_Left:
zoomStack[curZoom].scroll( - 1 , 0 );
refreshPixmap();
break ;
case Qt::Key_Right:
zoomStack[curZoom].scroll( + 1 , 0 );
refreshPixmap();
break ;
case Qt::Key_Down:
zoomStack[curZoom].scroll( 0 , - 1 );
refreshPixmap();
break ;
case Qt::Key_Up:
zoomStack[curZoom].scroll( 0 , + 1 );
refreshPixmap();
break ;
default :
QWidget::keyPressEvent( event );
}
}
void Plotter::wheelEvent(QWheelEvent * event )
{
int numDegrees = event -> delta() / 8 ;
int numTicks = numDegrees / 15 ;
if ( event -> orientation() == Qt::Horizontal) {
zoomStack[curZoom].scroll(numTicks, 0 );
} else {
zoomStack[curZoom].scroll( 0 , numTicks);
}
refreshPixmap();
}
void Plotter::updateRubberBandRegion()
{
QRect rect = rubberBandRect.normalized();
update(rect.left(), rect.top(), rect.width(), 1 );
update(rect.left(), rect.top(), 1 , rect.height());
update(rect.left(), rect.bottom(), rect.width(), 1 );
update(rect.right(), rect.top(), 1 , rect.height());
}
void Plotter::refreshPixmap()
{
pixmap = QPixmap(size());
pixmap.fill( this , 0 , 0 );
QPainter painter( & pixmap);
painter.initFrom( this );
drawGrid( & painter);
drawCurves( & painter);
update();
}
void Plotter::drawGrid(QPainter * painter)
{
QRect rect(Margin, Margin,
width() - 2 * Margin, height() - 2 * Margin);
if ( ! rect.isValid())
return ;
PlotSettings settings = zoomStack[curZoom];
QPen quiteDark = palette().dark().color().light();
QPen light = palette().light().color();
for ( int i = 0 ; i <= settings.numXTicks; ++ i) {
int x = rect.left() + (i * (rect.width() - 1 )
/ settings.numXTicks);
double label = settings.minX + (i * settings.spanX()
/ settings.numXTicks);
painter -> setPen(quiteDark);
painter -> drawLine(x, rect.top(), x, rect.bottom());
painter -> setPen(light);
painter -> drawLine(x, rect.bottom(), x, rect.bottom() + 5 );
painter -> drawText(x - 50 , rect.bottom() + 5 , 100 , 15 ,
Qt::AlignHCenter | Qt::AlignTop,
QString::number(label));
}
for ( int j = 0 ; j <= settings.numYTicks; ++ j) {
int y = rect.bottom() - (j * (rect.height() - 1 )
/ settings.numYTicks);
double label = settings.minY + (j * settings.spanY()
/ settings.numYTicks);
painter -> setPen(quiteDark);
painter -> drawLine(rect.left(), y, rect.right(), y);
painter -> setPen(light);
painter -> drawLine(rect.left() - 5 , y, rect.left(), y);
painter -> drawText(rect.left() - Margin, y - 10 , Margin - 5 , 20 ,
Qt::AlignRight | Qt::AlignVCenter,
QString::number(label));
}
painter -> drawRect(rect.adjusted( 0 , 0 , - 1 , - 1 ));
}
void Plotter::drawCurves(QPainter * painter)
{
static const QColor colorForIds[ 6 ] = {
Qt::red, Qt::green, Qt::blue, Qt::cyan, Qt::magenta, Qt::yellow
};
PlotSettings settings = zoomStack[curZoom];
QRect rect(Margin, Margin,
width() - 2 * Margin, height() - 2 * Margin);
if ( ! rect.isValid())
return ;
painter -> setClipRect(rect.adjusted( + 1 , + 1 , - 1 , - 1 ));
QMapIterator < int , QVector < QPointF > > i(curveMap);
while (i.hasNext()) {
i.next();
int id = i.key();
const QVector < QPointF > & data = i.value();
QPolygonF polyline(data.count());
for ( int j = 0 ; j < data.count(); ++ j) {
double dx = data[j].x() - settings.minX;
double dy = data[j].y() - settings.minY;
double x = rect.left() + (dx * (rect.width() - 1 )
/ settings.spanX());
double y = rect.bottom() - (dy * (rect.height() - 1 )
/ settings.spanY());
polyline[j] = QPointF(x, y);
}
painter -> setPen(colorForIds[ uint (id) % 6 ]);
painter -> drawPolyline(polyline);
}
}
PlotSettings::PlotSettings()
{
minX = 0.0 ;
maxX = 10.0 ;
numXTicks = 5 ;
minY = 0.0 ;
maxY = 10.0 ;
numYTicks = 5 ;
}
void PlotSettings::scroll( int dx, int dy)
{
double stepX = spanX() / numXTicks;
minX += dx * stepX;
maxX += dx * stepX;
double stepY = spanY() / numYTicks;
minY += dy * stepY;
maxY += dy * stepY;
}
void PlotSettings::adjust()
{
adjustAxis(minX, maxX, numXTicks);
adjustAxis(minY, maxY, numYTicks);
}
void PlotSettings::adjustAxis( double & min, double & max,
int & numTicks)
{
const int MinTicks = 4 ;
double grossStep = (max - min) / MinTicks;
double step = pow( 10.0 , floor(log10(grossStep)));
if ( 5 * step < grossStep) {
step *= 5 ;
} else if ( 2 * step < grossStep) {
step *= 2 ;
}
numTicks = int (ceil(max / step) - floor(min / step));
if (numTicks < MinTicks)
numTicks = MinTicks;
min = floor(min / step) * step;
max = ceil(max / step) * step;
}


 6969
6969


 被折叠的 条评论
为什么被折叠?
被折叠的 条评论
为什么被折叠?
 到【灌水乐园】发言


