


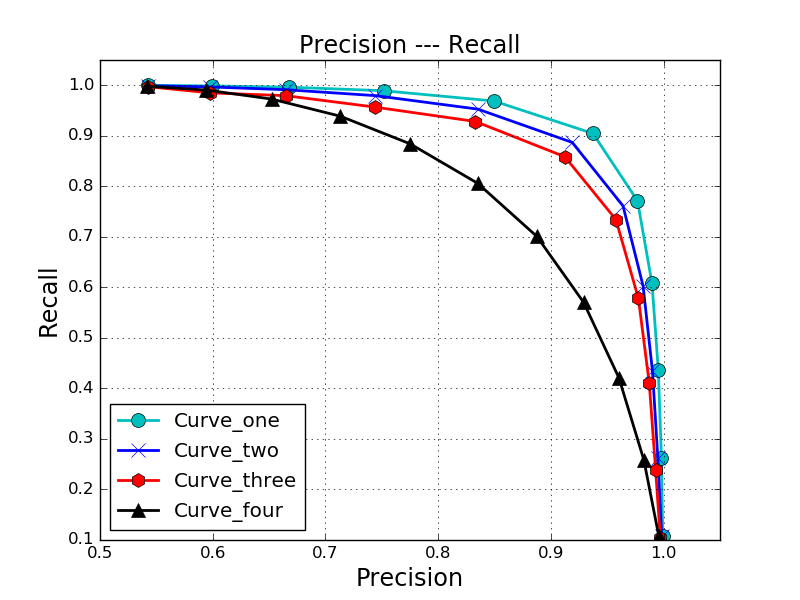
Precision与Recall的关系图,下面贴出原代码:
下图的Precision与Recall是自已实验的数据,作图时将它替换成自己的数据即可.
import matplotlib.pyplot as plt
import numpy as np


# draw the picture
def draw(Curve_one, Curve_two, Curve_three, Curve_four):

    plt.figure()

    plot1, = plt.plot(Curve_one[0], Curve_one[1],     'co-', linewidth=2.0, markersize=10.0)
    plot2, = plt.plot(Curve_two[0], Curve_two[1],     'bx-', linewidth=2.0, markersize=10.0)
    plot3, = plt.plot(Curve_three[0], Curve_three[1], 'rh-', linewidth=2.0, markersize=10.0)
    plot4, = plt.plot(Curve_four[0], Curve_four[1],   'k^-', linewidth=2.0, markersize=10.0)

    # set X axis
    plt.xlim( [0.5, 1.05] )
    plt.xticks( np.linspace(0.5, 1.0, 6) )
    plt.xlabel("Precision", fontsize="x-large")

    # set Y axis
    plt.ylim( [0.1, 1.05] )
    plt.yticks( np.linspace(0.1, 1.0, 10) )
    plt.ylabel("Recall",    fontsize="x-large")

    # set figure information
    plt.title("Precision --- Recall", fontsize="x-large")
    plt.legend([plot1, plot2, plot3, plot4], ("Curve_one", "Curve_two", "Curve_three", "Curve_four"), loc="lower left", numpoints=1)
    plt.grid(True)

    # draw the chart
    plt.show()


# main function
def main():
    # Curve one
    Curve_one = [ (0.999200, 0.998067, 0.995260, 0.989679, 0.976811, 0.937295, 0.849400, 0.751620, 0.667903, 0.599113, 0.542607),
                  (0.107668, 0.262707, 0.436613, 0.607831, 0.771336, 0.904606, 0.968826, 0.989191, 0.996214, 0.998741, 0.999759) ]

    # Curve two
    Curve_two  = [ (0.998300, 0.994883, 0.990090, 0.981757, 0.963972, 0.918909, 0.835273, 0.744247, 0.664585, 0.597868, 0.542286),
                   (0.107589, 0.261869, 0.434345, 0.602966, 0.761198, 0.886861, 0.952713, 0.979487, 0.991266, 0.996666, 0.999166) ]

    # Curve three
    Curve_three = [ (0.997050, 0.992867, 0.987220, 0.977600, 0.957650, 0.912350, 0.833100, 0.743753, 0.664700, 0.598011, 0.542317),
                    (0.103480, 0.239338, 0.411086, 0.578412, 0.734205, 0.858531, 0.928235, 0.956837, 0.979437, 0.984903, 0.997224) ]

    # Curve four
    Curve_four = [ (0.995750, 0.982433, 0.960270, 0.928964, 0.887517, 0.835059, 0.775115, 0.713273, 0.652159, 0.594189, 0.541702),
                   (0.107366, 0.258592, 0.421263, 0.570542, 0.700825, 0.805936, 0.884097, 0.938723, 0.972731, 0.990533, 0.998092) ]

    # Call the draw function
    draw(Curve_one, Curve_two, Curve_three, Curve_four)


# function entrance
if __name__ == "__main__":
    main()
效果图:


 229
229


 被折叠的 条评论
为什么被折叠?
被折叠的 条评论
为什么被折叠?
 到【灌水乐园】发言


