


grafana中使用Echarts 可视化
博客地址: https://b.top1.pub/
安装
- 安装echars插件
grafana-cli plugins install bilibala-echarts-panel - 重启grafana-server 服务
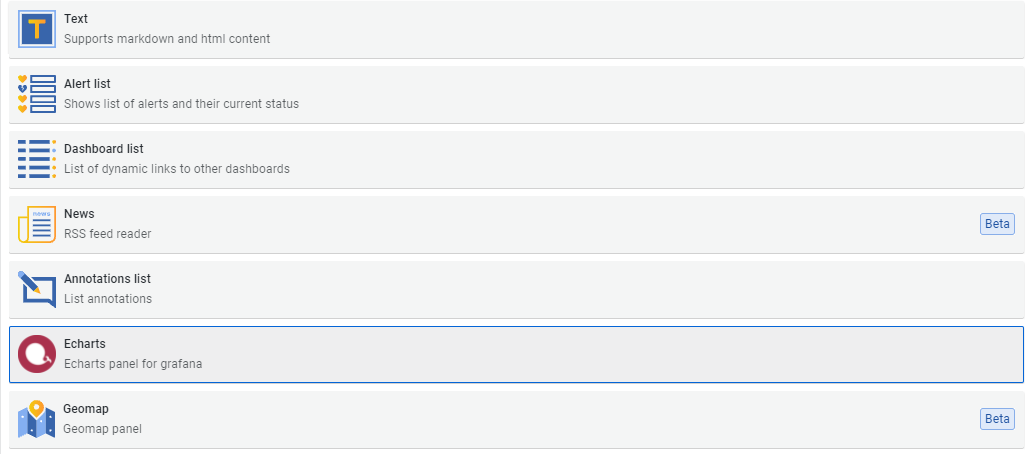
- 新建panel时,便可看到Echarts信息
使用柱状图
-
查询数据通过data获取到echarts
const series = data.series.map((s) => { const sTotal = s.fields.find((f) => f.name === 'total').values.buffer; const sBind = s.fields.find((f) => f.name === 'binded').values.buffer; const sQuarter = s.fields.find((f) => f.name === 'quarter').values.buffer; const sbindRate = s.fields.find((f) => f.name === 'bind_rate').values.buffer; return {total:sTotal,binded:sBind,quarter:sQuarter,bindRate:sbindRate} }) -
设置图表样式
option = { title: { text: '使用占比' }, tooltip: { trigger: 'axis', axisPointer: { type: 'cross', crossStyle: { color: '#999' } } }, toolbox: { feature: { dataView: { show: true, readOnly: false }, magicType: { show: true, type: ['line', 'bar'] }, restore: { show: true }, saveAsImage: { show: true } } }, legend: { data: ['总数', '使用数', '使用占比'] }, xAxis: [ { type: 'category', data: series[0].quarter, axisPointer: { type: 'shadow'} } ], yAxis: [ { type: 'value', name: '总班级', // min: 0, // max: 10000, // interval: 5000, axisLabel: { formatter: '{value}' } }, { type: 'value', name: '使用占比', // min: 0, // max: 25, // interval: 5, axisLabel: { formatter: '{value} %' } } ], series: [ { name: '总数', type: 'bar', barWidth: '20%', data:series[0].total, barGap: '-100%' }, { name: '使用数', type: 'bar', barWidth: '20%', data: series[0].binded }, { name: '占比', type: 'line', yAxisIndex: 1, data: series[0].bindRate } ] };-
配置参数
echartsInstance.setOption(option);
-


 2117
2117


 被折叠的 条评论
为什么被折叠?
被折叠的 条评论
为什么被折叠?
 到【灌水乐园】发言


