


有的
Web
项目选用
Excel
作为报表方案,在服务器端生成
Excel
文件,然后传送到客户端,由客户端进行打印。在国内的环境下,相对
PDF
方式,
Excel
的安装率应该比
pdf
阅读器的安装率要高,同时,微软也为
C#
操作
Excel
提供了完备的接口,虽然
ZedGraph
和其他的商业报表工具生成的统计图也很好,但是人家微软毕竟是大品牌,值得信赖。
本文介绍使用
C#
调用
Excel
来生成统计图(
Chart
)的以及
Chart
图中各部分控制的一些方法。
在上一篇使用C#和Excel进行报表开发(二)-操作统计图(Chart)
中,我们使用一个预定义的
Excel
文件,通过改变
Chart
中的某个值来生成统计图。本文进一步演示如何从指定的数据从头生成统计图。
首先当然要添加对
Excel
的引用,然后需要定义几个要用到的
Excel
对象:
Excel.Application ThisApplication = null;
Excel.Workbooks m_objBooks = null;
Excel._Workbook ThisWorkbook = null;
Excel.Worksheet xlSheet = null;
在创建一个新的
_WorkBook
对象的时候,默认的会含有
3
个
Sheet
,所以为了显示清晰,将多余的
Sheet
都删掉:
private
void DeleteSheet()
{
foreach (Excel.Worksheet ws in ThisWorkbook.Worksheets)
if (ws != ThisApplication.ActiveSheet)
{
ws.Delete();
}
foreach (Excel.Chart cht in ThisWorkbook.Charts)
cht.Delete();
}
再下来需要添加用来给
Chart
提供数据的
Sheet
:
private
void AddDatasheet()
{
xlSheet = (Excel.Worksheet)ThisWorkbook.
Worksheets.Add(Type.Missing, ThisWorkbook.ActiveSheet,
Type.Missing, Type.Missing);
xlSheet.Name = "
数据
"
;
}
生成
Chart
用到的数据,因为是演示,所以这里使用生成随机数的方法来替代从数据库中提取数据。
private
void LoadData()
{
Random ran = new Random();
for (int i = 1; i <= 12; i++)
{
xlSheet.Cells[i,1] = i.ToString() + "
月
"
;
xlSheet.Cells[i, 2] = ran.Next(2000).ToString();
}
}
好了,到此,准备工作全部已经就绪,下面要进行
Chart
的生成设置部分了:
生成一个统计图对象:
Excel.Chart xlChart = (Excel.Chart)ThisWorkbook.Charts.
Add(Type.Missing, xlSheet, Type.Missing, Type.Missing);
设定数据来源:
Excel.Range cellRange = (Excel.Range)xlSheet.Cells[1, 1];
通过向导生成
Chart
:
xlChart.ChartWizard(cellRange.CurrentRegion,
Excel.XlChartType.xl3DColumn, Type.Missing,
Excel.XlRowCol.xlColumns,1, 0, true ,
"
访问量比较
(dahuzizyd.cnblogs.com)"
, "
月份
"
, "
访问量
"
,
"");
到此,
Chart
的生成就完成了,貌似比较简单,下面我们对其作一些设置,好更漂亮些。
设置统计图
Sheet
的名称:
xlChart.Name = "
统计
"
;
现在的统计图只有一个组,他们会显示成一样的颜色,我们来让
12
个
Bar
都显示不同的颜色:
Excel.ChartGroup grp = (Excel.ChartGroup)xlChart.ChartGroups(1);
grp.GapWidth = 20;
grp.VaryByCategories = true;
现在
Chart
的条目的显示形状是
Box
,我们让它们变成圆柱形,并给它们显示加上数据标签:
Excel.Series s = (Excel.Series)grp.SeriesCollection(1);
s.BarShape = XlBarShape.xlCylinder;
s.HasDataLabels = true;
下面再来设置统计图的标题和图例的显示:
xlChart.Legend.Position = XlLegendPosition.xlLegendPositionTop;
xlChart.ChartTitle.Font.Size = 24;
xlChart.ChartTitle.Shadow = true;
xlChart.ChartTitle.Border.LineStyle = Excel.XlLineStyle.xlContinuous;
最后设置两个轴的属性,
Excel.XlAxisType.xlValue
对应的是
Y
轴,
Excel.XlAxisType.xlCategory
对应的是
X
轴:
Excel.Axis valueAxis = (Excel.Axis)xlChart.Axes(Excel.XlAxisType.xlValue, XlAxisGroup.xlPrimary);
valueAxis.AxisTitle.Orientation = -90;
Excel.Axis categoryAxis = (Excel.Axis)xlChart.Axes(Excel.XlAxisType.xlCategory, XlAxisGroup.xlPrimary);
categoryAxis.AxisTitle.Font.Name = "MS UI Gothic";
到此,一切就绪了,下面要生成
Chart
,并将其存为一个
Excel
文件:
 try
try


 {
{ ThisApplication=newExcel.Application();m_objBooks=(Excel.Workbooks)ThisApplication.Workbooks;ThisWorkbook=(Excel._Workbook)(m_objBooks.Add(Type.Missing));ThisApplication.DisplayAlerts=false;this.DeleteSheet();this.AddDatasheet();this.LoadData();CreateChart();ThisWorkbook.SaveAs("z:\\Book2.xls",Type.Missing,Type.Missing,Type.Missing,Type.Missing,Type.Missing,Excel.XlSaveAsAccessMode.xlNoChange,Type.Missing,Type.Missing,Type.Missing,Type.Missing);
 }
catch
(Exceptionex)
{MessageBox.Show(ex.Message);}
finally
{ThisWorkbook.Close(Type.Missing,Type.Missing,Type.Missing);ThisApplication.Workbooks.Close();ThisApplication.Quit();System.Runtime.InteropServices.Marshal.ReleaseComObject(ThisWorkbook);System.Runtime.InteropServices.Marshal.ReleaseComObject(ThisApplication);ThisWorkbook=null;ThisApplication=null;GC.Collect();this.Close();}
}
catch
(Exceptionex)
{MessageBox.Show(ex.Message);}
finally
{ThisWorkbook.Close(Type.Missing,Type.Missing,Type.Missing);ThisApplication.Workbooks.Close();ThisApplication.Quit();System.Runtime.InteropServices.Marshal.ReleaseComObject(ThisWorkbook);System.Runtime.InteropServices.Marshal.ReleaseComObject(ThisApplication);ThisWorkbook=null;ThisApplication=null;GC.Collect();this.Close();}
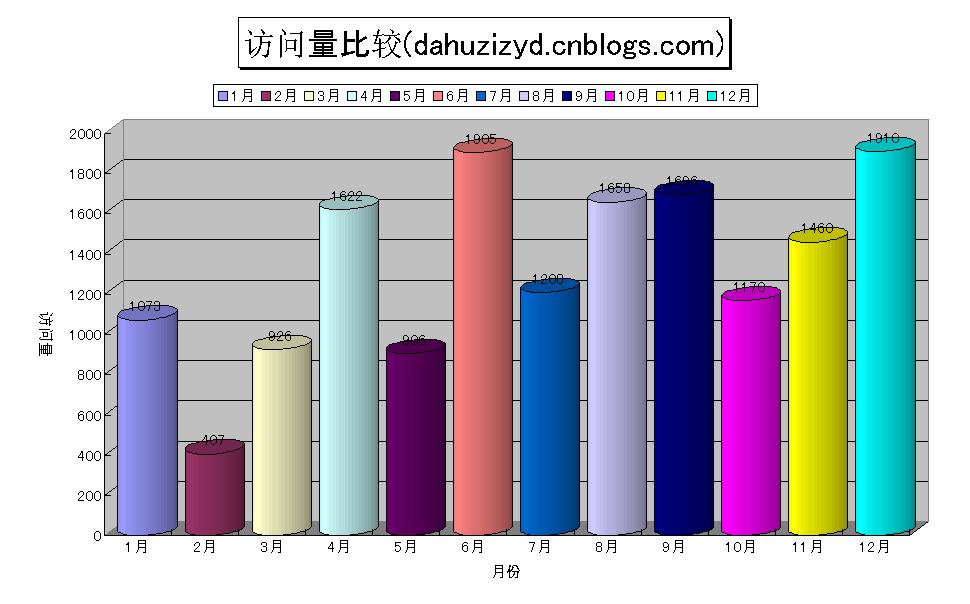
运行你的程序,打开生成的
Excel
文件,最终生成的
Chart
应该像这样:
完成了
Chart
的生成,但是上面对于每个月只有一项数据,如果我想显示多项呢,例如显示每个月两个页面的范围量的对比。方法很简单,只要再多生成一组数据就可以了,我们修改下
LoadData
方法:
private
void LoadData()
{
Random ran = new Random();
for (int i = 1; i <= 12; i++)
{
xlSheet.Cells[i,1] = i.ToString() + "
月
"
;
xlSheet.Cells[i, 2] = ran.Next(2000).ToString();
xlSheet.Cells[i,
3
] = ran.Next(
1500
).ToString();
}
}
再次运行程序,生成
Chart
看看,应该像下面的效果:
可以看到,两组数据以不同的形状显示,同时,图例部分也不再显示
1
-
12
月共
12
项,而是显示两项,这是因为在上面的代码中我们设置了
ChartGroup
的
VaryByCategories
属性:
grp.VaryByCategories = true;
当我们有两个以上的组时,这一项就失效了。
在用
C#
操作
Excel
的时候,恐怕最大的困难就在于不知道
Excel
提供的各个对象,以及它们的属性,方法等信息,好在
MSDN
里有关于
Excel
的接口说明-
Excel Primary Interop Assembly Reference
,参照这些,相信很快就能上手了。
最后是
完整代码:
<!--<br><br>Code highlighting produced by Actipro CodeHighlighter (freeware)<br>http://www.CodeHighlighter.com/<br><br>-->
privatevoidbutton4_Click(objectsender,EventArgse){try
 {ThisApplication=newExcel.Application();m_objBooks=(Excel.Workbooks)ThisApplication.Workbooks;ThisWorkbook=(Excel._Workbook)(m_objBooks.Add(Type.Missing));ThisApplication.DisplayAlerts=false;this.DeleteSheet();this.AddDatasheet();this.LoadData();CreateChart();ThisWorkbook.SaveAs("z:\\Book2.xls",Type.Missing,Type.Missing,Type.Missing,Type.Missing,Type.Missing,Excel.XlSaveAsAccessMode.xlNoChange,Type.Missing,Type.Missing,Type.Missing,Type.Missing);
 }catch(Exceptionex){MessageBox.Show(ex.Message);}finally{ThisWorkbook.Close(Type.Missing,Type.Missing,Type.Missing);ThisApplication.Workbooks.Close();ThisApplication.Quit();System.Runtime.InteropServices.Marshal.ReleaseComObject(ThisWorkbook);System.Runtime.InteropServices.Marshal.ReleaseComObject(ThisApplication);ThisWorkbook=null;ThisApplication=null;GC.Collect();this.Close();}}Excel.ApplicationThisApplication=null;Excel.Workbooksm_objBooks=null;Excel._WorkbookThisWorkbook=null;Excel.WorksheetxlSheet=null;/**////<summary>///用生成的随机数作数据///</summary>privatevoidLoadData(){Randomran=newRandom();for(inti=1;i<=12;i++){xlSheet.Cells[i,1]=i.ToString()+"月";xlSheet.Cells[i,2]=ran.Next(2000).ToString();}}/**////<summary>///删除多余的Sheet///</summary>privatevoidDeleteSheet(){foreach(Excel.WorksheetwsinThisWorkbook.Worksheets)if(ws!=ThisApplication.ActiveSheet){ws.Delete();}foreach(Excel.ChartchtinThisWorkbook.Charts)cht.Delete();}/**////<summary>///创建一个Sheet,用来存数据///</summary>privatevoidAddDatasheet(){xlSheet=(Excel.Worksheet)ThisWorkbook.Worksheets.Add(Type.Missing,ThisWorkbook.ActiveSheet,Type.Missing,Type.Missing);xlSheet.Name="数据";}/**////<summary>///创建统计图///</summary>privatevoidCreateChart(){Excel.ChartxlChart=(Excel.Chart)ThisWorkbook.Charts.Add(Type.Missing,xlSheet,Type.Missing,Type.Missing);Excel.RangecellRange=(Excel.Range)xlSheet.Cells[1,1];xlChart.ChartWizard(cellRange.CurrentRegion,Excel.XlChartType.xl3DColumn,Type.Missing,Excel.XlRowCol.xlColumns,1,0,true,"访问量比较(dahuzizyd.cnblogs.com)","月份","访问量","");xlChart.Name="统计";Excel.ChartGroupgrp=(Excel.ChartGroup)xlChart.ChartGroups(1);grp.GapWidth=20;grp.VaryByCategories=true;Excel.Seriess=(Excel.Series)grp.SeriesCollection(1);s.BarShape=XlBarShape.xlCylinder;s.HasDataLabels=true;xlChart.Legend.Position=XlLegendPosition.xlLegendPositionTop;xlChart.ChartTitle.Font.Size=24;xlChart.ChartTitle.Shadow=true;xlChart.ChartTitle.Border.LineStyle=Excel.XlLineStyle.xlContinuous;Excel.AxisvalueAxis=(Excel.Axis)xlChart.Axes(Excel.XlAxisType.xlValue,XlAxisGroup.xlPrimary);valueAxis.AxisTitle.Orientation=-90;Excel.AxiscategoryAxis=(Excel.Axis)xlChart.Axes(Excel.XlAxisType.xlCategory,XlAxisGroup.xlPrimary);categoryAxis.AxisTitle.Font.Name="MSUIGothic";}


 76
76

 被折叠的 条评论
为什么被折叠?
被折叠的 条评论
为什么被折叠?
 到【灌水乐园】发言


