


✿Android 程序调试工具
Google为我们提供的代码调试工具的亮点:traceview 和 dmtracedump 。有了这两个工具,我们调试程序分析bug就非常得心应手了。traceview帮助我们分析程序性能,dmtracedump生成函数调用图。遗憾的是,google提供的dmtracedump是个失败的工具,并不能绘图,本文会详细介绍解决方案,实现绘图。
✿生成.trace文件
android.os.Debug类,其中重要的两个方法Debug.startMethodTracing()和Debug.stopMethodTracing()。这两个方法用来创建.trace文件,将从Debug.startMethodTracing()开始,到Debug.stopMethodTracing()结束,期间所有的调用过程保存在.trace文件中,包括调用的函数名称和执行的时间等信息。
把下面代码分别在加在调试起始代码的位置,和终止位置。
其中参数test是要创建的trace文件的名称,test.trace。默认路径是/sdcard/test.trace,也可以自己制定/data/log/test,表示文件在/data/log/test.trace。
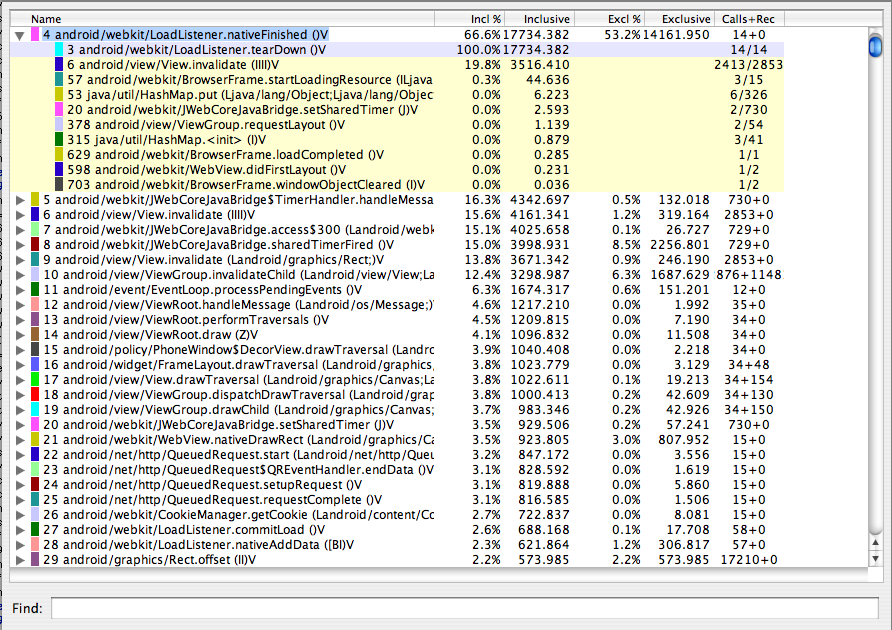
✿traceview
在SDK中执行 : ./traceview test.trace
我们可以得到
1.程序中每个线程调用方法的启动和停止时间

2.函数执行的信息和效率分析
✿dmtracedump
dmtracedump原本的用意是将整个调用过程和时间分析结合,以函数调用图的形式表现出来。可是google这个项目一直处于broken状态,迟迟不能得到完善。现在的dmtracdump只有-o选项可以使用,在终端上列出函数调用信息,和traceview功能相似,如果执行./dmtracedump –g test.png test.trace就会卡住不动。
起初我以为是test.trace文件的问题,对文件的结束符稍作修改,画出了一副雷人的图片:
后来,搜到了网络上有牛人提供了 dmtracedump的替代(这是原文链接),是一个python脚本,借助dot来绘制矢量图。python脚本一定要注意对齐格式,对齐缩进就是他的逻辑结构。
后来,搜到了网络上有牛人提供了 dmtracedump的替代(这是原文链接),是一个python脚本,借助dot来绘制矢量图。python脚本一定要注意对齐格式,对齐缩进就是他的逻辑结构。
#!/usr/bin/env python """ turn the traceview data into a jpg pic, showing methods call relationship """ import sys import os import struct import re ################################################################################ ######################## Global Variable ##################################### ################################################################################ target_thread=1 #the thread that we want to track, filt out other threads #all_actions = ["enter","exit","exception","reserved"] all_threads = {} all_methods = {} all_records = [] parent_methods = {} child_methods = {} method_calls = {} ################################################################################ ############################## Methods ##################################### ################################################################################ def add_one_thread(line): fields = line.split("/t") all_threads[int(fields[0],10)]=fields def add_one_method(line): fields = line.split("/t") all_methods[int(fields[0],16)]=fields def add_one_record(one): thread_id,=struct.unpack("B",one[:1]) if (thread_id == target_thread): tmp,=struct.unpack("L",one[1:5]) method_id= (tmp / 4) * 4; method_action= tmp % 4; time_offset,=struct.unpack("L",one[5:]) all_records.append([thread_id, method_id, method_action, time_offset]) def handle_one_call(parent_method_id,method_id): if not (parent_methods.has_key(parent_method_id)): parent_methods[parent_method_id]=1 if not (child_methods.has_key(method_id)): child_methods[method_id]=1 if method_calls.has_key(parent_method_id): if method_calls[parent_method_id].has_key(method_id): method_calls[parent_method_id][method_id]+=1 else: method_calls[parent_method_id][method_id]=1 else: method_calls[parent_method_id]={} method_calls[parent_method_id][method_id]=1 def gen_funcname(method_id): r1=re.compile(r'[/{1}lt;>]') str1=r1.sub("_",all_methods[method_id][1]) str2=r1.sub("_",all_methods[method_id][2]) return str1+"_"+str2 def gen_dot_script_file(): myoutfile = open("graph.dot", "w") myoutfile.write("digraph vanzo {/n/n"); for one in all_methods.keys(): if parent_methods.has_key(one): myoutfile.write(gen_funcname(one)+" [shape=rectangle];/n") else: if child_methods.has_key(one): myoutfile.write(gen_funcname(one)+" [shape=ellipse];/n") for one in method_calls.keys(): for two in method_calls[one]: myoutfile.write(gen_funcname(one) + ' -> ' + gen_funcname(two) + ' [label="' + str(method_calls[one][two]) + '" fontsize="10"];/n') myoutfile.write("/n}/n"); myoutfile.close ################################################################################ ########################## Script starts from here ############################# ################################################################################ if len(sys.argv) < 2: print 'No input file specified.' sys.exit() if not (os.path.exists(sys.argv[1])): print "input file not exists" sys.exit() #Now handle the text part current_section=0 for line in open(sys.argv[1]): line2 = line.strip() if (line2.startswith("*")): if (line2.startswith("*version")): current_section=1 else: if (line2.startswith("*threads")): current_section=2 else: if (line2.startswith("*methods")): current_section=3 else: if (line2.startswith("*end")): current_section=4 break continue if current_section==2: add_one_thread(line2) if current_section==3: add_one_method(line2) #Now handle the binary part mybinfile = open(sys.argv[1], "rb") alldata = mybinfile.read() mybinfile.close() pos=alldata.find("SLOW") offset,=struct.unpack("H",alldata[pos+6:pos+8]) pos2=pos+offset #pos2 is where the record begin numofrecords = len(alldata) - pos2 numofrecords = numofrecords / 9 for i in xrange(numofrecords): add_one_record(alldata[pos2 + i * 9:pos2 + i * 9 + 9]) my_stack=[0] for onerecord in all_records: thread_id=onerecord[0]; method_id=onerecord[1]; action=onerecord[2]; time=onerecord[3]; if(action==0): if(len(my_stack) > 1): parent_method_id=my_stack[-1] handle_one_call(parent_method_id,method_id) my_stack.append(method_id) else: if(action==1): if(len(my_stack) > 1): my_stack.pop() gen_dot_script_file() os.system("dot -Tjpg graph.dot -o output.jpg;rm -f graph.dot");
修改,/t变为\t,/n变为\n。
在计算器的源码onCreate中添加
Debug.startMethodTracing(“calc”); Log.v(LOG_TAGS”+++++++++++++++++++++++++test++++++++++++++++”); Debug.stopMethodTracing();
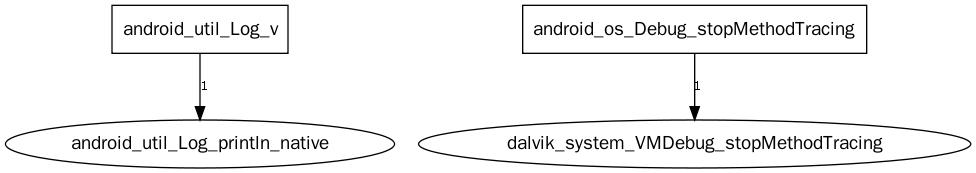
运行脚本得到calc.trace ,画出out.jpg
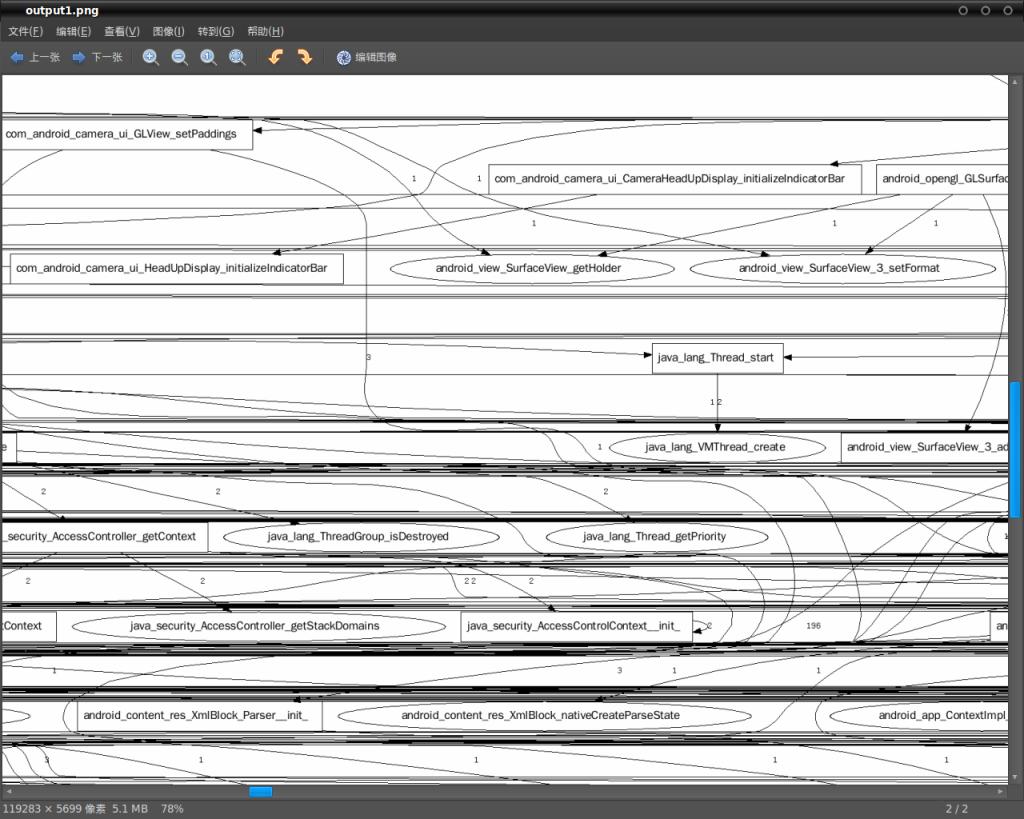
可当得到的trace文件比较复杂时画图就会崩溃。修改脚本最后执行dot命令时的参数,jpg格式太大容易崩溃,
-Tjpg改为-Tpng:gd,画大幅png。
我拿camera做了个实验,得到的png甚大,这是其中一角:
我拿camera做了个实验,得到的png甚大,这是其中一角:
OK
累死我了,又快1点了! >_< 晚安!


 837
837


 被折叠的 条评论
为什么被折叠?
被折叠的 条评论
为什么被折叠?
 到【灌水乐园】发言


