


 本文介绍了一款用于监测猪舍环境的APP,该应用能够实时显示温度、湿度和氨气浓度,并通过图表形式每秒更新数据。使用了com.github.mikephil.charting.charts.BarChart组件来展示数据。
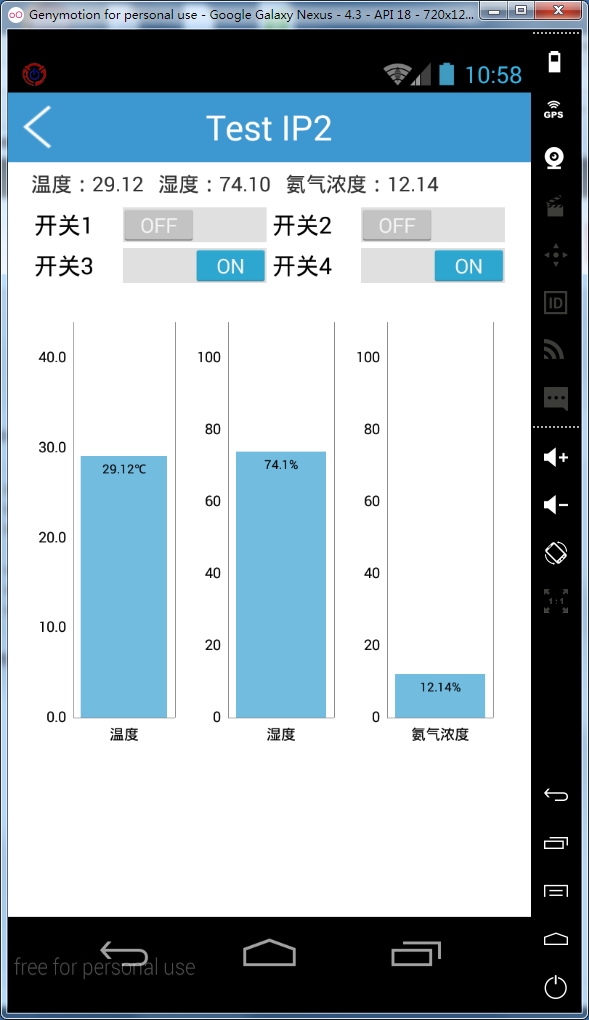
本人做的是关于猪舍的一个APP,需要将猪舍的环境数据(温度、湿度、和氨气浓度等)以报表的形式展现给客户,而且要求每隔1秒刷新一次报表数据。
xml文件,主要关注com.github.mikephil.charting.charts.BarChart标签内的:
<LinearLayout xmlns:android="http://schemas.android.com/apk/res/android"
    xmlns:tools="http://schemas.android.com/tools"
    android:layout_width="match_parent"
    android:layout_height="match_parent"
    android:background="@color/white"
    android:orientation="vertical"
    tools:context="com.wissea.trs.activity.MainActivity" >

    <!-- <include layout="@layout/actionbar_common" /> -->

    <ScrollView
        android:layout_width="match_parent"
        android:layout_height="match_parent" >

        <LinearLayout
            android:layout_width="match_parent"
            android:layout_height="match_parent"
            android:orientation="vertical"
            android:paddingLeft="@dimen/activity_horizontal_margin"
            android:paddingRight="@dimen/activity_horizontal_margin" >

            <!-- 环境数据 -->

            <LinearLayout
                android:layout_width="match_parent"
                android:layout_height="wrap_content"
                android:layout_marginBottom="5dp"
                android:layout_marginTop="5dp"
                android:orientation="horizontal" >

                <!-- 温度 -->

                <TextView
                    android:id="@+id/tv_temperature"
                    android:layout_width="wrap_content"
                    android:layout_height="wrap_content" />

                <!-- 湿度 -->

                <TextView
                    android:id="@+id/tv_humidity"
                    android:layout_width="wrap_content"
                    android:layout_height="wrap_content"
                    android:layout_marginLeft="10dp" />
                <!-- 氨气浓度 -->

                <TextView
                    android:id="@+id/tv_ammonia"
                    android:layout_width="wrap_content"
                    android:layout_height="wrap_content"
                    android:layout_marginLeft="10dp" />
            </LinearLayout>

            <!-- 开关 -->

            <LinearLayout
                android:layout_width="match_parent"
                android:layout_height="wrap_content"
                android:orientation="vertical" >

                <LinearLayout
                    android:layout_width="match_parent"
                    android:layout_height="wrap_content"
                    android:orientation="horizontal"
                    android:weightSum="2" >

                    <!-- 开关1 -->

                    <Switch
                        android:id="@+id/switch_one"
                        android:layout_width="0dp"
                        android:layout_height="wrap_content"
                        android:layout_weight="1"
                        android:gravity="center"
                        android:text="@string/label_switch_one" />
                    <!-- 开关2 -->

                    <Switch
                        android:id="@+id/switch_two"
                        android:layout_width="0dp"
                        android:layout_height="wrap_content"
                        android:layout_weight="1"
                        android:gravity="center"
                        android:text="@string/label_switch_two" />
                </LinearLayout>

                <LinearLayout
                    android:layout_width="match_parent"
                    android:layout_height="wrap_content"
                    android:layout_marginBottom="15dp"
                    android:orientation="horizontal"
                    android:weightSum="2" >

                    <!-- 开关3 -->

                    <Switch
                        android:id="@+id/switch_three"
                        android:layout_width="0dp"
                        android:layout_height="wrap_content"
                        android:layout_weight="1"
                        android:gravity="center"
                        android:text="@string/label_switch_three" />
                    <!-- 开关4 -->

                    <Switch
                        android:id="@+id/switch_four"
                        android:layout_width="0dp"
                        android:layout_height="wrap_content"
                        android:layout_weight="1"
                        android:gravity="center"
                        android:text="@string/label_switch_four" />
                </LinearLayout>
            </LinearLayout>

            <LinearLayout
                android:layout_width="match_parent"
                android:layout_height="300dp"
                android:orientation="horizontal"
                android:weightSum="3" >

                <!-- 温度 -->

                <com.github.mikephil.charting.charts.BarChart
                    android:id="@+id/bc_temperature"
                    android:layout_width="0dp"
                    android:layout_weight="1"
                    android:layout_height="300dp" />

                <!-- 湿度 -->

                <com.github.mikephil.charting.charts.BarChart
                    android:id="@+id/bc_humidity"
                    android:layout_width="0dp"
                    android:layout_weight="1"
                    android:layout_height="300dp" />

                <!-- 氨气浓度 -->

                <com.github.mikephil.charting.charts.BarChart
                    android:id="@+id/bc_ammonia"
                    android:layout_width="0dp"
                    android:layout_weight="1"
                    android:layout_height="300dp" />
            </LinearLayout>
        </LinearLayout>
    </ScrollView>

</LinearLayout>
1.获取数据的方法:
/**
     * @param type 数据类型:0代表温度, 1代表湿度, 2代表氨气浓度
     * @return 获取环境数据
     */
    private BarData getEnvironmentData(final int type) {
        ArrayList<String> xValues = new ArrayList<String>();

        // y轴的数据集合
        BarDataSet barDataSet = null;
        switch (type) {
        case 0:
            xValues.add("温度");
            mTemperatureBarEntry = new BarEntry(40.00f, 0);
            mTemperatureYValues = new ArrayList<BarEntry>();
            mTemperatureYValues.add(mTemperatureBarEntry);

            barDataSet = new BarDataSet(mTemperatureYValues, "");
            break;
        case 1:
            xValues.add("湿度");
            mHumidityBarEntry = new BarEntry(100.00f, 0);
            mHumidityYValues = new ArrayList<BarEntry>();
            mHumidityYValues.add(mHumidityBarEntry);

            barDataSet = new BarDataSet(mHumidityYValues, "");
            break;
        case 2:
            xValues.add("氨气浓度");
            mAmmoniaBarEntry = new BarEntry(100.00f, 0);
            mAmmoniaYValues = new ArrayList<BarEntry>();
            mAmmoniaYValues.add(mAmmoniaBarEntry);

            barDataSet = new BarDataSet(mAmmoniaYValues, "");
            break;

        default:
            break;
        }

        barDataSet.setColor(Color.rgb(114, 188, 223));
        // 不在柱状图的柱子上显示值
        //barDataSet.setDrawValues(false);
        barDataSet.setValueFormatter(new ValueFormatter() {

            @Override
            public String getFormattedValue(float value) {
                // TODO Auto-generated method stub
                if (0 == type) {
                    return value + "℃";
                }
                return value + "%";
            }
        });

        ArrayList<BarDataSet> barDataSets = new ArrayList<BarDataSet>();
        barDataSets.add(barDataSet);

        BarData barData = new BarData(xValues, barDataSets);

        return barData;
    }
2.显示环境数据的方法:
/**
     * 显示环境数据
     * @param barChart
     * @param barData
     */
    private void showBarChart(BarChart barChart, BarData barData) {
        //是否在折线图上添加边框
        barChart.setDrawBorders(false);
        // 数据描述
        barChart.setDescription("");

        // 如果没有数据的时候,会显示这个,类似ListView的EmptyView
        barChart.setNoDataTextDescription("暂无数据");
        // 是否显示表格颜色
        barChart.setDrawGridBackground(false);
        // 表格的的颜色,在这里是是给颜色设置一个透明度
        //barChart.setGridBackgroundColor(Color.WHITE & 0x70FFFFFF);

        // 设置是否可以触摸
        barChart.setTouchEnabled(false);

        // 是否可以拖拽
        barChart.setDragEnabled(false);
        // 是否可以缩放
        barChart.setScaleEnabled(false);
        barChart.setPinchZoom(false);
        // 设置背景
        //barChart.setBackgroundColor();

        //不绘制从Y轴出发的横向直线
        barChart.getAxisLeft().setDrawGridLines(false);
        barChart.getAxisRight().setDrawGridLines(false);
        // 隐藏柱状图右边的数字
        barChart.getAxisRight().setDrawLabels(false);

        barChart.setDrawValueAboveBar(false);
        barChart.setAddStatesFromChildren(false);

        barChart.setDrawBarShadow(false);
        // 设置数据
        barChart.setData(barData);

        // 设置比例图标示
        Legend mLegend = barChart.getLegend();
        mLegend.setPosition(LegendPosition.BELOW_CHART_CENTER);
        // 样式
        mLegend.setForm(LegendForm.CIRCLE);
        // 指示器的大小
        mLegend.setFormSize(0f);
        // 颜色
        mLegend.setTextColor(Color.BLACK);

        // X轴设定
        barChart.getXAxis().setPosition(XAxisPosition.BOTTOM);
        //barChart.getXAxis().setSpaceBetweenLabels(0);

        // 立即执行的动画,x轴
        barChart.animateX(0);
    }
初始化,并调用:
bc_temperature = (BarChart) findViewById(R.id.bc_temperature);
bc_humidity = (BarChart) findViewById(R.id.bc_humidity);
bc_ammonia = (BarChart) findViewById(R.id.bc_ammonia);

showBarChart(bc_temperature, getEnvironmentData(0));
showBarChart(bc_humidity, getEnvironmentData(1));
showBarChart(bc_ammonia, getEnvironmentData(2));
效果图如下:


 1203
1203

 被折叠的 条评论
为什么被折叠?
被折叠的 条评论
为什么被折叠?
 到【灌水乐园】发言


