


echarts官网
echarts官网地址:https://echarts.apache.org/zh/index.html
安装依赖
在项目中使用npm安装依赖:npm install echarts --save
main文件配置
官网中有相关的引入教程,这里使用全局引入的方式引入echarts。
在main.js文件中引入,并挂载到Vue原型下:
import * as echarts from 'echarts'
Vue.prototype.$echarts = echarts
main.js文件配置如下:
import Vue from 'vue'
import App from './App.vue'
import router from './router'
import store from './store'
// echarts
import * as echarts from 'echarts'

Vue.config.productionTip = false
Vue.prototype.$echarts = echarts

new Vue({
  router,
  store,
  render: h => h(App)
}).$mount('#app')
demo
在使用echarts图表时,需要定义一个div,并且设置该div的id以及高度,代码如下:
<template>
<div>
<div id="pie" class="chart"></div>
</div>
</template>
<script>
export default {
data () {
return {
pieChart: null
}
},
mounted () {
this.init()
},
methods: {
init () {
// 基于准备好的dom,初始化echarts实例
this.pieChart = this.$echarts.init(document.getElementById('pie'));
// 绘制图表
this.pieChart.setOption({
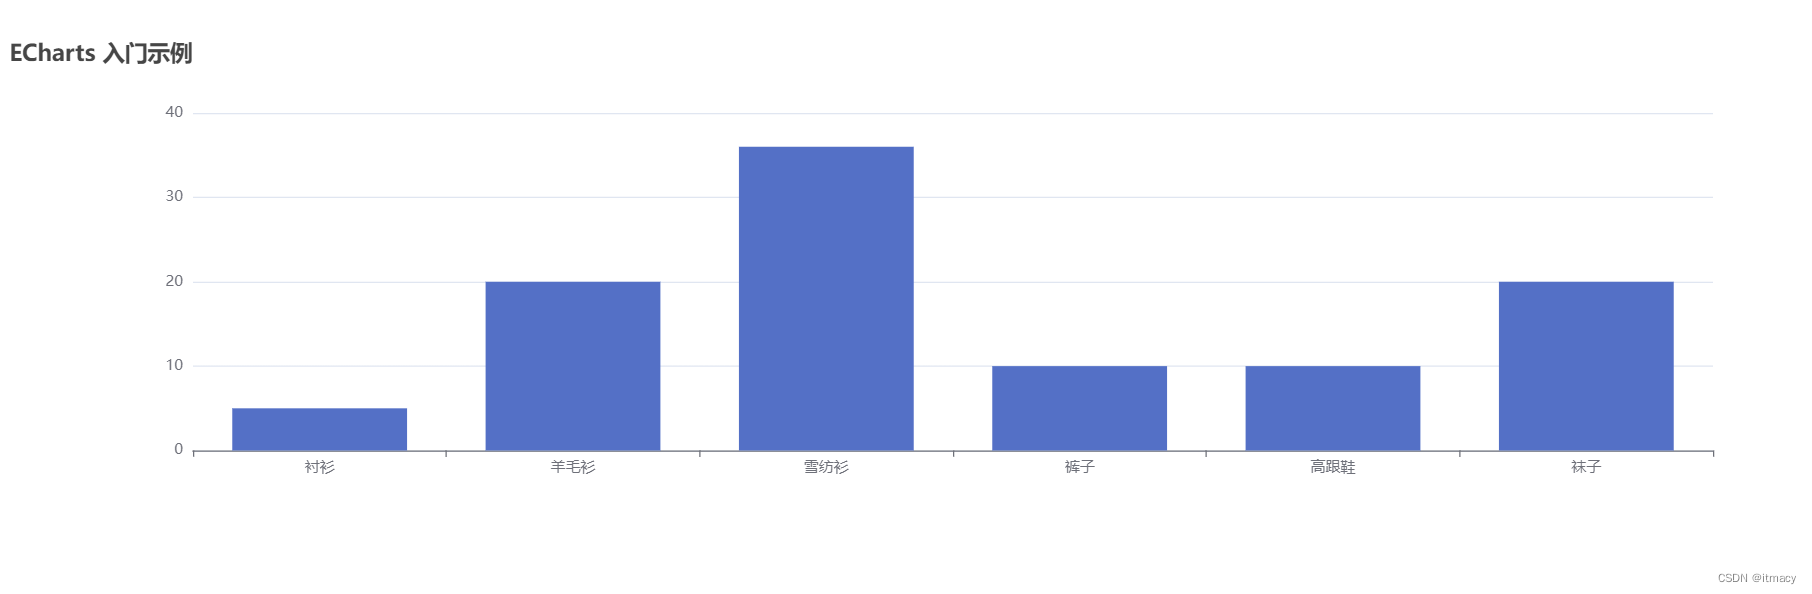
title: {
text: 'ECharts 入门示例'
},
tooltip: {},
xAxis: {
data: ['衬衫', '羊毛衫', '雪纺衫', '裤子', '高跟鞋', '袜子']
},
yAxis: {},
series: [
{
name: '销量',
type: 'bar',
data: [5, 20, 36, 10, 10, 20]
}
]
})
},
}
}
</script>
<style lang="scss" scoped>
.chart{
height: 400px;
}
</style>
效果图
效果如下:


 744
744


 被折叠的 条评论
为什么被折叠?
被折叠的 条评论
为什么被折叠?
 到【灌水乐园】发言


