


 本文详细介绍了如何使用matplotlib库在Python中绘制各种图形,包括折线图、柱状图、堆积柱状图、条形图、直方图、饼图、雷达图、散点图、棉棒图、箱线图、误差棒图、堆积折线图和间断条形图。通过实例展示了每种图形的绘制方法,是学习matplotlib的好资源。
1.使用plot()绘制折线图
示例:绘制一条正弦曲线
import matplotlib.pyplot as plt
import numpy as np
x=np.linspace(0.1,10,100)
y=np.sin(x)
plt.plot(x,y,linestyle='-',linewidth=1,label='Sin() by plot()')
plt.legend()
plt.show()
如果x和y的对应关系是列表或元祖,则图形将呈现处折线效果 示例如下:
import matplotlib.pyplot as plt
import numpy as np
a=np.random.random((9,3))*2
y1=a[0:,1]
y2=a[0:,2]
x=np.arange(1,10)
print(x)
ax=plt.subplot(111)
width=10
hight=3
ax.axes.set_xlim(-0.5,width+0.2)
ax.axes.set_ylim(-0.5,hight+0.2)
plotdict={'dx':x,'dy':y1}
ax.plot('dx','dy','bD-',data=plotdict)
ax.plot(x,y2,'r^-')
plt.show(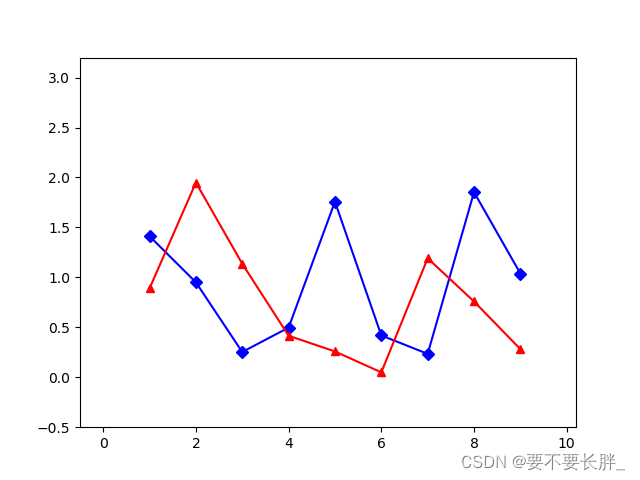
2.使用bar() 绘制柱状图
示例:某公司4个部门一季度亏损情况的柱状图
import matplotlib as mpl
import matplotlib.pyplot as plt
import numpy as np
#mpl.rcParams['font.sans-serif']=['STXINWEI.TTF']
x=['c','a','d','b']
y=[1,2,3,4]
plt.bar(x,y,alpha=0.5,width=0.3,color='yellow',edgecolor='red',
        label='The First Bar',lw=3)
plt.legend(loc='upper left')
plt.xticks(np.arange(4),('A','B','C','D'),rotation=30)
plt.yticks(np.arange(0,5,0.4))
plt.ylabel('Loss (10,000 yuan)',fontsize=10)
plt.xlabel('Department',fontsize=10)
plt.title('Losses of various departments in the first quarter',fontsize=10)
plt.tick_params(axis='both',labelsize=10)
plt.show()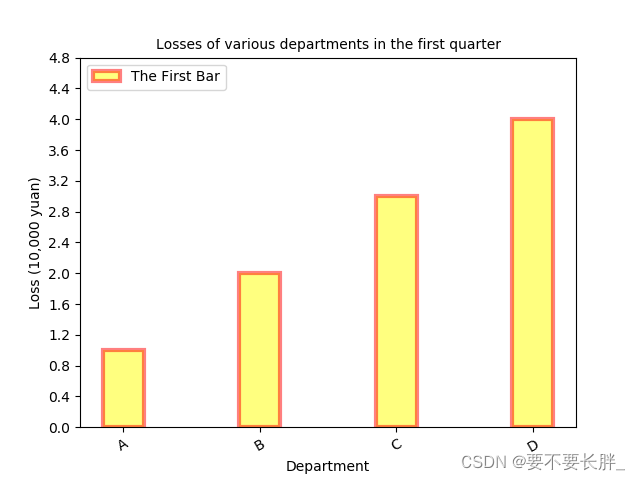
3.堆积柱状图
import matplotlib.pyplot as plt
x=[1,3,5]
y=[3,8,9]
y1=[2,6,3]
y2=[1,1,1]
plt.bar(x,y,align='center',color='#66c2a5',tick_label=['A','B','C'],label='title_A')
plt.bar(x,y1,align='center',color='#8da0cb',tick_label=['A','B','C'],label='title_B')
plt.bar(x,y2,align='center',color='#8da0ae',tick_label=['A','B','C'],label='title_C')
plt.legend()
plt.show()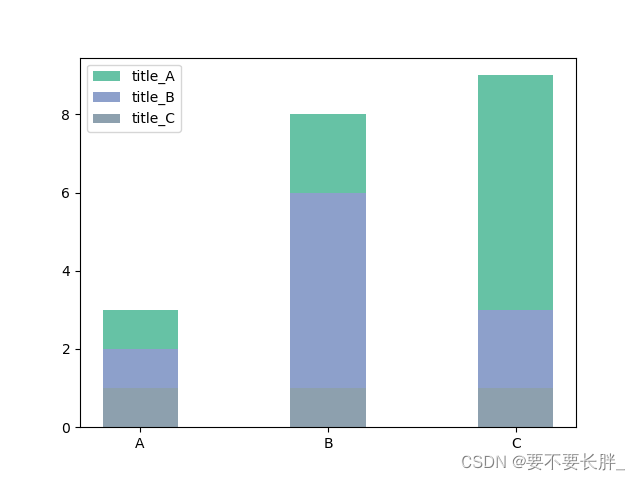
<
 最低0.47元/天 解锁文章


 被折叠的 条评论
为什么被折叠?
被折叠的 条评论
为什么被折叠?
 到【灌水乐园】发言


