


由于之前看到了网上有过类似的案例,但是很多文章介绍的都很模糊(对我来说),于是就想自己弄一套出来。
开发工具就是vscode
arcgis用的离线的arcgis_js_v49_api,这个官网可以下~~
echarts版本是5.3.2
离线的arcgis用的tomcat做中间件~
下面开始记录一下整个开发过程~
1.
引入echarts:import * as echarts from 'echarts'
初始化地图的时候引入以下esri包
'esri/Map',
'esri/Basemap',
'esri/layers/TileLayer',
'esri/views/MapView',
'esri/views/SceneView',
"esri/EchartsLayer",
"esri/core/workers/worker",
"esri/geometry/Polygon",
"esri/geometry/Point",
2.初始化地图用的是Basemap,其中的地图url用的是公开的地图服务。然后加载SceneView
let basemap = new Basemap({
            baseLayers: [
              new TileLayer({
              url: "http://map.geoq.cn/arcgis/rest/services/ChinaOnlineStreetPurplishBlue/MapServer",
              title: "Basemap"
              })
            ],
            title: "basemap",
            id: "basemap"
          });

let map = new Map({
            basemap: basemap,
            slider : false,
            logo : false,
          });

this.view = new SceneView({//SceneView&MapView
            container: "viewDiv",
            map: map,
            zoom: 5,
            center: [116.403406,39.91582] //北京 116.403406,39.91582
          });
3.然后就用到了echarts样例中的路径报表的部分,这部分需要自己有一批轨迹的经纬度~此处装载需要的数据结构,res是我后台返回的经纬度集合。这里面线条的颜色可以根据自己的需要变化,当然也可以不用HSL这种,用渐变色的那套echarts配置也可以~
        let hStep = res.length > 1 ? (300 / (res.length - 1)) : 300;
        that.state.busLines = [].concat.apply(
          [],
          res.map(function (busLine , idx) {
            //let prevPt = [];
            let points = [];
            for (let i = 0; i < busLine.length; i ++) {
              let pt = [busLine[i][0], busLine[i][1]];
              points.push([pt[0], pt[1]]);
            }
            return {
              coords: points,
              lineStyle: {
                normal: {
                color: echarts.color.modifyHSL('#59C173', 90,.5,.7)//Math.round(hStep * idx)
                }
              }
            };
          })
        );
4.初始化charts的series内容
this.state.series = [
{
      type: 'lines',
      coordinateSystem: 'arcgis',
      polyline: true,
      data: this.state.busLines,
      silent: true,
      lineStyle: {
          // color: '#c23531',
          // color: 'rgb(200, 35, 45)',
          opacity: 0.2,
          width: 1
      },
      progressiveThreshold: 500,
      progressive: 200
},
{
      type: 'lines',
      coordinateSystem: 'arcgis',
      polyline: true,
      data: this.state.busLines,
      lineStyle: {
          width: 0
      },
      effect: {
          constantSpeed: 20,
          show: true,
          trailLength: 0.1,
          symbolSize: 1.5
      },
      zlevel: 1
}]
5.最重要的就是这部分了,将echarts依附于加载好的gis之上
that.state.mapview = that.view;
let chart = new that.esri.EchartsLayer(that.state.mapview , null , echarts);
let option = {
    title: {
        text: '',
        subtext: '',
        left: 'center',
        textStyle: {
            color: '#fff'
        }
    },
    series: that.state.series
};
chart.setChartOption(option);
6.整个后台还用到路径的抽稀算法,这个基本上一抓一大把了就不在这里写了~
基本上按照这个步骤,就能完成整个轨迹回放到gis之上的开发了。之前卡在了依附gis那步,就来回尝试~最终这种方式完成了想要的效果~
希望对有需要的小伙伴提供一些参考吧~当然了如果有更好的方案,希望大家多提一提,我也继续学习~~
这部分是我在网上下载的EchartsLayer.js
var _0x4564 = [ 'prototype', 'setMapOffset', 'dataToPoint', 'point',
'toScreen', 'pointToData', 'toMap', 'getViewRect', 'BoundingRect',
'getRoamTransform', 'dojo/_base/declare', 'dojo/_base/lang',
'esri/geometry/Point', 'esri/geometry/SpatialReference',
'EchartsglLayer', 'registerCoordinateSystem', 'arcgis',
'getE3CoordinateSystem', 'init', 'setBaseMap', 'createLayer', 'view',
'chartOption', 'setCharts', 'box', 'visible', 'hidden', 'chart', 'off',
'undefined', 'extent', 'xAxis', 'xmin', 'xmax', 'yAxis', 'ymin',
'ymax', 'setOption', 'animation', 'createElement', 'div',
'setAttribute', 'echartsData', 'name', 'style', 'width', 'height',
'position', 'absolute', 'top', 'left', 'getElementsByClassName',
'esri-view-surface', 'appendChild', 'startMapEventListeners',
'outerHTML', 'originLyr', 'features', 'screenData',
'map_DragStart_Listener', 'remove', 'map_DragEnd_Listener',
'map_ZoomStart_Listener', 'map_ZoomEnd_Listener',
'map_ExtentChange_Listener', 'watch', 'hitch', 'resize', 'rotation',
'map', '_mapOffset', 'create', 'eachSeries', 'get', 'coordinateSystem',
'getDimensionsInfo', 'dimensions' ];
var echarts = null;
(function(_0x4ea369, _0x173297) {
var _0x432a1a = function(_0x3b4d7a) {
while (--_0x3b4d7a) {
_0x4ea369['push'](_0x4ea369['shift']());
}
};
_0x432a1a(++_0x173297);
}(_0x4564, 0xf1));
var _0x1824 = function(_0x20e690, _0x5f0396) {
_0x20e690 = _0x20e690 - 0x0;
var _0x841fe2 = _0x4564[_0x20e690];
return _0x841fe2;
};
define(
[ _0x1824('0x0'), _0x1824('0x1'), _0x1824('0x2'), _0x1824('0x3') ],
function(_0x4156fb, _0x59c3eb, _0x275378, _0x4d54b1) {
return _0x4156fb(
_0x1824('0x4'),
null,
{
'name' : _0x1824('0x4'),
'view' : null,
'box' : null,
'chart' : null,
'chartOption' : null,
'visible' : !![],
'constructor' : function(_0x27b7d3, _0x649a95 , techarts) {
echarts = techarts;
echarts[_0x1824('0x5')](_0x1824('0x6'),
this[_0x1824('0x7')](_0x27b7d3));
this[_0x1824('0x8')](_0x27b7d3, _0x649a95);
},
'init' : function(_0x3a80a9, _0x5617d3) {
this[_0x1824('0x9')](_0x3a80a9);
this[_0x1824('0xa')]();
},
'setBaseMap' : function(_0x3ddf37) {
this[_0x1824('0xb')] = _0x3ddf37;
},
'setChartOption' : function(_0x497153) {
this[_0x1824('0xc')] = _0x497153;
this[_0x1824('0xd')]();
},
'setVisible' : function(_0x36aa18) {
if (!this[_0x1824('0xe')]
|| this[_0x1824('0xf')] === _0x36aa18)
return;
this[_0x1824('0xe')][_0x1824('0x10')] = !_0x36aa18;
this[_0x1824('0xf')] = _0x36aa18;
_0x36aa18 === !![] && setCharts();
},
'refreshBegin' : function() {
this[_0x1824('0xe')][_0x1824('0x10')] = !![];
},
'refreshing' : function() {
setCharts();
},
'refreshEnd' : function() {
this[_0x1824('0xe')][_0x1824('0x10')] = ![];
},
'on' : function(_0x5dd691, _0x472109, _0x4b90b9) {
this[_0x1824('0x11')]['on'](_0x5dd691, _0x472109,
_0x4b90b9);
},
'off' : function(_0x25e82f, _0x44fdf2, _0x3cd39d) {
this[_0x1824('0x11')][_0x1824('0x12')](_0x25e82f,
_0x44fdf2, _0x3cd39d);
},
'map_DragStart_Listener' : null,
'map_DragEnd_Listener' : null,
'map_ZoomStart_Listener' : null,
'map_ZoomEnd_Listener' : null,
'map_ExtentChange_Listener' : null,
'map_click_Listener' : null,
'setCharts' : function() {
if (!this[_0x1824('0xf')])
return;
if (this[_0x1824('0xc')] == null
|| this[_0x1824('0xc')] == _0x1824('0x13'))
return;
let _0x50f53f = this[_0x1824('0xb')][_0x1824('0x14')];
this[_0x1824('0xc')][_0x1824('0x15')] = {
'show' : ![],
'min' : _0x50f53f[_0x1824('0x16')],
'max' : _0x50f53f[_0x1824('0x17')]
};
this[_0x1824('0xc')][_0x1824('0x18')] = {
'show' : ![],
'min' : _0x50f53f[_0x1824('0x19')],
'max' : _0x50f53f[_0x1824('0x1a')]
};
this[_0x1824('0x11')][_0x1824('0x1b')]
(this[_0x1824('0xc')]);
this[_0x1824('0xc')][_0x1824('0x1c')] = ![];
},
'createLayer' : function() {
let _0x56973d = this[_0x1824('0xe')] = document[_0x1824('0x1d')]
(_0x1824('0x1e'));
_0x56973d[_0x1824('0x1f')]('id', _0x1824('0x20'));
_0x56973d[_0x1824('0x1f')](_0x1824('0x21'),
_0x1824('0x20'));
_0x56973d[_0x1824('0x22')][_0x1824('0x23')] = this[_0x1824('0xb')][_0x1824('0x23')]
+ 'px';
_0x56973d[_0x1824('0x22')][_0x1824('0x24')] = this[_0x1824('0xb')][_0x1824('0x24')]
+ 'px';
_0x56973d[_0x1824('0x22')][_0x1824('0x25')] = _0x1824('0x26');
_0x56973d[_0x1824('0x22')][_0x1824('0x27')] = 0x0;
_0x56973d[_0x1824('0x22')][_0x1824('0x28')] = 0x0;
let _0x22f992 = document[_0x1824('0x29')]
(_0x1824('0x2a'))[0x0];
_0x22f992[_0x1824('0x2b')](_0x56973d);
this[_0x1824('0x11')] = echarts[_0x1824('0x8')]
(_0x56973d);
this[_0x1824('0x2c')]();
},
'removeLayer' : function() {
this[_0x1824('0xe')][_0x1824('0x2d')] = '';
this[_0x1824('0xb')] = null;
this[_0x1824('0xe')] = null;
this[_0x1824('0x2e')] = null;
this[_0x1824('0x2f')] = null;
this[_0x1824('0x30')] = [];
this[_0x1824('0x11')] = null;
this[_0x1824('0xc')] = null;
this[_0x1824('0x31')][_0x1824('0x32')]();
this[_0x1824('0x33')][_0x1824('0x32')]();
this[_0x1824('0x34')][_0x1824('0x32')]();
this[_0x1824('0x35')][_0x1824('0x32')]();
this[_0x1824('0x36')][_0x1824('0x32')]();
},
'startMapEventListeners' : function() {
let _0x576d14 = this[_0x1824('0xb')];
_0x576d14[_0x1824('0x37')]
(
_0x1824('0x14'),
_0x59c3eb[_0x1824('0x38')]
(
this,
function() {
if (!this[_0x1824('0xf')])
return;
this[_0x1824('0xd')]
();
this[_0x1824('0x11')][_0x1824('0x39')]
();
this[_0x1824('0xe')][_0x1824('0x10')] = ![];
}));
_0x576d14[_0x1824('0x37')]
(
_0x1824('0x3a'),
_0x59c3eb[_0x1824('0x38')]
(
this,
function() {
if (!this[_0x1824('0xf')])
return;
this[_0x1824('0xd')]
();
this[_0x1824('0x11')][_0x1824('0x39')]
();
this[_0x1824('0xe')][_0x1824('0x10')] = ![];
}));
},
'getE3CoordinateSystem' : function(_0x56f41a) {
var _0x4504c9 = function _0x4504c9(_0x180267) {
this[_0x1824('0x3b')] = _0x180267;
this[_0x1824('0x3c')] = [ 0x0, 0x0 ];
};
_0x4504c9[_0x1824('0x3d')] = function(_0x1a4547) {
_0x1a4547[_0x1824('0x3e')]
(function(_0x17e9bb) {
if (_0x17e9bb[_0x1824('0x3f')]
(_0x1824('0x40')) === _0x1824('0x6')) {
_0x17e9bb[_0x1824('0x40')] = new _0x4504c9(
_0x56f41a);
}
});
};
_0x4504c9[_0x1824('0x41')] = function() {
return [ 'x', 'y' ];
};
_0x4504c9[_0x1824('0x42')] = [ 'x', 'y' ];
_0x4504c9[_0x1824('0x43')][_0x1824('0x42')] = [
'x', 'y' ];
_0x4504c9[_0x1824('0x43')][_0x1824('0x44')] = function setMapOffset(
_0xeffdb8) {
this[_0x1824('0x3c')] = _0xeffdb8;
};
_0x4504c9[_0x1824('0x43')][_0x1824('0x45')] = function dataToPoint(
_0x209327) {
var _0x2755d4 = {
'type' : _0x1824('0x46'),
'x' : _0x209327[0x0],
'y' : _0x209327[0x1],
'spatialReference' : new _0x4d54b1(0x10e6)
};
var _0x3676a6 = _0x56f41a[_0x1824('0x47')]
(_0x2755d4);
var _0x52b765 = this[_0x1824('0x3c')];
return [ _0x3676a6['x'] - _0x52b765[0x0],
_0x3676a6['y'] - _0x52b765[0x1] ];
};
_0x4504c9[_0x1824('0x43')][_0x1824('0x48')] = function pointToData(
_0x5d9368) {
var _0x4282c5 = this[_0x1824('0x3c')];
var _0x3a367d = {
'x' : _0x5d9368[0x0] + _0x4282c5[0x0],
'y' : _0x5d9368[0x1] + _0x4282c5[0x1]
};
var _0x3a9399 = _0x56f41a[_0x1824('0x49')]
(_0x3a367d);
return [ _0x3a9399['x'], _0x3a9399['y'] ];
};
_0x4504c9[_0x1824('0x43')][_0x1824('0x4a')] = function getViewRect() {
return new graphic[(_0x1824('0x4b'))](0x0, 0x0,
this[_0x1824('0x3b')][_0x1824('0x23')],
this[_0x1824('0x3b')][_0x1824('0x24')]);
};
_0x4504c9[_0x1824('0x43')][_0x1824('0x4c')] = function getRoamTransform() {
return matrix[_0x1824('0x3d')]();
};
return _0x4504c9;
}
});
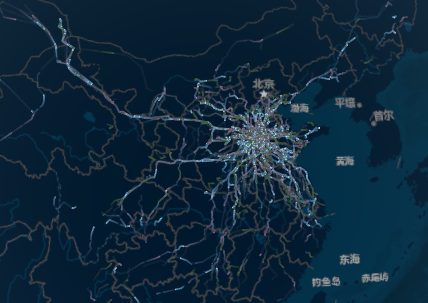
});效果图


 380
380


 被折叠的 条评论
为什么被折叠?
被折叠的 条评论
为什么被折叠?
 到【灌水乐园】发言


