


一、Prometheus 各模块儿作用
| 模块儿名 | 含义 |
|---|---|
| Prometheus Server | 监控主体 |
| Node Exporter | 采集当前主机的系统资源使用情况,如 CPU、内存和磁盘等 |
| Alertmanager | 处理告警信息,如发送邮件、短信、微信通知等 |
| Blackbox Exporter | 网络探测,如检测服务是否运行中等 |
| PrometheusAlert | 开源的运维告警中心,支持飞书、钉钉等的消息发送 |
二、安装 Prometheus Server
1、安装 Prometheus Server
https://prometheus.io/download/
选择适合自己系统的版本,这里以linux amd64 2.24.1版本为例进行演示
mkdir prometheus
cd prometheus/
wget https://github.com/prometheus/prometheus/releases/download/v2.24.1/prometheus-2.24.1.linux-amd64.tar.gz
tar -zxvf prometheus-2.24.1.linux-amd64.tar.gz
cd prometheus-2.24.1.linux-amd64
vim prometheus.yml
会看到默认的 Prometheus 配置文件 promethes.yml:
# my global config
global:
  scrape_interval:     15s # Set the scrape interval to every 15 seconds. Default is every 1 minute.
  evaluation_interval: 15s # Evaluate rules every 15 seconds. The default is every 1 minute.
  # scrape_timeout is set to the global default (10s).

# Alertmanager configuration
alerting:
  alertmanagers:
  - static_configs:
    - targets:
      # - alertmanager:9093

# Load rules once and periodically evaluate them according to the global 'evaluation_interval'.
rule_files:
  # - "first_rules.yml"
  # - "second_rules.yml"

# A scrape configuration containing exactly one endpoint to scrape:
# Here it's Prometheus itself.
scrape_configs:
  # The job name is added as a label `job=<job_name>` to any timeseries scraped from this config.
  - job_name: 'prometheus'

    # metrics_path defaults to '/metrics'
    # scheme defaults to 'http'.

    static_configs:
    - targets: ['localhost:9090']
Promtheus 作为一个时间序列数据库,其采集的数据会以文件的形似存储在本地中,默认的存储路径为 data/,在运行服务的时候会自行创建
$ ./prometheus
level=info ts=2020-06-22T07:28:06.466Z caller=main.go:302 msg="No time or size retention was set so using the default time retention" duration=15d
level=info ts=2020-06-22T07:28:06.466Z caller=main.go:337 msg="Starting Prometheus" version="(version=2.19.1, branch=HEAD, revision=eba3fdcbf0d378b66600281903e3aab515732b39)"
level=info ts=2020-06-22T07:28:06.466Z caller=main.go:338 build_context="(go=go1.14.4, user=root@62700b3d0ef9, date=20200618-16:35:26)"
level=info ts=2020-06-22T07:28:06.466Z caller=main.go:339 host_details="(Linux 5.4.44-1-MANJARO #1 SMP PREEMPT Wed Jun 3 14:48:07 UTC 2020 x86_64 jl-qtk5 (none))"
level=info ts=2020-06-22T07:28:06.466Z caller=main.go:340 fd_limits="(soft=1024, hard=524288)"
level=info ts=2020-06-22T07:28:06.466Z caller=main.go:341 vm_limits="(soft=unlimited, hard=unlimited)"
level=info ts=2020-06-22T07:28:06.468Z caller=web.go:524 component=web msg="Start listening for connections" address=0.0.0.0:9090
level=info ts=2020-06-22T07:28:06.468Z caller=main.go:678 msg="Starting TSDB ..."
level=info ts=2020-06-22T07:28:06.471Z caller=head.go:645 component=tsdb msg="Replaying WAL and on-disk memory mappable chunks if any, this may take a while"
level=info ts=2020-06-22T07:28:06.472Z caller=head.go:706 component=tsdb msg="WAL segment loaded" segment=0 maxSegment=1
level=info ts=2020-06-22T07:28:06.472Z caller=head.go:706 component=tsdb msg="WAL segment loaded" segment=1 maxSegment=1
level=info ts=2020-06-22T07:28:06.472Z caller=head.go:709 component=tsdb msg="WAL replay completed" duration=947.648µs
level=info ts=2020-06-22T07:28:06.473Z caller=main.go:694 fs_type=EXT4_SUPER_MAGIC
level=info ts=2020-06-22T07:28:06.473Z caller=main.go:695 msg="TSDB started"
level=info ts=2020-06-22T07:28:06.473Z caller=main.go:799 msg="Loading configuration file" filename=prometheus.yml
level=info ts=2020-06-22T07:28:06.474Z caller=main.go:827 msg="Completed loading of configuration file" filename=prometheus.yml
level=info ts=2020-06-22T07:28:06.474Z caller=main.go:646 msg="Server is ready to receive web requests."
启动成功,默认端口号为 9090,可以通过 http://localhost:9090 访问 Prometheus 的 UI 界面:

2、开机自启
$ sudo vim /etc/systemd/system/prometheus.service
[Unit]
Description=Prometheus Monitoring System
Wants=network-online.target
After=network-online.target

[Service]
User=root
Group=root
Type=simple
ExecStart=/home/jl/prometheus/prometheus-2.24.1.linux-amd64/prometheus \
        --config.file=/home/jl/prometheus/prometheus-2.24.1.linux-amd64/prometheus.yml
Restart=on-failure

[Install]
WantedBy=multi-user.target
$ systemctl enable /etc/systemd/system/prometheus.service
$ systemctl start prometheus
$ systemctl status prometheus
三、使用 Node Exporter 采集主机数据
1、安装 Node Exporter
在 Prometheus 的架构设计中,Prometheus Server 并不直接监控特定的目标,其主要任务是负责数据的收集,存储并且对外提供数据查询支持。因此为了能够监控到某些东西,如主机的 CPU 使用率、内存和硬盘等,我们需要使用到 Exporter。Prometheus 周期性的从 Exporter 暴露的 HTTP 服务地址拉取监控样本数据。这里我们采用 Node Exporter 采集主机信息。
https://prometheus.io/download/#node_exporter
$ cd ~/prometheus/
$ wget https://github.com/prometheus/node_exporter/releases/download/v1.0.1/node_exporter-1.0.1.linux-amd64.tar.gz
$ tar -zxvf node_exporter-1.0.1.linux-amd64.tar.gz
$ cd node_exporter-1.0.1.linux-amd64/
$ ./node_exporter
level=info ts=2020-06-22T08:21:09.796Z caller=node_exporter.go:177 msg="Starting node_exporter" version="(version=1.0.1, branch=HEAD, revision=3715be6ae899f2a9b9dbfd9c39f3e09a7bd4559f)"
level=info ts=2020-06-22T08:21:09.796Z caller=node_exporter.go:178 msg="Build context" build_context="(go=go1.14.4, user=root@1f76dbbcfa55, date=20200616-12:44:12)"
level=info ts=2020-06-22T08:21:09.797Z caller=node_exporter.go:105 msg="Enabled collectors"
level=info ts=2020-06-22T08:21:09.797Z caller=node_exporter.go:112 collector=arp
level=info ts=2020-06-22T08:21:09.797Z caller=node_exporter.go:112 collector=bcache
level=info ts=2020-06-22T08:21:09.797Z caller=node_exporter.go:112 collector=bonding
level=info ts=2020-06-22T08:21:09.797Z caller=node_exporter.go:112 collector=btrfs
level=info ts=2020-06-22T08:21:09.797Z caller=node_exporter.go:112 collector=conntrack
level=info ts=2020-06-22T08:21:09.797Z caller=node_exporter.go:112 collector=cpu
level=info ts=2020-06-22T08:21:09.797Z caller=node_exporter.go:112 collector=cpufreq
level=info ts=2020-06-22T08:21:09.797Z caller=node_exporter.go:112 collector=diskstats
level=info ts=2020-06-22T08:21:09.797Z caller=node_exporter.go:112 collector=edac
level=info ts=2020-06-22T08:21:09.797Z caller=node_exporter.go:112 collector=entropy
level=info ts=2020-06-22T08:21:09.797Z caller=node_exporter.go:112 collector=filefd
level=info ts=2020-06-22T08:21:09.797Z caller=node_exporter.go:112 collector=filesystem
level=info ts=2020-06-22T08:21:09.797Z caller=node_exporter.go:112 collector=hwmon
level=info ts=2020-06-22T08:21:09.797Z caller=node_exporter.go:112 collector=infiniband
level=info ts=2020-06-22T08:21:09.797Z caller=node_exporter.go:112 collector=ipvs
level=info ts=2020-06-22T08:21:09.797Z caller=node_exporter.go:112 collector=loadavg
level=info ts=2020-06-22T08:21:09.797Z caller=node_exporter.go:112 collector=mdadm
level=info ts=2020-06-22T08:21:09.797Z caller=node_exporter.go:112 collector=meminfo
level=info ts=2020-06-22T08:21:09.797Z caller=node_exporter.go:112 collector=netclass
level=info ts=2020-06-22T08:21:09.797Z caller=node_exporter.go:112 collector=netdev
level=info ts=2020-06-22T08:21:09.797Z caller=node_exporter.go:112 collector=netstat
level=info ts=2020-06-22T08:21:09.797Z caller=node_exporter.go:112 collector=nfs
level=info ts=2020-06-22T08:21:09.797Z caller=node_exporter.go:112 collector=nfsd
level=info ts=2020-06-22T08:21:09.797Z caller=node_exporter.go:112 collector=powersupplyclass
level=info ts=2020-06-22T08:21:09.797Z caller=node_exporter.go:112 collector=pressure
level=info ts=2020-06-22T08:21:09.797Z caller=node_exporter.go:112 collector=rapl
level=info ts=2020-06-22T08:21:09.797Z caller=node_exporter.go:112 collector=schedstat
level=info ts=2020-06-22T08:21:09.797Z caller=node_exporter.go:112 collector=sockstat
level=info ts=2020-06-22T08:21:09.797Z caller=node_exporter.go:112 collector=softnet
level=info ts=2020-06-22T08:21:09.797Z caller=node_exporter.go:112 collector=stat
level=info ts=2020-06-22T08:21:09.797Z caller=node_exporter.go:112 collector=textfile
level=info ts=2020-06-22T08:21:09.797Z caller=node_exporter.go:112 collector=thermal_zone
level=info ts=2020-06-22T08:21:09.797Z caller=node_exporter.go:112 collector=time
level=info ts=2020-06-22T08:21:09.797Z caller=node_exporter.go:112 collector=timex
level=info ts=2020-06-22T08:21:09.797Z caller=node_exporter.go:112 collector=udp_queues
level=info ts=2020-06-22T08:21:09.797Z caller=node_exporter.go:112 collector=uname
level=info ts=2020-06-22T08:21:09.797Z caller=node_exporter.go:112 collector=vmstat
level=info ts=2020-06-22T08:21:09.797Z caller=node_exporter.go:112 collector=xfs
level=info ts=2020-06-22T08:21:09.797Z caller=node_exporter.go:112 collector=zfs
level=info ts=2020-06-22T08:21:09.797Z caller=node_exporter.go:191 msg="Listening on" address=:9100
level=info ts=2020-06-22T08:21:09.797Z caller=tls_config.go:170 msg="TLS is disabled and it cannot be enabled on the fly." http2=false
2、从 Node Exporter 收集监控数据
为了能够让 Prometheus Server 能够从当前 Node Exporter 获取到监控数据,这里需要修改 Prometheus 的配置文件。编辑 prometheus.yml 并在 scrape_configs 节点下添加以下内容:
2.1 默认方法添加配置
scrape_configs:
  # The job name is added as a label `job=<job_name>` to any timeseries scraped from this config.
  - job_name: 'prometheus'

    # metrics_path defaults to '/metrics'
    # scheme defaults to 'http'.

    static_configs:
    - targets: ['localhost:9090']
  - job_name: 'node'
    static_configs:
    - targets: ['localhost:9100']
      labels:
        namespace: 'server1'  # 实例名
参数:
- job_name:指定服务名
- targets:指定服务地址和端口
- labels:自定义标签,如指定服务器名为 server1,方便后面发送告警信息时标记服务器。
2.2 json 文件添加配置(推荐)
$ mkdir json_config
$ cd json_config/
$ vim node.json
[
    {
        "targets": [
            "10.0.5.73:9100"
        ],
        "labels": {
            "namespace": "测试服务器"
        }
    }
]
$ cd ..
$ vim prometheus.yml
# my global config
global:
  scrape_interval:     15s # Set the scrape interval to every 15 seconds. Default is every 1 minute.
  evaluation_interval: 15s # Evaluate rules every 15 seconds. The default is every 1 minute.
  # scrape_timeout is set to the global default (10s).

# Alertmanager configuration
alerting:
  alertmanagers:
  - static_configs:
    - targets:
      # - alertmanager:9093

# Load rules once and periodically evaluate them according to the global 'evaluation_interval'.
rule_files:
  # - "first_rules.yml"
  # - "second_rules.yml"

# A scrape configuration containing exactly one endpoint to scrape:
# Here it's Prometheus itself.
scrape_configs:
  # The job name is added as a label `job=<job_name>` to any timeseries scraped from this config.
  - job_name: 'prometheus'

    # metrics_path defaults to '/metrics'
    # scheme defaults to 'http'.

    static_configs:
    - targets: ['localhost:9090']
  - job_name: 'node'
    file_sd_configs:
    # 刷新配置文件时间,默认5分钟
    - refresh_interval: 5m
      files:
      - json_config/node.json
用 prometheus 自带的 promtool 工具检查配置文件的有效性:
$ cd ~/prometheus/prometheus-2.24.1.linux-amd64/
$ ./promtool check config prometheus.yml
Checking prometheus.yml
  SUCCESS: 0 rule files found
正确显示如上,如果提示有错,请根据错误提示修改配置文件。
后台启动 Node Exporter 和 Prometheus Server
nohup ~/prometheus/node_exporter-1.0.1.linux-amd64/node_exporter &
nohup ~/prometheus/prometheus-2.24.1.linux-amd64/prometheus &
启动 http://localhost:9090 访问 Prometheus 的 UI 界面,输入 up 执行:

可以看到服务 prometheus 和 node 均已启动,1 表示正常,0 为异常。
3、使用 PromQL 查询监控数据
关于 PromQL 详细用法请参考:
https://yunlzheng.gitbook.io/prometheus-book/parti-prometheus-ji-chu/quickstart/prometheus-quick-start/promql_quickstart
https://prometheus.io/docs/prometheus/latest/querying/basics/
这里我们演示 CPU、内存和磁盘的查询,结果四舍五入:
(1)CPU 5分钟的平均使用率(有误,待修改)
ceil((1-((sum(increase(node_cpu_seconds_total{mode="idle"}[5m])) by(instance,namespace)) / (sum(increase(node_cpu_seconds_total[5m])) by(instance,namespace))))*100)

(2)内存使用率
ceil(100 - ((node_memory_MemFree_bytes + node_memory_Cached_bytes + node_memory_Buffers_bytes) / node_memory_MemTotal_bytes) * 100)

(3)磁盘使用率
ceil((node_filesystem_size_bytes {mountpoint = "/"} - node_filesystem_free_bytes {mountpoint = "/"}) / node_filesystem_size_bytes {mountpoint = "/"} * 100)

4、开机自启
$ sudo vim /etc/systemd/system/node-exporter.service
[Unit]
Description=Node Exporter System
Wants=network-online.target
After=network-online.target

[Service]
User=root
Group=root
Type=simple
ExecStart=/home/jl/prometheus/node_exporter-1.0.1.linux-amd64/node_exporter
Restart=on-failure

[Install]
WantedBy=multi-user.target
$ systemctl enable /etc/systemd/system/node-exporter.service
$ systemctl start node-exporter
$ systemctl status node-exporter
四、使用 Alertmanager 发送警报
1、安装 Alertmanager
Prometheus Server 通过 Node Exporter 采集主机数据,当使用率超过阈值后,Prometheus Server 发送警告信息给 Alertmanager,Alertmanager 通过邮件、微信、钉钉、企业微信等通知管理员处理警报。
https://prometheus.io/download/#alertmanager
$ cd ~/prometheus/
$ wget https://github.com/prometheus/alertmanager/releases/download/v0.21.0/alertmanager-0.21.0.linux-amd64.tar.gz
$ tar -zxvf alertmanager-0.21.0.linux-amd64.tar.gz
$ cd alertmanager-0.21.0.linux-amd64/
$ ./alertmanager
level=info ts=2020-09-15T02:50:19.842Z caller=main.go:216 msg="Starting Alertmanager" version="(version=0.21.0, branch=HEAD, revision=4c6c03ebfe21009c546e4d1e9b92c371d67c021d)"
level=info ts=2020-09-15T02:50:19.842Z caller=main.go:217 build_context="(go=go1.14.4, user=root@dee35927357f, date=20200617-08:54:02)"
level=info ts=2020-09-15T02:50:19.843Z caller=cluster.go:161 component=cluster msg="setting advertise address explicitly" addr=10.15.3.205 port=9094
level=info ts=2020-09-15T02:50:19.843Z caller=cluster.go:623 component=cluster msg="Waiting for gossip to settle..." interval=2s
level=info ts=2020-09-15T02:50:19.866Z caller=coordinator.go:119 component=configuration msg="Loading configuration file" file=alertmanager.yml
level=info ts=2020-09-15T02:50:19.867Z caller=coordinator.go:131 component=configuration msg="Completed loading of configuration file" file=alertmanager.yml
level=info ts=2020-09-15T02:50:19.870Z caller=main.go:485 msg=Listening address=:9093
level=info ts=2020-09-15T02:50:21.844Z caller=cluster.go:648 component=cluster msg="gossip not settled" polls=0 before=0 now=1 elapsed=2.000118506s
2、自定义 Prometheus 告警规则
cd ~/prometheus/prometheus-2.24.1.linux-amd64/
mkdir rules
cd rules/
vim hoststats-alert.rules
创建主机 CPU、内存和硬盘使用率报警
groups:
- name: hostStatsAlert
  rules:
  - alert: CPU 使用率
    expr: ceil((1-((sum(increase(node_cpu_seconds_total{mode="idle"}[5m])) by(instance,namespace)) / (sum(increase(node_cpu_seconds_total[5m])) by(instance,namespace))))*100) > 90
    for: 5m
    labels:
      severity: 严重警告
    annotations:
      summary: "{{ $labels.instance }} CPU 使用率过高!"
      description: "{{ $labels.namespace }} CPU 使用率大于 80% (目前使用: {{ $value }}%)"
  - alert: 内存使用率
    expr: ceil(100 - ((node_memory_MemFree_bytes + node_memory_Cached_bytes + node_memory_Buffers_bytes) / node_memory_MemTotal_bytes) * 100) > 80
    for: 5m
    labels:
      severity: 严重警告
    annotations:
      summary: "{{ $labels.instance }} 内存使用率过高!"
      description: "{{ $labels.namespace }} 内存使用率大于 80% (目前使用: {{ $value }}%)"
  - alert: 磁盘使用率
    expr: ceil((node_filesystem_size_bytes {mountpoint = "/"} - node_filesystem_free_bytes {mountpoint = "/"}) / node_filesystem_size_bytes {mountpoint = "/"} * 100) > 80
    for: 5m
    labels:
      severity: 严重警告
    annotations:
      summary: "{{ $labels.instance }} 磁盘使用率过高!"
      description: "{{ $labels.namespace }} 磁盘使用率大于 80% (目前使用: {{ $value }}%)"
- alert:告警规则的名称。
- expr:基于 PromQL 表达式告警触发条件,用于计算是否有时间序列满足该条件。
- for:评估等待时间,可选参数。用于表示只有当触发条件持续一段时间后才发送告警。在等待期间新产生告警的状态为 pending。
- labels:自定义标签,允许用户指定要附加到告警上的一组附加标签。
- annotations:用于指定一组附加信息,比如用于描述告警详细信息的文字等,annotations 的内容在告警产生时会一同作为参数发送到 Alertmanager。
- $labels:变量保存警报实例的标签键/值对
- $value:变量保存警报实例的评估值
3、配置 prometheus 启用 alertmanager 报警
$ cd ..
$ vim prometheus.yml
# my global config
global:
  scrape_interval:     15s # Set the scrape interval to every 15 seconds. Default is every 1 minute.
  evaluation_interval: 15s # Evaluate rules every 15 seconds. The default is every 1 minute.
  # scrape_timeout is set to the global default (10s).

# Alertmanager configuration
alerting:
  alertmanagers:
  - static_configs:
    - targets:
      - localhost:9093

# Load rules once and periodically evaluate them according to the global 'evaluation_interval'.
rule_files:
  - "rules/*.rules"
  # - "second_rules.yml"

# A scrape configuration containing exactly one endpoint to scrape:
# Here it's Prometheus itself.
scrape_configs:
  # The job name is added as a label `job=<job_name>` to any timeseries scraped from this config.
  - job_name: 'prometheus'

    # metrics_path defaults to '/metrics'
    # scheme defaults to 'http'.

    static_configs:
    - targets: ['localhost:9090']
  - job_name: 'node'
    file_sd_configs:
    # 刷新配置文件时间,默认5分钟
    - refresh_interval: 5m
      files:
      - json_config/node.json
4、发送警报
4.1 定义发送警报模板到企业微信
定义警报模板
$ mkdir tmpls
$ cd tmpls/
$ vim wechat_alert.tmpl
{{ define "wechat.default.message" }}
{{- if gt (len .Alerts.Firing) 0 -}}
{{- range $index, $alert := .Alerts -}}
{{- if eq $index 0 -}}
告警类型: {{ $alert.Labels.alertname }}
告警级别: {{ $alert.Labels.severity }}

{{- end }}

========告警详情========
告警详情: {{ $alert.Annotations.description }}
故障时间: {{ $alert.StartsAt.Local.Format "2006-01-02 15:04:05" }}
========参考信息========
{{ if gt (len $alert.Labels.instance) 0 -}}故障实例 ip: {{ $alert.Labels.instance }};{{- end -}}
{{- if gt (len $alert.Labels.namespace) 0 -}}<br>故障实例所在 namespace: {{ $alert.Labels.namespace }};{{- end -}}
{{- if gt (len $alert.Labels.node) 0 -}}故障物理机 ip: {{ $alert.Labels.node }};{{- end -}}
{{- if gt (len $alert.Labels.pod_name) 0 -}}故障 pod 名称: {{ $alert.Labels.pod_name }}{{- end }}
{{- end }}
{{- end }}

{{- if gt (len .Alerts.Resolved) 0 -}}
{{- range $index, $alert := .Alerts -}}
{{- if eq $index 0 -}}
告警解除: {{ $alert.Labels.alertname }}

{{- end }}

========告警详情========
告警详情: {{ $alert.Annotations.description }}
故障时间: {{ $alert.StartsAt.Local.Format "2006-01-02 15:04:05" }}
恢复时间: {{ $alert.EndsAt.Local.Format "2006-01-02 15:04:05" }}
========参考信息========
{{ if gt (len $alert.Labels.instance) 0 -}}故障实例 ip: {{ $alert.Labels.instance }};{{- end -}}
{{- if gt (len $alert.Labels.namespace) 0 -}}<br>故障实例所在 namespace: {{ $alert.Labels.namespace }};{{- end -}}
{{- if gt (len $alert.Labels.node) 0 -}}故障物理机 ip: {{ $alert.Labels.node }};{{- end -}}
{{- if gt (len $alert.Labels.pod_name) 0 -}}故障 pod 名称: {{ $alert.Labels.pod_name }};{{- end }}
{{- end }}
{{- end }}
{{- end }}
注意:
报警采用的国际时间会相差8个小时,有两种思路解决:
- 采用本地时间
$alert.StartsAt.Local.Format - 时间 +8 小时
($alert.StartsAt.Add 28800e9).Format
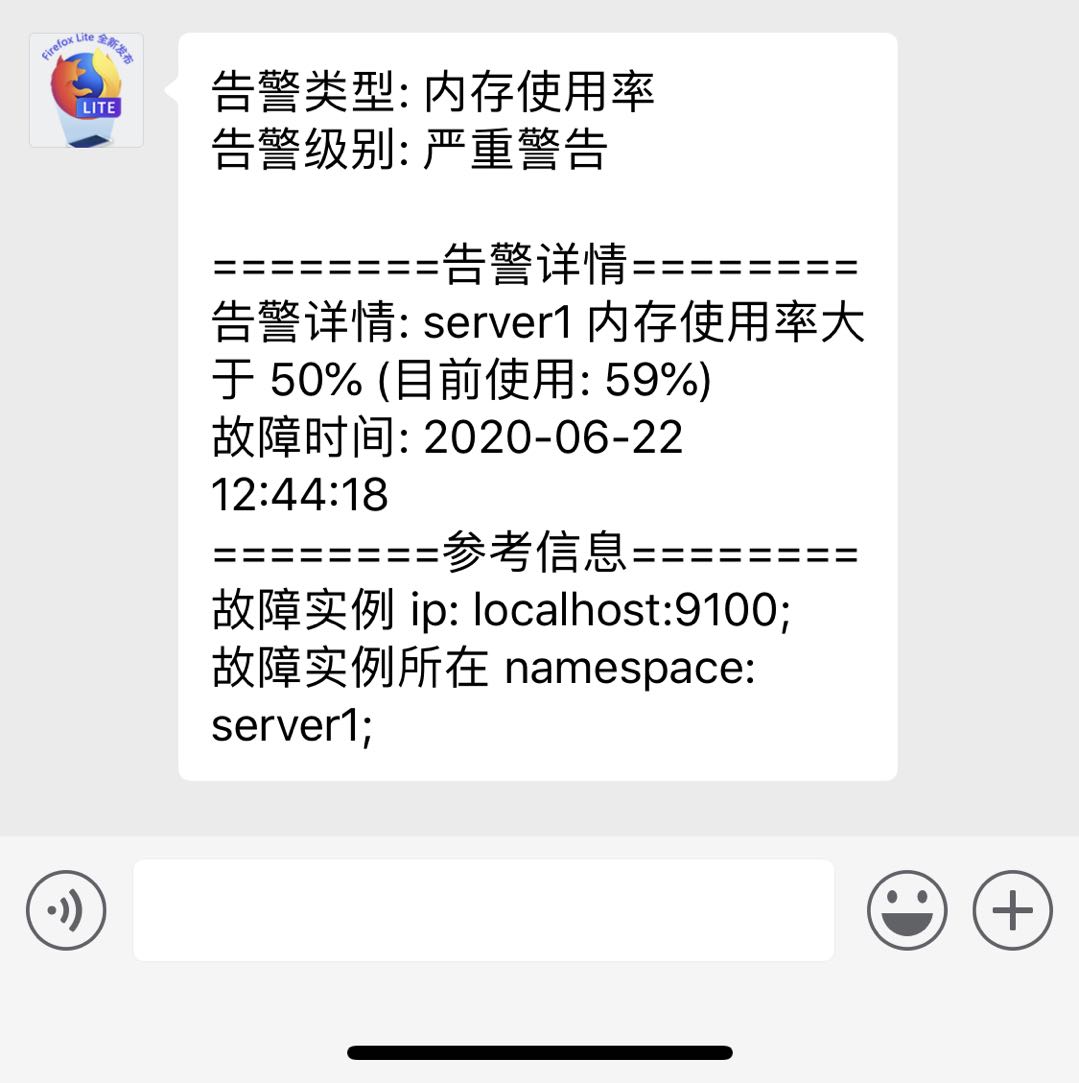
消息提示如下:
修改配置文件
参考 企业微信API说明
$ vim ~/prometheus/alertmanager-0.21.0.linux-amd64/alertmanager.yml
global:
  resolve_timeout: 10m
  wechat_api_url: 'https://qyapi.weixin.qq.com/cgi-bin/'
templates:
# 报警模版
- 'tmpls/*.tmpl'
route:
  group_by: ['alertname']
  group_wait: 30s
  group_interval: 5m
  # 重复报警间隔
  repeat_interval: 10m
  receiver: 'wechat'
inhibit_rules:
- source_match:
receivers:
- name: 'wechat'
  wechat_configs:
  - send_resolved: false
    corp_id: '企业id,在企业的配置页面可以看到'
    to_user: '@all'
    to_party: ' PartyID1 | PartyID2 '
    message: '{{ template "wechat.default.message" . }}'
    agent_id: '应用的AgentId,在应用的配置页面可以看到'
    api_secret: '应用的secret,在应用的配置页面可以看到'
首先登录企业微信并创建应用:

其余对应信息如下所示:


4.2 定义发送警报模板到飞书
使用开源的警告中心 https://github.com/feiyu563/PrometheusAlert.git
考虑到 github 速度问题,我们用码云的 https://gitee.com/feiyu563/PrometheusAlert.git
cd ~/prometheus/
git clone https://gitee.com/feiyu563/PrometheusAlert.git
# 只使用到 PrometheusAlert/example/linux 代码,剩余代码删除
mv PrometheusAlert/example/linux/ .
rm -rf PrometheusAlert/
mv linux/ prometheus_alert
cd prometheus_alert/
# 移除 zabbix
rm zabbix
# 查看 文件中出现作者邮箱的文件
grep -l -r '244217140@qq.com' .
# 替换文件中出现的作者邮箱为 xxx,xxx 的长度要跟邮箱的长度一样,否则启动报错
grep -l -r '244217140@qq.com' | xargs sed -i 's/244217140@qq.com/xxxxxxxxxxxxxxxx/g'
chmod +x PrometheusAlert
vim conf/app.conf
修改端口号,开启飞书 webhook,关闭其他不需要的告警通道
#监听端口
httpport = 9080
#是否开启飞书告警通道,可同时开始多个通道0为关闭,1为开启
open-feishu=1
#默认飞书机器人地址
fsurl=https://open.feishu.cn/open-apis/bot/hook/xxxxxxxxx
fsurl 路径可以通过以下步骤获取:


配置告警模板,alertmanager 使用该告警模板
$ cd ../alertmanager-0.21.0.linux-amd64/tmpls/
$ vim feishu_alert.tmpl
{{- range $index, $alert := .alerts -}}
{{- if eq $alert.status "firing" -}}

{{- if eq $index 0 -}}
告警类型: {{ $alert.labels.alertname }}
告警级别: {{ $alert.labels.severity }}
{{- end }}

========告警详情========
告警详情: {{ $alert.annotations.description }}
故障时间: {{ GetCSTtime $alert.startsAt }}
========参考信息========
故障实例 ip: {{ $alert.labels.instance }}
故障实例所在 namespace: {{ $alert.labels.namespace }}
{{- end }}
{{- end }}


{{- range $index, $alert := .alerts -}}
{{- if eq $alert.status "resolved" -}}
{{- if eq $index 0 -}}
告警解除: {{ $alert.labels.alertname }}
{{- end }}

========告警详情========
告警详情: {{ $alert.annotations.description }}
故障时间: {{ GetCSTtime $alert.startsAt }}
恢复时间: {{ GetCSTtime $alert.endsAt }}
========参考信息========
故障实例 ip: {{ $alert.labels.instance }}
故障实例所在 namespace: {{ $alert.labels.namespace }}
{{- end }}
{{- end }}
模版效果如下:

启动 PrometheusAlert,获取 webhook url 地址
./PrometheusAlert
访问 http://localhost:9080


将飞书机器人地址替换为飞书获取的 fsurl 地址,编辑 alertmanager 配置文件
$ cd ../alertmanager-0.21.0.linux-amd64/
$ vim alertmanager.yml
global:
  resolve_timeout: 5m

route:
  group_by: ['alertname']
  group_wait: 10s
  group_interval: 10s
  repeat_interval: 1h
  receiver: 'feishu'
receivers:
- name: 'feishu'
  webhook_configs:
  - url: 'http://127.0.0.1:9080/prometheusalert?type=fs&tpl=prometheus-fsv2&fsurl=飞书机器人地址'
inhibit_rules:
  - source_match:
      severity: 'critical'
    target_match:
      severity: 'warning'
    equal: ['alertname', 'dev', 'instance']
测试报警,访问http://localhost:9080,报警信息
{
    "receiver": "prometheusalert",
    "status": "resolved",
    "alerts": [
        {
            "status": "resolved",
            "labels": {
                "alertname": "内存使用率",
                "instance": "localhost:9100",
                "job": "node",
                "namespace": "server1",
                "severity": "严重警告"
            },
            "annotations": {
                "description": "server1 内存使用率大于 10% (目前使用: 53%)",
                "summary": "localhost:9100 内存使用率过高!"
            },
            "startsAt": "2021-01-20T06:35:03.961281682Z",
            "endsAt": "2021-01-20T07:26:33.961281682Z",
            "generatorURL": "http://localhost.localdomain:9090/graph?g0.expr=ceil%28100+-+%28%28node_memory_MemFree_bytes+%2B+node_memory_Cached_bytes+%2B+node_memory_Buffers_bytes%29+%2F+node_memory_MemTotal_bytes%29+%2A+100%29+%3E+10&g0.tab=1",
            "fingerprint": "58b70b7974888e39"
        }
    ],
    "groupLabels": {
        "alertname": "内存使用率"
    },
    "commonLabels": {
        "alertname": "内存使用率",
        "instance": "localhost:9100",
        "job": "node",
        "namespace": "server1",
        "severity": "严重警告"
    },
    "commonAnnotations": {
        "description": "server1 内存使用率大于 10% (目前使用: 53%)",
        "summary": "localhost:9100 内存使用率过高!"
    },
    "externalURL": "http://localhost.localdomain:9093",
    "version": "4",
    "groupKey": "{}:{alertname=\"内存使用率\"}",
    "truncatedAlerts": 0
}
编辑飞书告警模板,将模板、告警 json 和机器人地址贴入,保存模板,然后模板测试,能正常收到消息即表示成功。


设置开机启动
$ sudo vim /etc/systemd/system/prometheus-alert.service
[Unit]
Description=PrometheusAlert
Wants=network-online.target
After=network-online.target

[Service]
User=root
Group=root
Type=simple
WorkingDirectory=/home/jl/prometheus/prometheus_alert/
ExecStart=/home/jl/prometheus/prometheus_alert/PrometheusAlert
Restart=on-failure

[Install]
WantedBy=multi-user.target
$ systemctl enable /etc/systemd/system/prometheus-alert.service
$ systemctl start prometheus-alert
$ systemctl status prometheus-alert
5、开机自启加互备
为了增加容灾性,可以在另外一台机器上做相同的配置,形成互备机制。
$ cd ~/prometheus/alertmanager-0.21.0.linux-amd64
$ vim alertmanager.sh
#!/bin/bash
/home/jl/prometheus/alertmanager-0.21.0.linux-amd64/alertmanager \
        --web.listen-address=:9093 \
        --cluster.listen-address=:9094 \
        --cluster.peer=127.0.0.1:9094 \
        --cluster.peer=从地址:9094 \
        --config.file=/home/jl/prometheus/alertmanager-0.21.0.linux-amd64/alertmanager.yml
$ chmod +x alertmanager.sh
$ sudo vim /etc/systemd/system/alertmanager.service
[Unit]
Description=Alertmanager System
Wants=network-online.target
After=network-online.target

[Service]
User=root
Group=root
Type=simple
ExecStart=/home/jl/prometheus/alertmanager-0.21.0.linux-amd64/alertmanager.sh
Restart=on-failure

[Install]
WantedBy=multi-user.target
$ systemctl enable /etc/systemd/system/alertmanager.service
$ systemctl start alertmanager
$ systemctl status alertmanager
五、使用网络探测监控服务状况
1、安装 blackbox_exporter
Blackbox Exporter是Prometheus社区提供的官方黑盒监控解决方案,其允许用户通过:HTTP、HTTPS、DNS、TCP以及ICMP的方式对网络进行探测。黑盒监控即以用户的身份测试服务的外部可见性,常见的黑盒监控包括HTTP探针、TCP探针等用于检测站点或者服务的可访问性,以及访问效率等。黑盒监控相较于白盒监控最大的不同在于黑盒监控是以故障为导向当故障发生时,黑盒监控能快速发现故障,而白盒监控则侧重于主动发现或者预测潜在的问题。一个完善的监控目标是要能够从白盒的角度发现潜在问题,能够在黑盒的角度快速发现已经发生的问题。
https://prometheus.io/download/#blackbox_exporter
$ cd ~/prometheus/
$ wget https://github.com/prometheus/blackbox_exporter/releases/download/v0.18.0/blackbox_exporter-0.18.0.linux-amd64.tar.gz
$ tar -zxvf blackbox_exporter-0.18.0.linux-amd64.tar.gz
$ cd ~/prometheus/blackbox_exporter-0.18.0.linux-amd64/
$ ./blackbox_exporter
level=info ts=2020-09-15T03:02:12.010Z caller=main.go:212 msg="Starting blackbox_exporter" version="(version=0.17.0, branch=HEAD, revision=1bc768014cf6815f7e9d694e0292e77dd10f3235)"
level=info ts=2020-09-15T03:02:12.010Z caller=main.go:213 msg="Build context" (gogo1.14.4,userroot@626fb3899f41,date20200619-11:54:41)=(MISSING)
level=info ts=2020-09-15T03:02:12.011Z caller=main.go:225 msg="Loaded config file"
level=info ts=2020-09-15T03:02:12.011Z caller=main.go:369 msg="Listening on address" address=:9115
2、配置 prometheus 启用 tcp 服务监控
$ vim ~/prometheus/prometheus-2.19.1.linux-amd64/prometheus.yml
global:
  scrape_interval:     15s # Set the scrape interval to every 15 seconds. Default is every 1 minute.
  evaluation_interval: 15s # Evaluate rules every 15 seconds. The default is every 1 minute.
  # scrape_timeout is set to the global default (10s).

# Alertmanager configuration
alerting:
  alertmanagers:
  - static_configs:
    - targets:
      - localhost:9093

# Load rules once and periodically evaluate them according to the global 'evaluation_interval'.
rule_files:
  - "rules/*.rules"
  # - "second_rules.yml"

# A scrape configuration containing exactly one endpoint to scrape:
# Here it's Prometheus itself.
scrape_configs:
  # The job name is added as a label `job=<job_name>` to any timeseries scraped from this config.
  - job_name: 'prometheus'

    # metrics_path defaults to '/metrics'
    # scheme defaults to 'http'.

    static_configs:
    - targets: ['localhost:9090']
  - job_name: 'node'
    file_sd_configs:
    # 刷新配置文件时间,默认5分钟
    - refresh_interval: 5m
      files:
      - json_config/node.json
  - job_name: 'port_status'
    metrics_path: /probe
    params:
      module: [tcp_connect]
    file_sd_configs:
    - refresh_interval: 5m
      files:
      - json_config/service.json
    relabel_configs:
    - source_labels: [__address__]
      target_label: __param_target
    - source_labels: [__param_target]
      target_label: instance
    - target_label: __address__
      replacement: localhost:9115
3、配置报警模版
$ cd rules/
$ vim blackbox-alert.rules
groups:
- name: blackbox_network_stats
  rules:
  - alert: 应用服务
    expr: probe_success == 0
    for: 1m
    labels:
      severity: 严重警告
    annotations:
      summary: "{{ $labels.instance }} 服务宕机"
      description: "{{ $labels.namespace }} {{ $labels.service }} 宕机"
4、开机自启
$ sudo vim /etc/systemd/system/blackbox-exporter.service
[Unit]
Description=Blackbox Exporter System
Wants=network-online.target
After=network-online.target

[Service]
User=root
Group=root
Type=simple
ExecStart=/home/jl/prometheus/blackbox_exporter-0.18.0.linux-amd64/blackbox_exporter \
        --config.file=/home/jl/prometheus/blackbox_exporter-0.18.0.linux-amd64/blackbox.yml
Restart=on-failure

[Install]
WantedBy=multi-user.target
$ systemctl enable /etc/systemd/system/blackbox-exporter.service
$ systemctl start blackbox-exporter
$ systemctl status blackbox-exporter
参考:
https://yunlzheng.gitbook.io/prometheus-book/
六、Grafana 看板
1、安装 Grafana
参考:https://grafana.com/grafana/download
以 centos8 为例
wget https://dl.grafana.com/oss/release/grafana-7.3.7-1.x86_64.rpm
sudo yum install grafana-7.3.7-1.x86_64.rpm
sudo systemctl daemon-reload
sudo systemctl start grafana-server
sudo systemctl status grafana-server
# 开机启动
sudo systemctl enable grafana-server
# 安装饼图插件
grafana-cli plugins install grafana-piechart-panel
service grafana-server restart
2、添加数据源
访问 http://localhost:3000
缺省用户名密码为 admin,输入后要求修改密码
添加数据源

选择 Prometheus 并设为默认

3、添加看板
从 https://grafana.com/grafana/dashboards?plcmt=footer 获取别人贡献的成熟看板,以其中一个为例,效果图如下:

导入步骤如下:

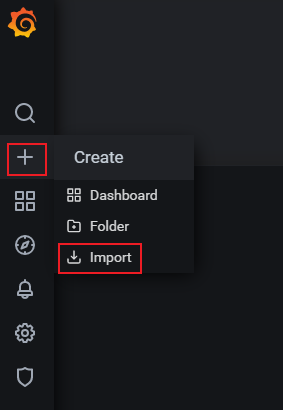
按提示填写信息即可


 741
741


 被折叠的 条评论
为什么被折叠?
被折叠的 条评论
为什么被折叠?
 到【灌水乐园】发言


