


项目中需要统计报表,之前的都是用JFreeChart,做出来也是很漂亮,据说open flash chart 做出来会更漂亮,还有人说简直炫的不行了,^_^,那就拿来试试喽。
因为之前没有用过,就直接上了官网down 个Content-greaphs.jar,还好使用起来比较简单,按照官网的 Example 做就可以成功。
但后来才发现是V1版的,确实不是很人性化,有两个问题:1。它不会使用我们 request 里提供的数据,而是要自己独立 load ,2.不能传递参数,如果遇到查询就麻烦了,但我们经常需要查询才能出报表,因为它只能带一个参数,我想的办法就是把所有的参数作为一个串先带到 action method 再分隔。也许是我不知道怎样传参才导致的,如果你知道的话别望了告诉我噢。我认为这些使得结合struts mvc 使用起来就不是很方便,以LineChart 为例,代码如下:
Add the connext-graph.jar to the WEb_INF/lib folder//添加jar问价到项目中
Include the taglib in your page //jsp 页面中加入标签定义
<%@ taglib prefix="m" uri="/connext" %>Insert the graph tag into your JSP page. In the example the data.txt file contains the controller logic for the graph. If you would a Struts 2 action to provide the controller logic then place it's fully qualified URL in the url property. Example, /contractor/Graph.action if the Graph action provides the logic. //在需要显示报表的地方使用标签,或者作为一个独立的include.jsp页面,使用时include即可,
<m:graph id="graph" width="800" height="300" align="middle" bgcolor="#FFFFFF" url="/Graph_example01.action"/>
就是这里,等页面加载完了之后再根据URL请求显示数据,所以如果使用进入本页面的URL的话就会发现会进入两次这个action method.也可以再URL后加上一个参数,像 "url="/Graph_example01.aciton?arg=11" "这样
下面就是要组装JSON数据的代码了,VALUE的值会是一个JSON格式串。
Code the Graph action class. Below is an example of the example01 method
OFCGraphController controller = new OFCGraphController();
controller.getTitle().setText("Example 01");
controller.getTitle().setSize(12);
//labels 为X轴显示标签定义为Array,Conllection类型都可
controller.getLabels().setLabels(Arrays.asList(labels));
controller.getYLegend().setText("No. of tasks");
controller.getYLegend().setColor("#8b0000");
controller.getYLegend().setSize(12);
controller.getXLegend().setText("Months");
controller.getXLegend().setColor("#8b0000");
controller.getXLegend().setSize(12);
controller.getColor().getBgColor().setColor("#FFFFFF");
controller.getColor().getXAxisColor().setColor("#e3e3e3");
controller.getColor().getYAxisColor().setColor("#e3e3e3");
controller.getColor().getXGridColor().setColor("#e3e3e3");
controller.getColor().getYGridColor().setColor("#e3e3e3");
DefaultOFCGraphDataModel model = new DefaultOFCGraphDataModel();//data01为Y轴的值,定义为Array ,Collections
model.setData(Arrays.asList(data01));
model.setFormat(new DecimalFormat("###0.000"));
model.setSeriesType(new OFCLineHollowSeriesType(3, "#8b0000", "Test", 10, 6));
controller.add(model);//想同时显示几条曲线就加入几个model
value = controller.render();
return SUCCESS;导入include.jsp,或不使用直接copy上面include.jsp代码到这里也可
Code the graph.jsp page to output the Graph.value property
<%@ include file="include.jsp" %>
<s:property value="value" escape="false" />//这里接收组装的JSON 格式value
Remember to put cache control off//可以关闭 cache 记忆
response.setHeader("Cache-Control","no-cache"); //HTTP 1.1
response.setHeader("Pragma","no-cache"); //HTTP 1.0
response.setDateHeader ("Expires", 0); //prevents caching at the proxy server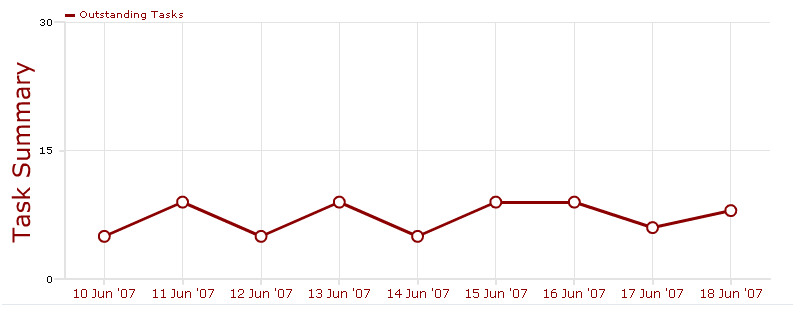


 80
80


 被折叠的 条评论
为什么被折叠?
被折叠的 条评论
为什么被折叠?
 到【灌水乐园】发言


