提示框是当你悬停时弹出的小文本框。(悬浮卡片更常见,可以出现在屏幕的任何位置;提示框一直依附于一些东西,就像散点图的点,或者柱状图的柱状。)
在这篇介绍中,你将会学到如何创建和定制化Google Charts的提示框。
Google Charts为所有核心图表自动创建提示框。 它们会默认被指定为SVG,在IE 8中会被指定为VML。你可以在核心图表中创建 HTML tooltips 通过在 chart options 声明tooltip.isHtml: true, draw() 函数也可以声明 Tooltip Actions.
在缺少任何定制化内容是,提示框会基于内部数据自动生成。你可以通过悬停鼠标在图表的任何柱状上来看到提示框。
![]()
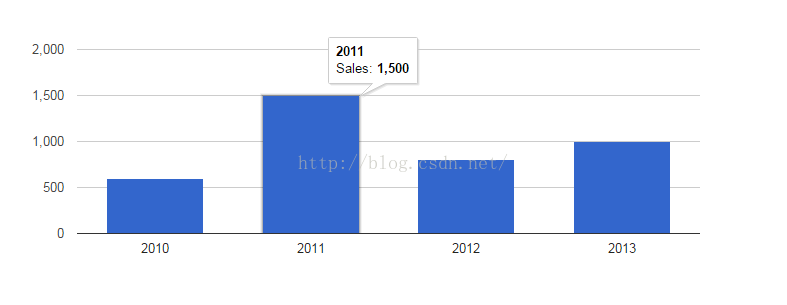
定制化提示框内容
在这个例子中,我们通过给DataTable增加一个新列和标记其为tooltip role来给提示框增加定制化内容。
注意:这里在 Bubble Chart 重不可用。
google.charts.load('current', {'packages':['corechart']});
google.charts.setOnLoadCallback(drawChart);
function drawChart() {
var dataTable = new google.visualization.DataTable();
dataTable.addColumn('string', 'Year');
dataTable.addColumn('number', 'Sales');
// A column for custom tooltip content
dataTable.addColumn({type: 'string', role: 'tooltip'});
dataTable.addRows([
['2010', 600,'$600K in our first year!'],
['2011', 1500, 'Sunspot activity made this our best year ever!'],
['2012', 800, '$800K in 2012.'],
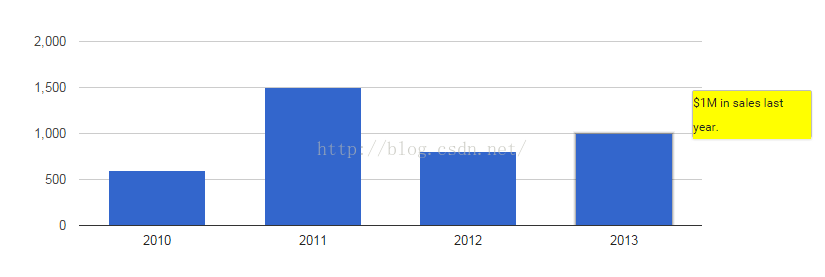
['2013', 1000, '$1M in sales last year.']
]);
var options = { legend: 'none' };
var chart = new google.visualization.ColumnChart(document.getElementById('tooltip_action'));
chart.draw(dataTable, options);
}
![]()
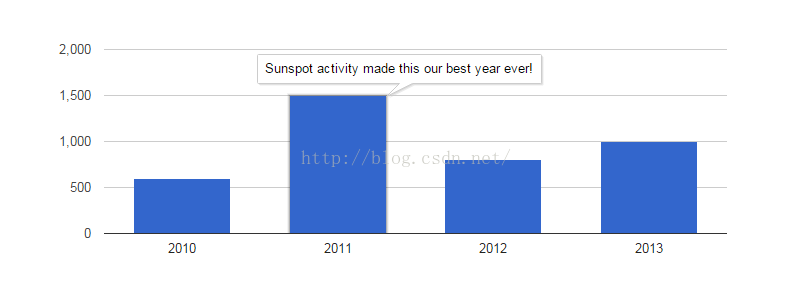
这个例子基于之前的例子的基础。给图表属性增加了 tooltip.isHtml: true
google.charts.load('current', {'packages':['corechart']});
google.charts.setOnLoadCallback(drawChart);

      function drawChart() {
        var dataTable = new google.visualization.DataTable();
        dataTable.addColumn('string', 'Year');
        dataTable.addColumn('number', 'Sales');
        // A column for custom tooltip content
        dataTable.addColumn({type: 'string', role: 'tooltip'});
        dataTable.addRows([
          ['2010', 600,'$600K in our first year!'],
          ['2011', 1500, 'Sunspot activity made this our best year ever!'],
          ['2012', 800, '$800K in 2012.'],
          ['2013', 1000, '$1M in sales last year.']
        ]);

        var options = {
          tooltip: {isHtml: true},
          legend: 'none'
        };
        var chart = new google.visualization.ColumnChart(document.getElementById('col_chart_html_tooltip'));
        chart.draw(dataTable, options);
      }
![]()
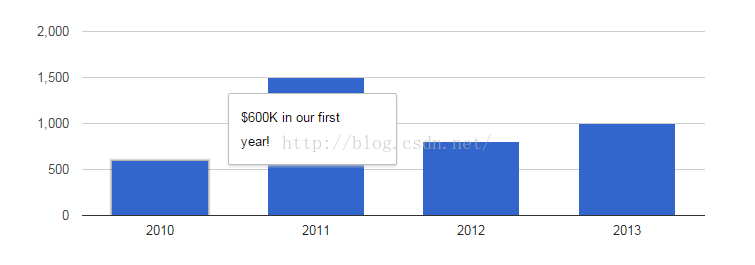
这看起来没有很多不同,现在我们来定制化HTML。
定制HTML 内容
之前的内容都是用空白文本的提示框,但是HTML提示框真正厉害的地方在,你可以用HTML标记定制化HTML提示框。你必须做两件事来达到:
- 在图表的属性里强调
tooltip.isHtml: true 。这样告诉图表用HTML画提示框而不是用SVG。 - 在数据表格中用html传统属性标记整个列,或者某一个单元。一个有提示框角色和HTML属性的数据表格列应该是这样的:
dataTable.addColumn({'type': 'string', 'role': 'tooltip', 'p': {'html': true}}) 注意:这个在 Bubble Chart 中不生效。 Bubble Chart 的HTML提示框不可定制。
定制HTML内容可以像增加一个<img>标签或者加粗文本一样简单:
![]()
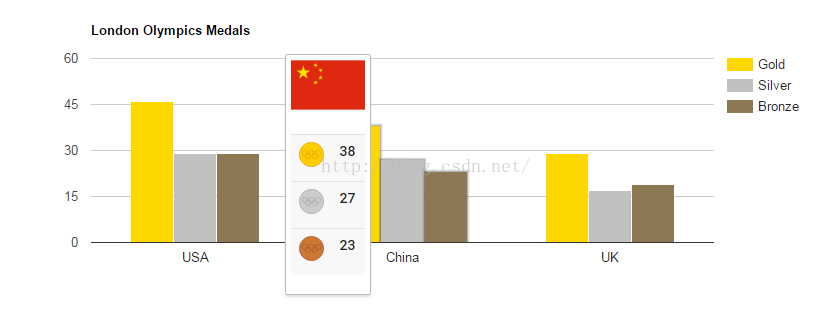
传统 HTML 内容可以包括动态生成的内容。这里,我们增加了一个包括给每个类别值动态生成表格的提示框。因为这个提示框依附于行的值,悬停在任何一个柱状上都会显示HTML提示框。
这个例子展示了如何让定制化的HTML提示框加载在一个域的列上。(在之前的例子里,它被加载在一个数据列上。)给域的轴线开启提示框需要设置'category'属性。
function drawChart() {
  var dataTable = new google.visualization.DataTable();
  dataTable.addColumn('string', 'Country');
  // Use custom HTML content for the domain tooltip.
  dataTable.addColumn({'type': 'string', 'role': 'tooltip', 'p': {'html': true}});
  dataTable.addColumn('number', 'Gold');
  dataTable.addColumn('number', 'Silver');
  dataTable.addColumn('number', 'Bronze');

  dataTable.addRows([
    ['USA', createCustomHTMLContent('https://upload.wikimedia.org/wikipedia/commons/2/28/Flag_of_the_USA.svg', 46, 29, 29), 46, 29, 29],
    ['China', createCustomHTMLContent('https://upload.wikimedia.org/wikipedia/commons/f/fa/Flag_of_the_People%27s_Republic_of_China.svg', 38, 27, 23), 38, 27, 23],
    ['UK', createCustomHTMLContent('https://upload.wikimedia.org/wikipedia/commons/a/ae/Flag_of_the_United_Kingdom.svg', 29, 17, 19), 29, 17, 19]
  ]);

  var options = {
    title: 'London Olympics Medals',
    colors: ['#FFD700', '#C0C0C0', '#8C7853'],
    // This line makes the entire category's tooltip active.
    focusTarget: 'category',
    // Use an HTML tooltip.
    tooltip: { isHtml: true }
  };

  // Create and draw the visualization.
  new google.visualization.ColumnChart(document.getElementById('custom_html_content_div')).draw(dataTable, options);
}

function createCustomHTMLContent(flagURL, totalGold, totalSilver, totalBronze) {
  return '<div style="padding:5px 5px 5px 5px;">' +
      '<img src="' + flagURL + '" style="width:75px;height:50px"><br/>' +
      '<table class="medals_layout">' + '<tr>' +
      '<td><img src="https://upload.wikimedia.org/wikipedia/commons/1/15/Gold_medal.svg" style="width:25px;height:25px"/></td>' +
      '<td><b>' + totalGold + '</b></td>' + '</tr>' + '<tr>' +
      '<td><img src="https://upload.wikimedia.org/wikipedia/commons/0/03/Silver_medal.svg" style="width:25px;height:25px"/></td>' +
      '<td><b>' + totalSilver + '</b></td>' + '</tr>' + '<tr>' +
      '<td><img src="https://upload.wikimedia.org/wikipedia/commons/5/52/Bronze_medal.svg" style="width:25px;height:25px"/></td>' +
      '<td><b>' + totalBronze + '</b></td>' + '</tr>' + '</table>' + '</div>';
}
![]()
Google Charts 的提示框可以用CSS旋转。在下面的图表中,提示框通过在图表div前用内嵌CSS顺时针旋转了30°:
<style>div.google-visualization-tooltip { transform: rotate(30deg);}</style>
![]()
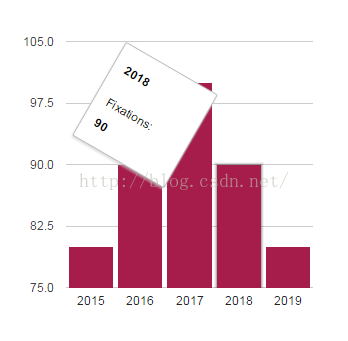
注意的是这只对HTML提示框生效:也就是有属性isHtml: true.
   <html>
  <head>
    <script type="text/javascript" src="https://www.gstatic.com/charts/loader.js"></script>
    <script type="text/javascript">
    google.charts.load('current', {'packages':['corechart']});
    google.charts.setOnLoadCallback(drawChart);
      function drawChart() {

        var data = google.visualization.arrayToDataTable([
          ['Year', 'Fixations'],
          ['2015',  80],
          ['2016',  90],
          ['2017',  100],
          ['2018',  90],
          ['2019',  80],
        ]);

        var options = {
          tooltip: { isHtml: true },    // CSS styling affects only HTML tooltips.
          legend: { position: 'none' },
          bar: { groupWidth: '90%' },
          colors: ['#A61D4C']
        };

        var chart = new google.visualization.ColumnChart(document.getElementById('tooltip_rotated'));

        chart.draw(data, options);
      }
    </script>
  </head>
  <body>
    <!-- The next line rotates HTML tooltips by 30 degrees clockwise. -->
    <style>div.google-visualization-tooltip { transform: rotate(30deg); }</style>
    <div id="tooltip_rotated" style="width: 400px; height: 400px;"></div>
  </body>
</html>
HTML 提示框可以包括任何你想要的HTML 内容—甚至是一个 Google Chart。有图表在你的提示框里,用户可以在悬停在数据元素时得到额外的信息:这是一个让人第一眼更深入了解高级详情的好方法。
柱状图展示了最近的几个主要体育赛事的最高浏览量,某个的提示框展示了一个最近十年平均浏览量的线形图。
![]()
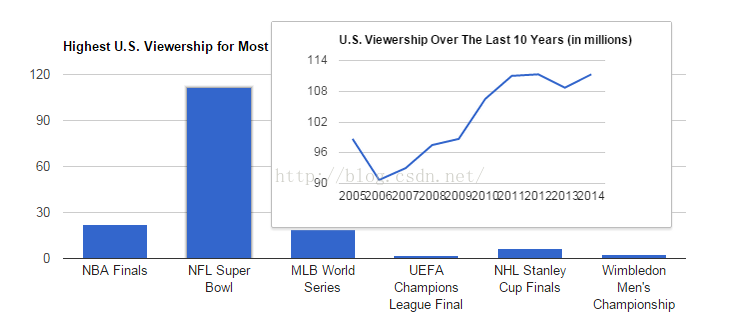
有几个要注意的。第一,一个 printable chart 需要画给某组要展示提示框的数据。第二,某个提示框需要一个"ready" event handler,我们通过addListener 来创建printable chart。
IMPORTANT: All tooltip charts must be drawn before the primary chart. This is necessary in order to grab the images to add to the primary chart's DataTable.
IMPORTANT PARTSFULL WEB PAGE
   <html>
  <head>
    <script type="text/javascript" src="https://www.gstatic.com/charts/loader.js"></script>
    <script type="text/javascript">
    google.charts.load('current', {'packages':['corechart']});
    google.charts.setOnLoadCallback(drawTooltipCharts);

      // Set up data for visible chart.
      var primaryData = [
        ['NBA Finals', 22.4],
        ['NFL Super Bowl', 111.3],
        ['MLB World Series', 19.2],
        ['UEFA Champions League Final', 1.9],
        ['NHL Stanley Cup Finals', 6.4],
        ['Wimbledon Men\'s Championship', 2.4]
      ];

      // Set up data for your tooltips.
      var tooltipData = [
        ['Year', 'NBA Finals', 'NFL Super Bowl', 'MLB World Series',
        'UEFA Champions League Final', 'NHL Stanley Cup Finals',
        'Wimbledon Men\'s Championship'],
        ['2005', 12.5, 98.7, 25.3, 0.6, 3.3, 2.8],
        ['2006', 13.0, 90.7, 17.1, 0.8, 2.8, 3.4],
        ['2007', 9.3, 93.0, 15.8, 0.9, 1.8, 3.8],
        ['2008', 14.9, 97.5, 17.1, 1.3, 4.4, 5.1],
        ['2009', 14.3, 98.7, 13.6, 2.1, 4.9, 5.7],
        ['2010', 18.2, 106.5, 19.4, 2.2, 5.2, 2.3],
        ['2011', 17.4, 111.0, 14.3, 4.2, 4.6, 2.7],
        ['2012', 16.8, 111.3, 16.6, 2.0, 2.9, 3.9],
        ['2013', 16.6, 108.7, 12.7, 1.4, 5.8, 2.5],
        ['2014', 15.7, 111.3, 15.0, 1.9, 4.7, 2.4]
      ];

      var primaryOptions = {
        title: 'Highest U.S. Viewership for Most Recent Event (in millions)',
        legend: 'none',
        tooltip: {isHtml: true} // This MUST be set to true for your chart to show.
      };

      var tooltipOptions = {
        title: 'U.S. Viewership Over The Last 10 Years (in millions)',
        legend: 'none'
      };

      // Draws your charts to pull the PNGs for your tooltips.
      function drawTooltipCharts() {

        var data = new google.visualization.arrayToDataTable(tooltipData);
        var view = new google.visualization.DataView(data);

        // For each row of primary data, draw a chart of its tooltip data.
        for (var i = 0; i < primaryData.length; i++) {

          // Set the view for each event's data
          view.setColumns([0, i + 1]);

          var hiddenDiv = document.getElementById('hidden_div');
          var tooltipChart = new google.visualization.LineChart(hiddenDiv);

          google.visualization.events.addListener(tooltipChart, 'ready', function() {

            // Get the PNG of the chart and set is as the src of an img tag.
            var tooltipImg = '<img src="' + tooltipChart.getImageURI() + '">';

            // Add the new tooltip image to your data rows.
            primaryData[i][2] = tooltipImg;

          });
          tooltipChart.draw(view, tooltipOptions);
        }
        drawPrimaryChart();
      }

      function drawPrimaryChart() {

        var data = new google.visualization.DataTable();
        data.addColumn('string', 'Event');
        data.addColumn('number', 'Highest Recent Viewership');

        // Add a new column for your tooltips.
        data.addColumn({
          type: 'string',
          label: 'Tooltip Chart',
          role: 'tooltip',
          'p': {'html': true}
        });

        // Add your data (with the newly added tooltipImg).
        data.addRows(primaryData);

        var visibleDiv = document.getElementById('visible_div');
        var primaryChart = new google.visualization.ColumnChart(visibleDiv);
        primaryChart.draw(data, primaryOptions);

      }
    </script>
  </head>
<body>
<div id="hidden_div" style="display:none"></div>
<div id="visible_div" style="height:300px"></div>
</body>
</html>
提示框可以包括JavaScript定义的动作。举个简单的例子,有一个提示框,动作是当用户点击“See sample book" 弹出对话框:
![]()
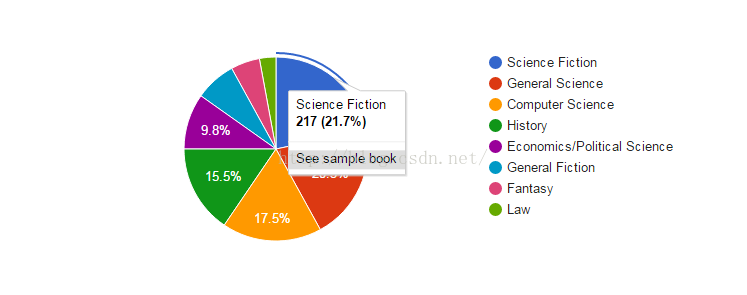
tooltip 选项会在用户选择饼状图的某一块时触发,使得写在setAction 中的代码运行:
    google.charts.load('current', {'packages':['corechart']});
    google.charts.setOnLoadCallback(drawChart);

      function drawChart() {
        var data = google.visualization.arrayToDataTable([
          ['Genre', 'Percentage of my books'],
          ['Science Fiction', 217],
          ['General Science', 203],
          ['Computer Science', 175],
          ['History', 155],
          ['Economics/Political Science', 98],
          ['General Fiction', 72],
          ['Fantasy', 51],
          ['Law', 29]
        ]);

        var chart = new google.visualization.PieChart(
          document.getElementById('tooltip_action'));

        var options = { tooltip: { trigger: 'selection' }};//这里要注意!!不是所有图标都有selection属性,timeline就没有!!

        chart.setAction({
          id: 'sample',
          text: 'See sample book',
          action: function() {
            selection = chart.getSelection();
            switch (selection[0].row) {
              case 0: alert('Ender\'s Game'); break;
              case 1: alert('Feynman Lectures on Physics'); break;
              case 2: alert('Numerical Recipes in JavaScript'); break;
              case 3: alert('Truman'); break;
              case 4: alert('Freakonomics'); break;
              case 5: alert('The Mezzanine'); break;
              case 6: alert('The Color of Magic'); break;
              case 7: alert('The Law of Superheroes'); break;
            }
          }
        });

        chart.draw(data, options);
      }
动作可以是 visible, enabled, 两者都有, 或者都没有. 当一个 Google Chart 被创建, 提示框动作只有在它是visible(可见)时是展示的,且只有在它是enabled(有效)时可以点击。
visible 和 enabled 应该是返回true或者false的函数。这些函数可以依赖元素ID和用户选择。
提示框可以由 focus 和selection触发。但是,作为提示框动作,selection 更好。 这样用户的选择动作更加方便。
动作当然不一定要是alerts,而是任何你可以用JavaScript做的动作。例子里我们增加了两个动作:一个是增大饼状图的一块,另一个是缩小。
![]()
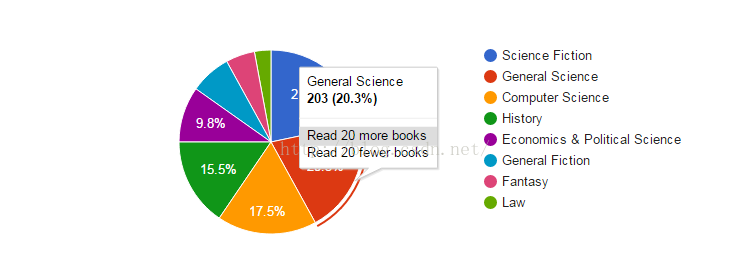
      google.charts.load('current', {'packages':['corechart']});
      google.charts.setOnLoadCallback(drawChart);

      function drawChart() {
        var data = google.visualization.arrayToDataTable([
          ['Genre', 'Percentage of my books'],
          ['Science Fiction', 217],
          ['General Science', 203],
          ['Computer Science', 175],
          ['History', 155],
          ['Economics & Political Science', 98],
          ['General Fiction', 72],
          ['Fantasy', 51],
          ['Law', 29]
        ]);

        var chart = new google.visualization.PieChart(
          document.getElementById('tooltip_action_2'));

        var options = { tooltip: { trigger: 'selection' }};

        chart.setAction({
          id: 'increase',
          text: 'Read 20 more books',
          action: function() {
            data.setCell(chart.getSelection()[0].row, 1,
                         data.getValue(chart.getSelection()[0].row, 1) + 20);
            chart.draw(data, options);
          }
        });

        chart.setAction({
          id: 'decrease',
          text: 'Read 20 fewer books',
          action: function() {
            data.setCell(chart.getSelection()[0].row, 1,
                         data.getValue(chart.getSelection()[0].row, 1) - 20);
            chart.draw(data, options);
          }
        });

        chart.draw(data, options);
      }
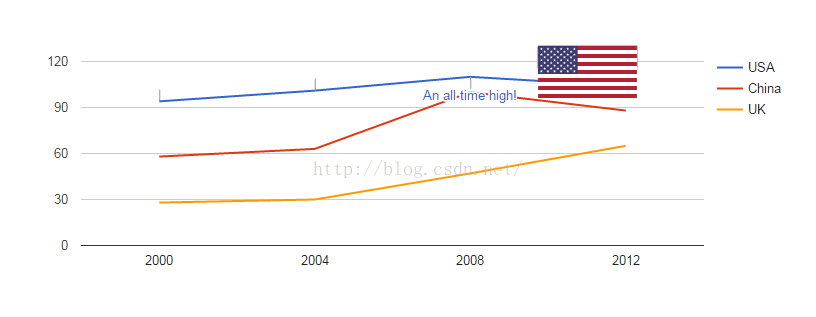
注释数据
你可以通过用annotationText 取代tooltip作为列角色来直接覆盖Google Chart上的文本。(你可以通过用你的鼠标悬停在注释上看到提示框。)
function drawChart() {
  var dataTable = new google.visualization.DataTable();
  dataTable.addColumn('string', 'Year');
  dataTable.addColumn('number', 'USA');
  dataTable.addColumn({type: 'string', role: 'annotation'});
  dataTable.addColumn({type: 'string', role: 'annotationText', p: {html:true}});
  dataTable.addColumn('number', 'China');
  dataTable.addColumn('number', 'UK');
  dataTable.addRows([
    ['2000',  94, '',  '', 58, 28],
    ['2004', 101, '',  '', 63, 30],
    ['2008', 110, 'An all time high!', '<img width=100px src="https://upload.wikimedia.org/wikipedia/commons/2/28/Flag_of_the_USA.svg">', 100, 47],
    ['2012', 104, '',  '', 88, 65]
  ]);

  var options = { tooltip: {isHtml: true}};
  var chart = new google.visualization.LineChart(document.getElementById('tt_6_annotation'));
  chart.draw(dataTable, options);
}
![]()
支持的图标
HTML 提示框如今支持如下图标:
If you are using the annotationText or tooltip roles, please see the documentation on roles to read about future changes and how to avoid future pain.


 2763
2763

 被折叠的 条评论
为什么被折叠?
被折叠的 条评论
为什么被折叠?
 到【灌水乐园】发言


