


1.什么是ELK
ELK是三个软件
1.E:elasticsearch java程序 存储,查询日志
2.L: logstash java程序 收集、过滤日志
3.K: kibana java程序 提供web服务,将数据页面化 4.F: filebeat go 收集、过滤日志
2.ELK作用
1.收集: 收集所有服务器的日志
2.传输: 把日志稳定的传输到ES或者其他地方
3.存储: ES能有效快速的存储日志数据
4.分析: 通过web页面分析数据
5.监控: 监控集群架构
3.ELK优点
1.处理方式灵活:elasticsearch是实时全文索引,具有强大的搜索功能
2.配置相对简单:elasticsearch全部使用JSON 接口,logstash使用模块配置,kibana的配置文件部分更简单。
3.检索性能高效:基于优秀的设计,虽然每次查询都是实时,但是也可以达到百亿级数据的查询秒级响应。
4.集群线性扩展:elasticsearch和logstash都可以灵活线性扩展
5.前端操作绚丽:kibana的前端设计比较绚丽,而且操作简单
4.为什么使用ELK
#收集所有的日志
web服务日志
业务服务日志
系统日志

#统计、分析:
1.统计访问量
2.统计访问量前10的IP
3.站点访问次数最多的URL
4.查询一上午以上三个值
5.查询一下午以上三个值
6.对比一下上下午用户访问量
7.对比这一周,每天用户增长还是减少
Elastic Stack:Elasticsearch、Kibana、Beats 和 Logstash | Elastic 官网下载地址


二、ELK搭建
1.ES搭建#https://www.cnblogs.com/tcy1/p/13498184.html
1)时间同步

[root@db01 ~]# yum install -y ntpdate
[root@db01 ~]# ntpdate time1.aliyun.com
安装java环境

#上传
[root@db01 ~]# rz jdk-8u181-linux-x64.rpm

#安装
[root@db01 ~]# rpm -ivh jdk-8u181-linux-x64.rpm
es安装

# 1.上传或下载包
[root@db01 ~]# rz elasticsearch-6.6.0.rpm
下载地址:https://www.elastic.co/downloads/elasticsearch

# 2.安装
[root@db01 ~]# rpm -ivh elasticsearch-6.6.0.rpm

# 3.根据提示继续操作
[root@db01 ~]# systemctl daemon-reload
[root@db01 ~]# systemctl enable elasticsearch.service
Created symlink from /etc/systemd/system/multi-user.target.wants/elasticsearch.service to /usr/lib/systemd/system/elasticsearch.service.
[root@db01 ~]# systemctl start elasticsearch.service

# 4.启动失败,查看日志
[2020-08-10T10:38:56,170][ERROR][o.e.b.Bootstrap          ] [node-1] node validation exception
[1] bootstrap checks failed
[1]: memory locking requested for elasticsearch process but memory is not locked
#说明内存未锁定

# 5.修改内存限制,内存锁定需要进行配置需要2g以上内存,否则会导致无法启动elasticsearch。
[root@db01 ~]# vim /usr/lib/systemd/system/elasticsearch.service
[Service]
... ...
LimitMEMLOCK=infinity				                         # 添加此行在service中
[root@linux-elk1 ~]# vim /etc/elasticsearch/jvm.options                  # 一般设置内存大小为实际物理内存大小的一半即可
-Xms2g
-Xmx2g     #最小和最大内存限制,为什么最小和最大设置一样大?参考:https://www.elastic.co/guide/en/elasticsearch/reference/current/heap-size.html
2.搭建 Logstash
# 注意:
你要收集谁的日志,就在谁身上装logstash
1)安装java环境

1.上传java包
2.安装Java环境
2)时间同步

[root@web01 ~]# ntpdate time1.aliyun.com
3)安装Logstash

1.上传包
[root@web01 ~]# rz logstash-6.6.0.rpm

2.安装
[root@web01 ~]# rpm -ivh logstash-6.6.0.rpm

3.授权
[root@web01 ~]# chown -R logstash.logstash /usr/share/logstash/

#启动程序(无需启动,后面调用启动文件再一起使用)
/usr/share/logstash/bin/logstash
3.logstash介绍#
1)输入输出插件介绍#
INPUT、OUTPUT插件
INPUT:插件使Logstash收集指定源的日志
OUTPUT:插件将事件数据发送到特定的目的地
2)Logstash输入输出测试
#配置环境变量
[root@web01 ~]# vim /etc/profile.d/logstash.sh
export PATH=/usr/share/logstash/bin/:$PATH

#收集标准输入到标准输出测试
[root@web01 ~]# logstash -e 'input { stdin {} } output { stdout {} }'

#测试输入
123456
{
	#时间戳
    "@timestamp" => 2020-08-13T01:34:24.430Z,
    	  #主机
          "host" => "web01",
      #版本
      "@version" => "1",
       #内容
       "message" => "123456"
}

#收集标准输入到标准输出指定格式
[root@web01 ~]# logstash -e 'input { stdin {} } output { stdout { codec => rubydebug } }'
123456
{
       "message" => "123456",
      "@version" => "1",
    "@timestamp" => 2020-08-13T01:39:40.837Z,
          "host" => "web01"
}

3)Logstash收集标准输入到文件
#收集标准输入到文件
[root@web01 ~]# logstash -e 'input { stdin {} } output { file { path => "/tmp/test.txt" } }'

#收集标准输入到文件
[root@web01 ~]# logstash -e 'input { stdin {} } output { file { path => "/tmp/test_%{+YYYY-MM-dd}.txt" } }'

4)Logstash收集标准输入到ES

#收集标准输入到ES
[root@web01 ~]# logstash -e 'input { stdin {} } output { elasticsearch { hosts => ["10.0.0.51:9200"] index => "test_%{+YYYY-MM-dd}" } }'

#随便输入些内容

#查看页面
4.kibana搭建
1)安装
# 安装包路径
es官网: https://www.elastic.co/

#上传代码包
[root@db01 ~]# rz kibana-6.6.0-x86_64.rpm

#安装
[root@db01 ~]# rpm -ivh kibana-6.6.0-x86_64.rpm

# 修改配置文件
[root@db01 ~]# vim /etc/kibana/kibana.yml
[root@db01 ~]# grep "^[a-z]" /etc/kibana/kibana.yml
#进程的端口
server.port: 5601
#监听地址
server.host: "10.0.0.51"
#指定ES的地址
elasticsearch.hosts: ["http://10.0.0.51:9200"]
#kibana也会创建索引
kibana.index: ".kibana"

# 启动kibana
[root@db01 ~]# systemctl start kibana.service

#验证
[root@db01 ~]# netstat -lntp
tcp        0      0 10.0.0.51:5601          0.0.0.0:*               LISTEN      88636/node

3)kibana页面
1.时间区域
2.日志列表区域
3.搜索区域
4.数据展示区
三、Logstash使用
Logstash是一个开源的数据收集引擎,可以水平伸缩,而且logstash整个ELK当中拥有最多插件的一个组件,其可以接收来自不同来源的数据并统一输出到指定的且可以是多个不同目的地。
1.logstash的配置文件
#默认的配置文件
/etc/logstash/logstash.yml

#一般不使用,只有用system管理时才使用
2.收集文件中的日志到文件
1)配置

[root@web01 ~]# vim /etc/logstash/conf.d/message_file.conf(文件名随意写,只需启动时调用就行)
input {
  file {
    path => "/var/log/messages"
    start_position => "beginning"			# 这里的beginning是指定位置点从文件开始读取
  }
}
output {
  file {
    path => "/tmp/message_file_%{+YYYY-MM-dd}.log"
  }
}

2)启动
#检测配置
[root@web01 ~]# logstash -f /etc/logstash/conf.d/message_file.conf -t

#启动
[root@web01 ~]# logstash -f /etc/logstash/conf.d/message_file.conf

3)查看是否生成文件
[root@web01 tmp]# ll
total 4
-rw-r--r-- 1 root root 1050 Aug 13 11:24 message_file_2020-08-13.log

3.收集文件中的日志到ES
1)配置
# 在输出时可以只写集群中的一个ip,但是以防只写一个ip容易出现单点服务器故障无法和集群其他机器通讯,所以这里写多个ip,视情况而定。
[root@web01 ~]# vim /etc/logstash/conf.d/message_es.conf
input {
  file {
    path => "/var/log/messages"
    start_position => "beginning"
  }
}
output {
  elasticsearch {
    hosts => ["10.0.0.51:9200","10.0.0.52:9200","10.0.0.53:9200"]
    index => "message_es_%{+YYYY-MM-dd}"
  }
}

2)启动

[root@web01 ~]# logstash -f /etc/logstash/conf.d/message_es.conf
4.启动多个logstash收集日志
1)创建多个数据目录
# 默认在启动logstash时会产生数据文件,当不指定数据文件时,会在指定路径生成数据,
当启动多个logstash收集日志时会发现第一个logstash可以正常启动,当第二个logstash启动时却无法启动,所以需要为不同的logstash启动时指定不同的数据目录。

# 创建数据目录
[root@web01 ~]# mkdir /data/logstash/{message_file,message_es} -p

#授权
[root@web01 ~]# chown -R logstash.logstash /data/

2)启动时指定数据目录
[root@web01 ~]# logstash -f /etc/logstash/conf.d/message_es.conf --path.data=/data/logstash/message_es &
[1] 18693
[root@web01 ~]# logstash -f /etc/logstash/conf.d/message_file.conf --path.data=/data/logstash/message_file &
[2] 18747

3)验证
查看文件和ES页面

5.一个logstash收集多个日志#
1)配置

# 这里为收集多个日志文件到不同文件中
[root@web01 ~]# vim /etc/logstash/conf.d/more_file.conf
input {
  file {
    type => "messages_log"
    path => "/var/log/messages"
    start_position => "beginning"
  }
  file {
    type => "secure_log"
    path => "/var/log/secure"
    start_position => "beginning"
  }
}
output {
  if [type] == "messages_log" {
    file {
      path => "/tmp/messages_%{+YYYY-MM-dd}"
    }
  }
  if [type] == "secure_log" {
    file {
      path => "/tmp/secure_%{+YYYY-MM-dd}"
    }
  }
}
6.收集nginx和tomcat的日志
[root@web01 tmp]# vim /etc/logstash/conf.d/message_file.conf
input {										# 输入
  file {									# 事件源为文件
    type => "nginx_log"						                # 因为有收集两个文件日志,通过这里打个标签,名字随意定
    path => "/var/log/nginx/access.log"		                                # 收集nginx的日志路径
    start_position => "beginning"			                        # 监控文件为持续监控
    sincedb_path => "/dev/null"				                        # 配合beginning使用,从日志文件开头开始监控
  }
  file {									# 这里也是一样,监控的是tomcat日志
    type => "tomcat_log"
    path => "/usr/local/tomcat/logs/localhost_access_log*.txt"
    start_position => "beginning"
    sincedb_path => "/dev/null"
  }
}
output {									# 输出
  if [type] == "nginx_log" {				                        # 和input的type配合,如果是nginx日志文件就执行如下
    elasticsearch {							        # 指定输出源为es
      hosts => ["10.0.0.51:9200"]			                        # es集群中任意地址
      index => "message_nginx_%{+YYYY-MM-dd}"	                                # 数据文件格式
    }
  }
  if [type] == "tomcat_log" {				                        # 和上面nginx一样,这里是tomcat的输出信息
    elasticsearch {
      hosts => ["10.0.0.51:9200"]
      index => "message_tomcat_%{+YYYY-MM-dd}"
    }
  }
}
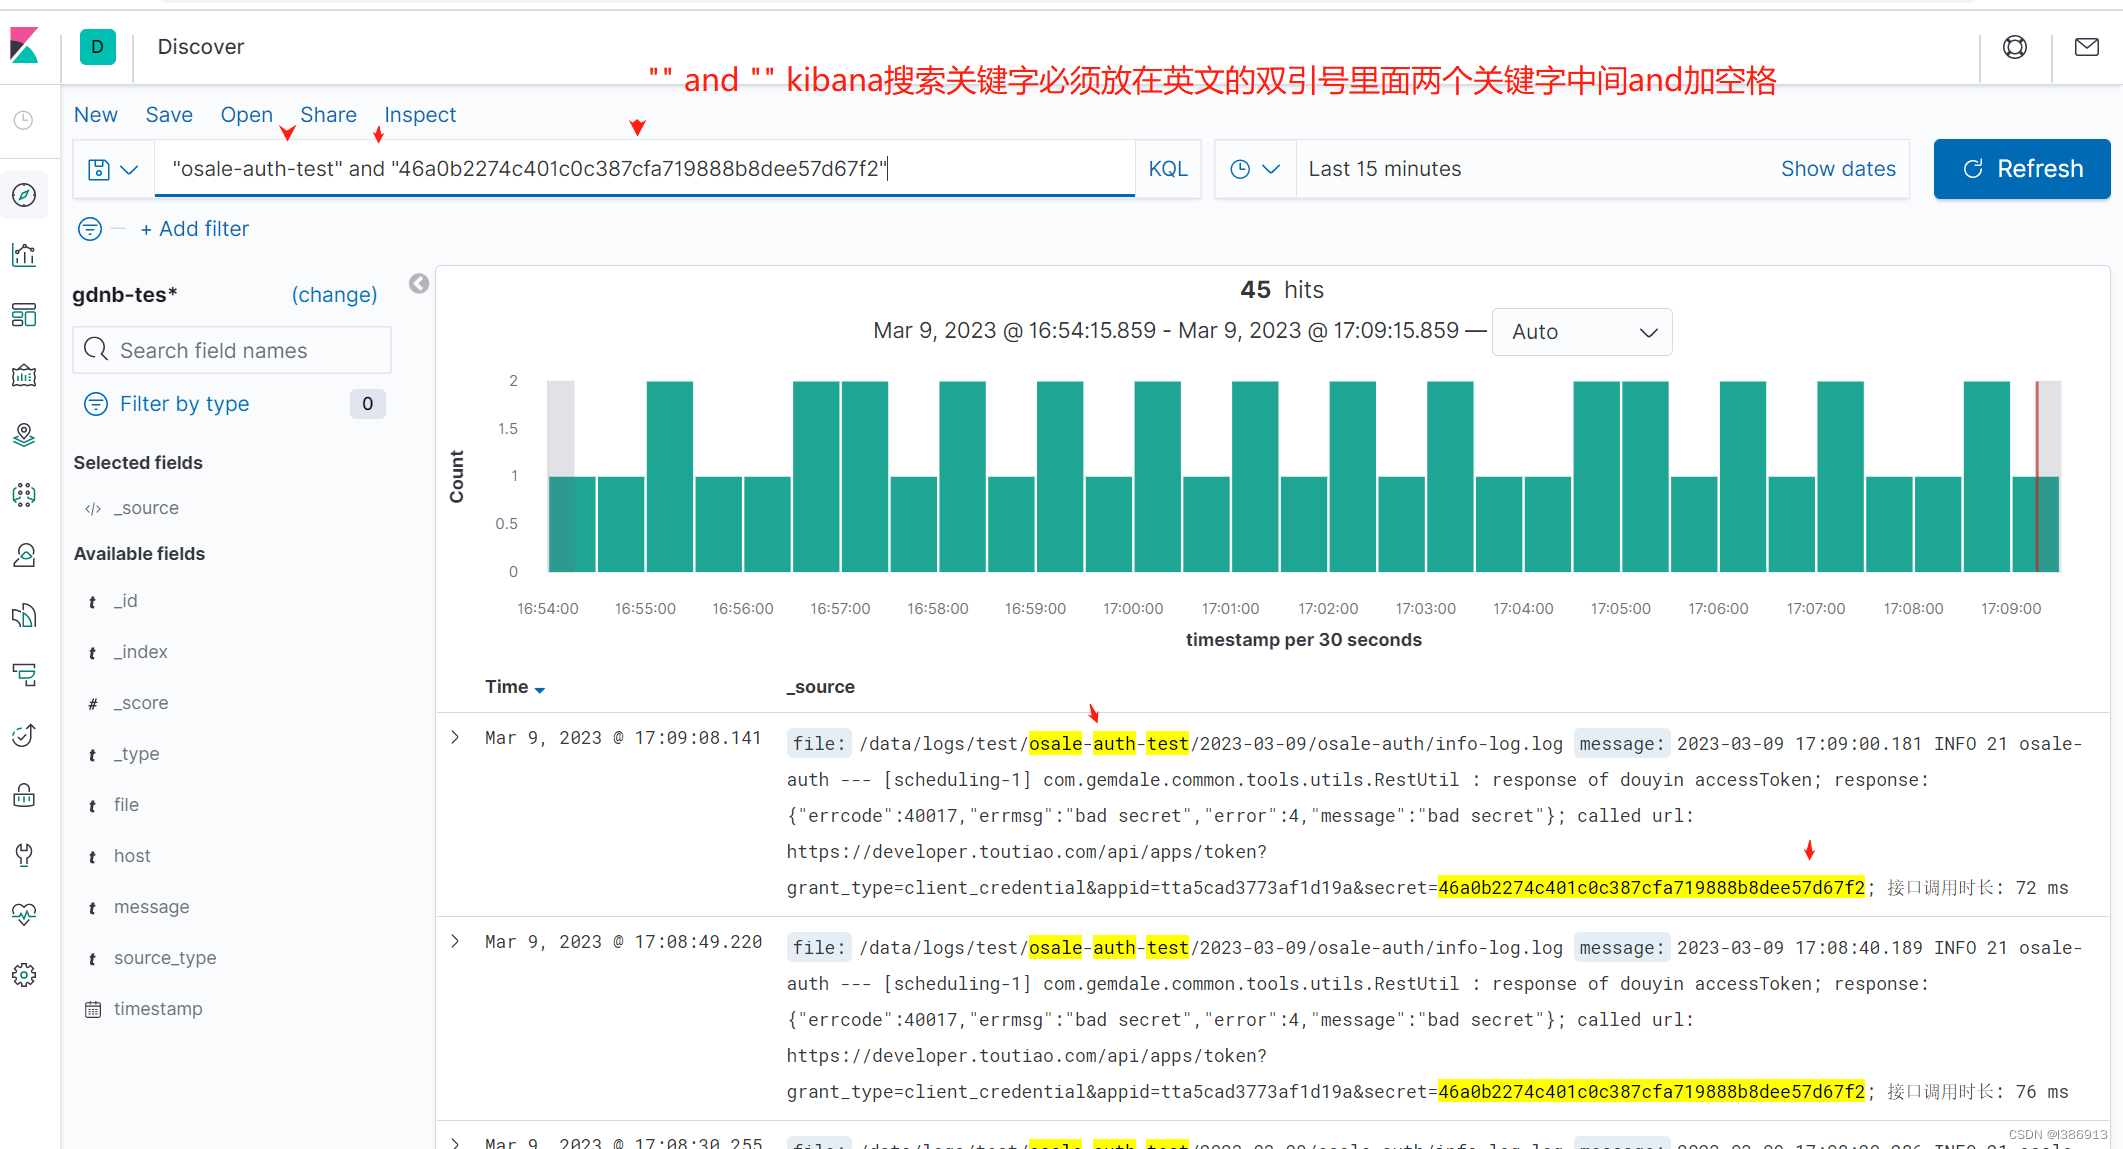
7.kibana展示数据
1)kibana中根据索引名,和es索引建立绑定
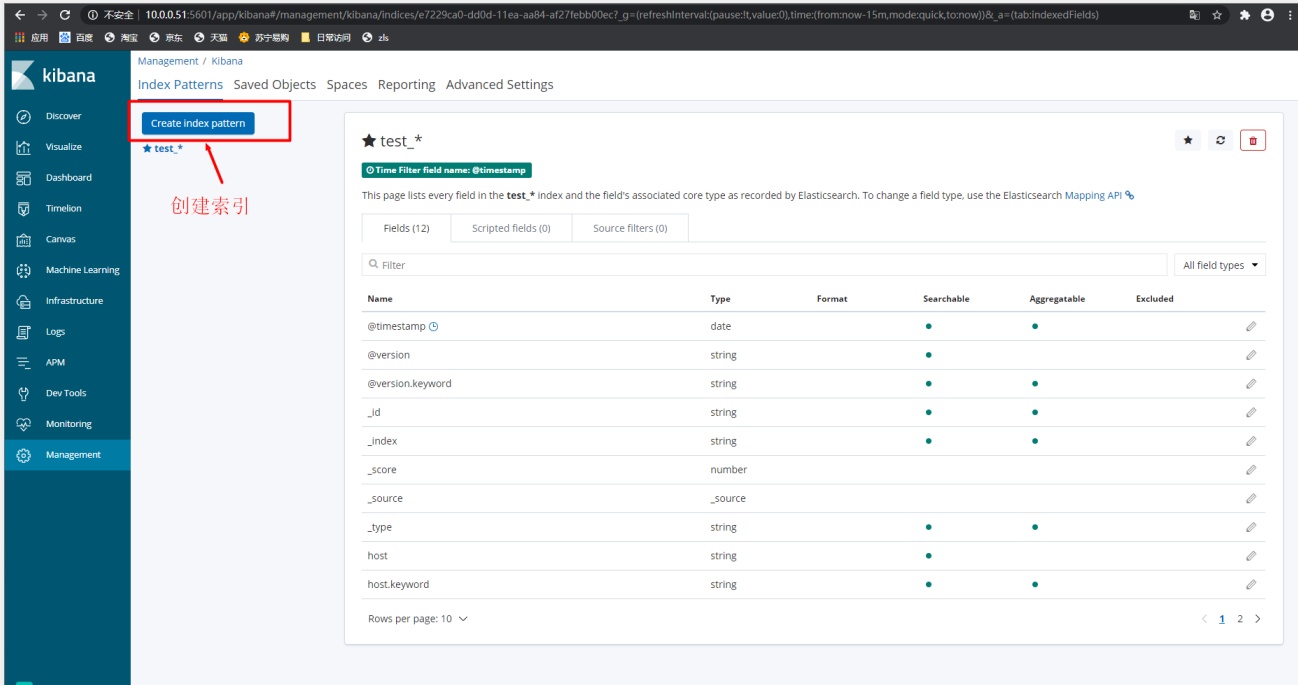
2) 搜索已经存在的索引名

3)配置选择时间戳

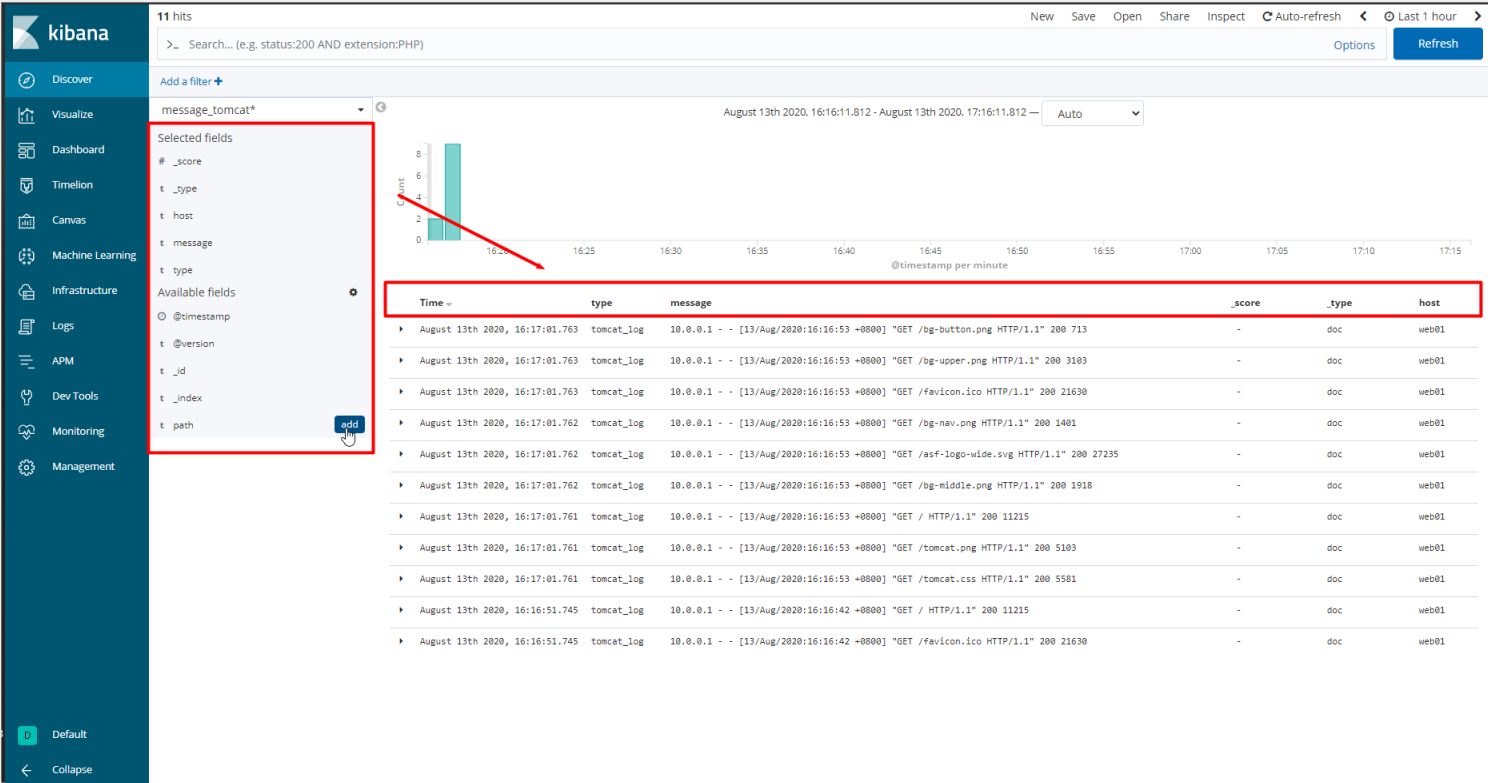
4) 在发现中,找到已经绑定的索引

5) 可对最近的日志按不同时间进行查看

6) 可将左侧中的字段添加至右侧进行显示
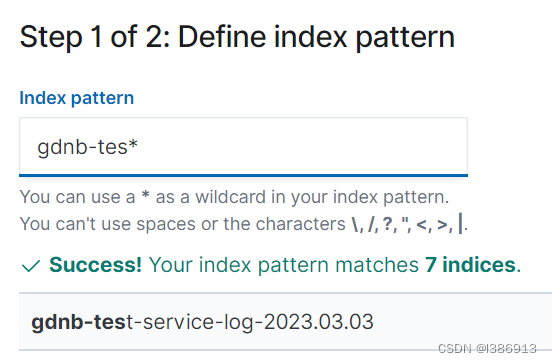
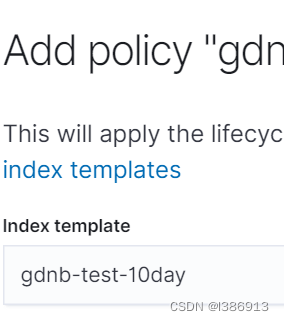
1.Kibana设置elasticsearch索引过期时间,到期自动删除
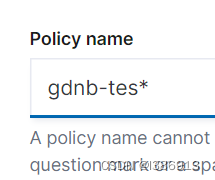
首先创建一个索引,索引必须名字后面*这样所有日期都能检索出。然后在创建一个十天的日志生命周期管理,在创建一个索引模板,索引模板可以检索出所有需要检索的日志,这个索引模板可以直接复制日志生命周期管理代码,也可之后日志生命周期里面加入这个索引模板。

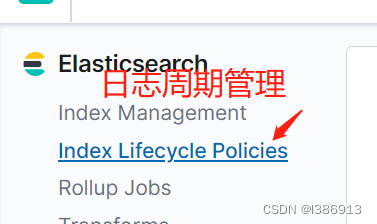
2.创建一个索引生命周期策略
Index Management 索引管理
Index Lifecycle Policies 索引生命周期策略
Delete phase 删除阶段


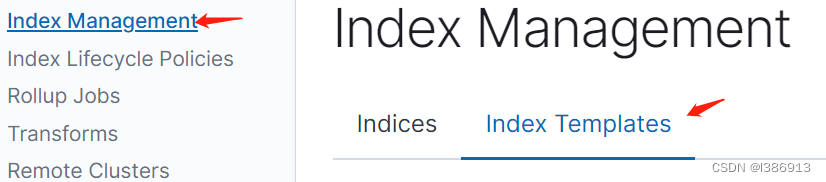
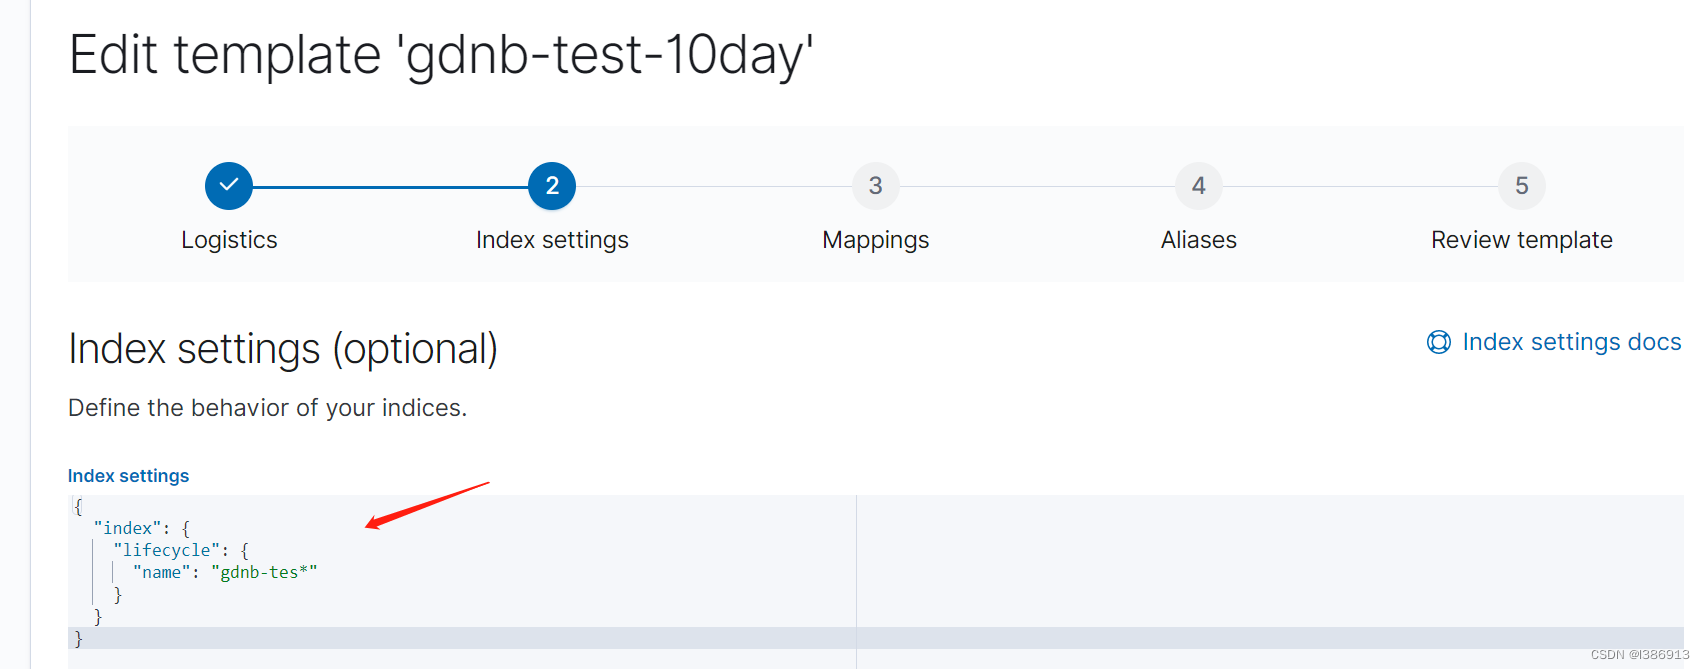
3.创建一个索引模板用来管理所有索引
Index Templates 索引模板

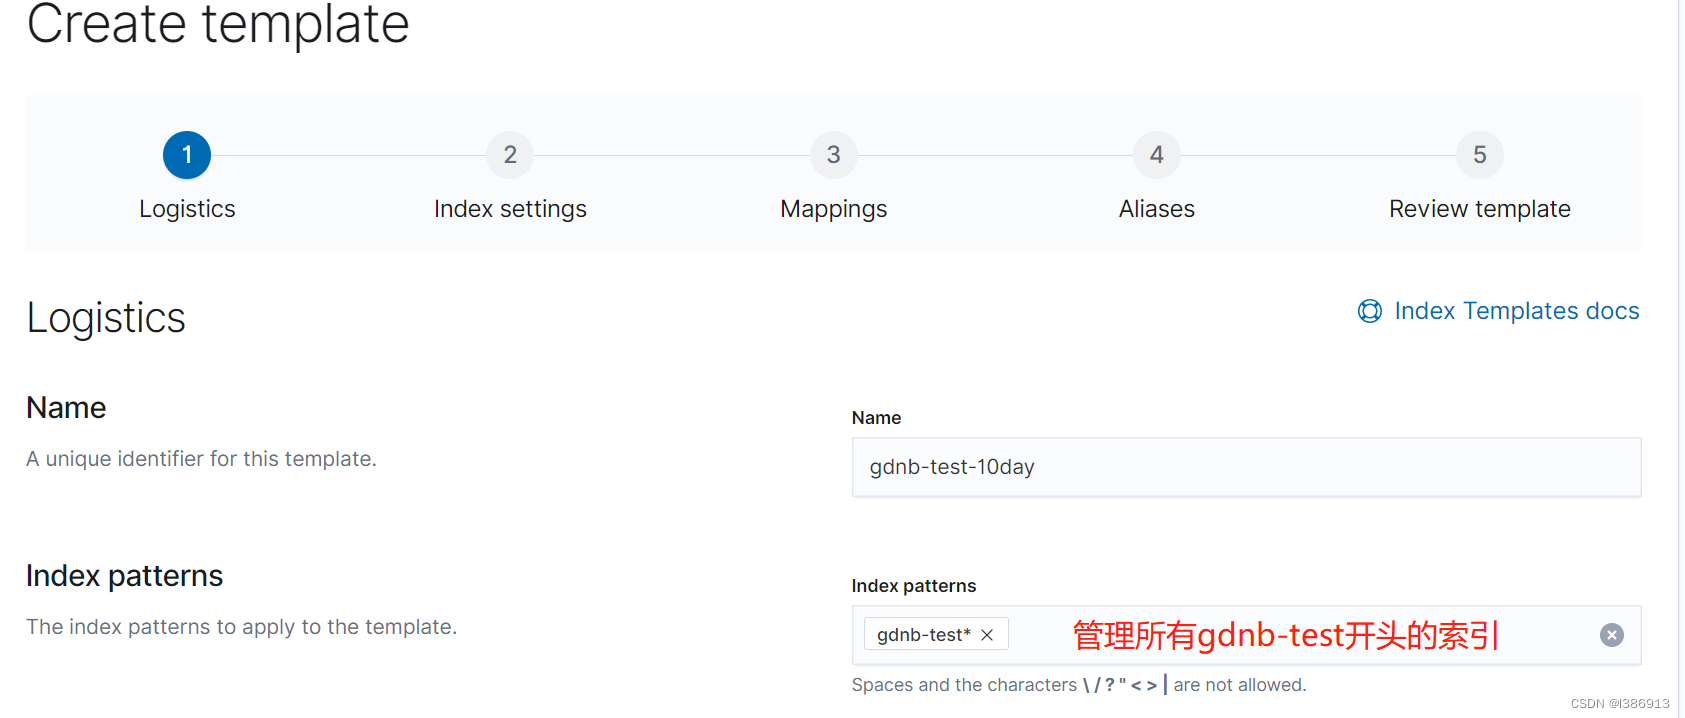
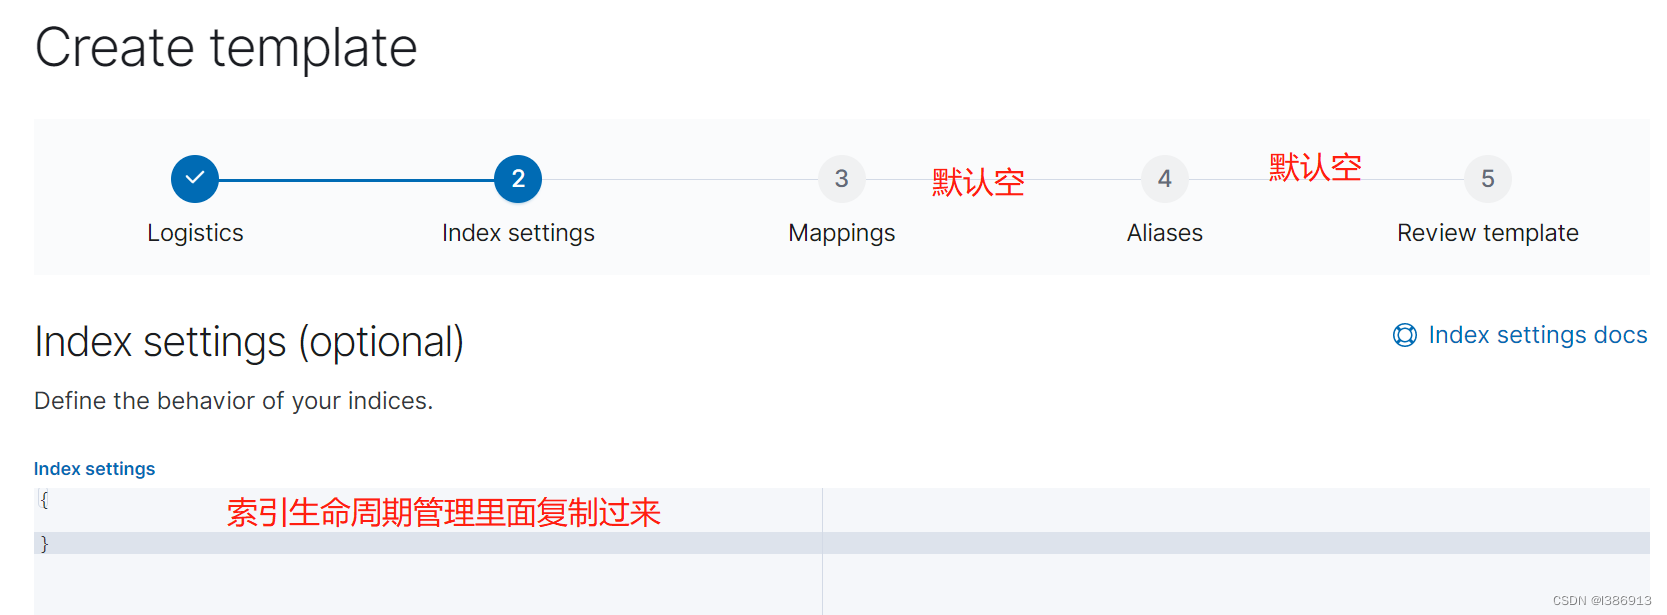
{
  "index": {
    "lifecycle": {
      "name": "gdnb-tes*"
    }
  }
}
可将索引周期管理的代码复制过去,也可直接到索引周期管理里面选择gdnb-test-10day这个索引模板

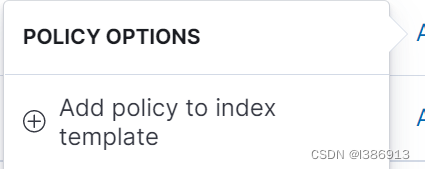
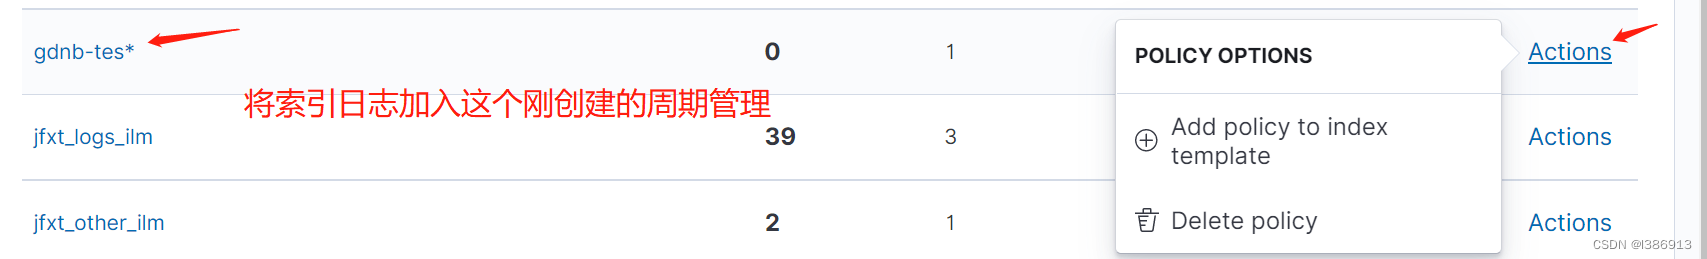
3.将需要保存十天的日志索引模板加入刚创建的周期生命管理


 被折叠的 条评论
为什么被折叠?
被折叠的 条评论
为什么被折叠?
 到【灌水乐园】发言


