


python系列文章目录
将自己遇到的python需要实现的需求进行简单记录。
目录
3.Python的matplotlib模块画折线图,柱状图与饼状图
前言
记录遇到的需求,自己使用的解决方法。
一、日志文件生成
1.python实现一个标准输出重定向的操作。
功能描述:
将项目的打印信息作为标准输出保存到日志文件之中,并且终端不输出打印的信息,将其注释之后,打印的信息可以在终端上显示。
import sys # sys是python与电脑系统交互的模块
def test():
print("jjc")
print("lzz")
print("hwp")
if __name__ == "__main__":
# 重定向标准输出
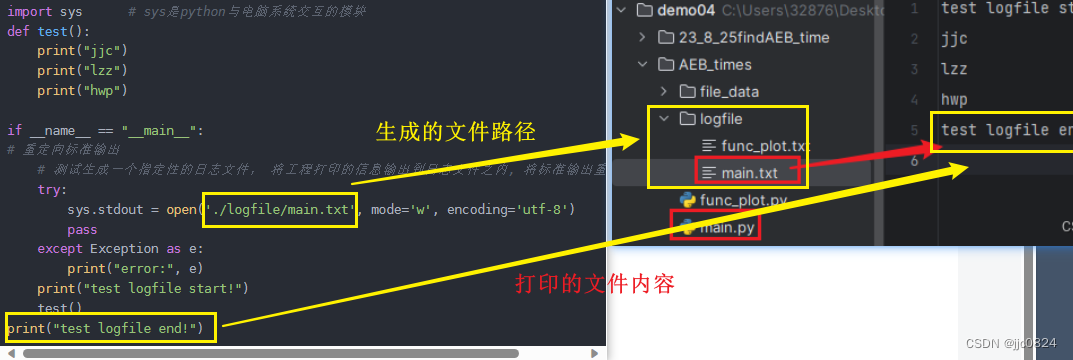
# 测试生成一个指定性的日志文件, 将工程打印的信息输出到日志文件之内, 将标准输出重定向到文件
try:
sys.stdout = open('./logfile/main.txt', mode='w', encoding='utf-8')
pass
except Exception as e:
print("error:", e)
print("test logfile start!")
test()
print("test logfile end!")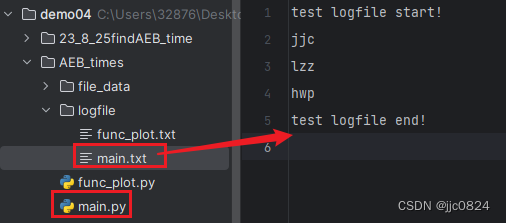
对上面的代码与图进行分析。
二、读取文件夹文件
1.Python使用生成器遍历文件,防止过度占用内存
功能描述:采用生成器遍历文件夹的文件,如果文件夹下文件数量过多就能避免内存占用过多。
def get_files_in_floder(path):
    print("采用生成器的方式遍历文件夹下的文件!")
    for root, dirs, files in os.walk(path):
        for file in files:
            file_path = os.path.join(root, file)
            yield file_path

def main():
path = 文件路径		# 例如:path = "./file_data"
files = get_files_in_floder(path)
当文件夹下的文件过多时,使用os.listdir(文件路径)读取文件的方式会将文件名称全部读取到内存之内,当文件过多会导致内存占用过多。
三、Python文件操作
1.python对一个CSV文件打开进行操作。
功能描述:python打开一个文件,对其内部数据进行操作。
file = 文件路径 + 文件名称
# 打开文件进行操作
with open(file, mode='r', encoding='utf-8') as file_data:
    file_data.readline()    # 舍去第一行 readline()获取一行的方法
    total = sum(1 for line in open(file, encoding='utf-8'))  # 获取文件总行数

    # 遍历文件的每一行
    for num, i in enumerate(file_data):		# num-行,i-文件num行内容
    Record_Time, Device_type = i.strip().split(',')	# 获取行内容
2.python求取两个时间的时间差
功能描述:使用python的datetime模块求两个时间的时间差。
import datetime        # 导包

def Time_Sub(time_start_in, time_after_in):
time_after_in_get = time_after_in		# 结束时间

    result = time_after_in_get.replace('\ufeff\t', '')    # 将\ufeff\t用空白字符代替
    date3_after = datetime.strptime(result, '%Y-%m-%d %H:%M:%S.%f')
    date3_start = datetime.strptime(time_start_in, '%Y-%m-%d %H:%M:%S.%f')

    time_num = (date3_after - date3_start).total_seconds()		# 转换为秒钟
    return time_num
3.Python的matplotlib模块画折线图,柱状图与饼状图
功能描述:将数据图形化显示,折线图,柱状图与饼状图的表现方式。
import matplotlib.pyplot as plt
import matplotlib.font_manager import FontProperties	# 解决中文乱码模块
import matplotlib.font_manager as fm		# 解决图例中的中文显示问题

def plot_07():
# 创建07车辆的数据
    x_07 = [1, 2, 3, 4, 5, 6, 7, 8, 9, 10, 11, 12]
    y_07_warning = [1, 1, 5, 1, 0, 9, 0, 1, 0, 0, 8, 5]  # 预警信息
    y_07_retardation = [0, 0, 4, 0, 0, 2, 0, 0, 0, 0, 3, 4]  # 制动信息
    y_07_warning_all = 35
    y_07_retardation_all = 13
    # 设置中文字体 -- 解决中文显示乱码的问题
    font = FontProperties(fname=r"c:\windows\fonts\simsun.ttc", size=14)

    # 绘制折线图
    # plt.plot(x_07, y_07_warning, 'b--')
    # plt.plot(x_07, y_07_retardation, 'r')

    # 绘制柱状图
    width = 0.35  # 设置柱子的宽度
    plt.bar(x_07, y_07_warning, width=width, color='b', alpha=0.7, label='预警')
    plt.bar([i + width for i in x_07], y_07_retardation, width=width, color='r', alpha=0.7, label='制动')

    # 添加标题与坐标轴标签
    plt.title("GA6258 10月14日 - 10月25日AEB触发情况", fontproperties=font)  # 07
    plt.xlabel("时间", fontproperties=font)
    plt.ylabel("次数", fontproperties=font)

    # 修改x轴的刻度
    plt.xticks([1, 2, 3, 4, 5, 6, 7, 8, 9, 10, 11, 12],
               ['14', '15', '16', '17', '18', '19', '20', '21', '22', '23', '24', "25"], fontproperties=font)

    # 显示图例 -- 设置中文字体
    font_path = r"c:\windows\fonts\simsun.ttc"
    prop = fm.FontProperties(fname=font_path)
    plt.legend(prop=prop)

    # 显示图像
    plt.show()

    # 绘制第二个图像,饼状图
    data = [y_07_warning_all, y_07_retardation_all]
    labels = ['预警', '制动']
    wedges, text_labels, percent_labels = plt.pie(data, labels=labels, autopct='%1.1f%%')
    # 绘制饼状图
    plt.title("AEB触发情况", fontproperties=font)
    # 设置标签字体为中文
    plt.rcParams['font.sans-serif'] = ['SimHei']

    # 设置饼状图百分比占比数值的字体大小
    plt.setp(percent_labels, fontsize=13)
    plt.setp(text_labels, fontsize=13)
    plt.show()
四、总结
上面介绍了python的生成日志文件,求取时间差,生成器遍历文件夹文件与画简单折线图,柱状图等方法。


 被折叠的 条评论
为什么被折叠?
被折叠的 条评论
为什么被折叠?
 到【灌水乐园】发言


