


所有的sql 通过dblink 查询全部等待中,
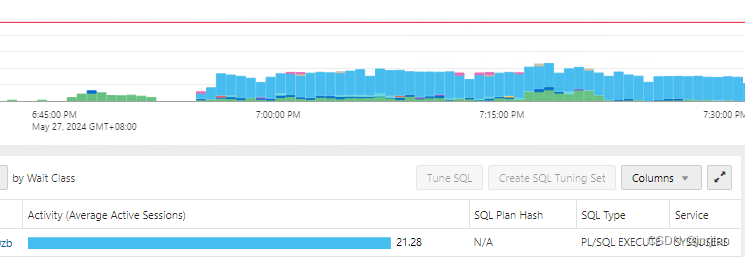
同一个SQL 20多个session 在跑,等待事件network,可能怀疑是不是网络断开了,导致没有返回
执行sql 如下:
BEGIN X@dblink ; END;
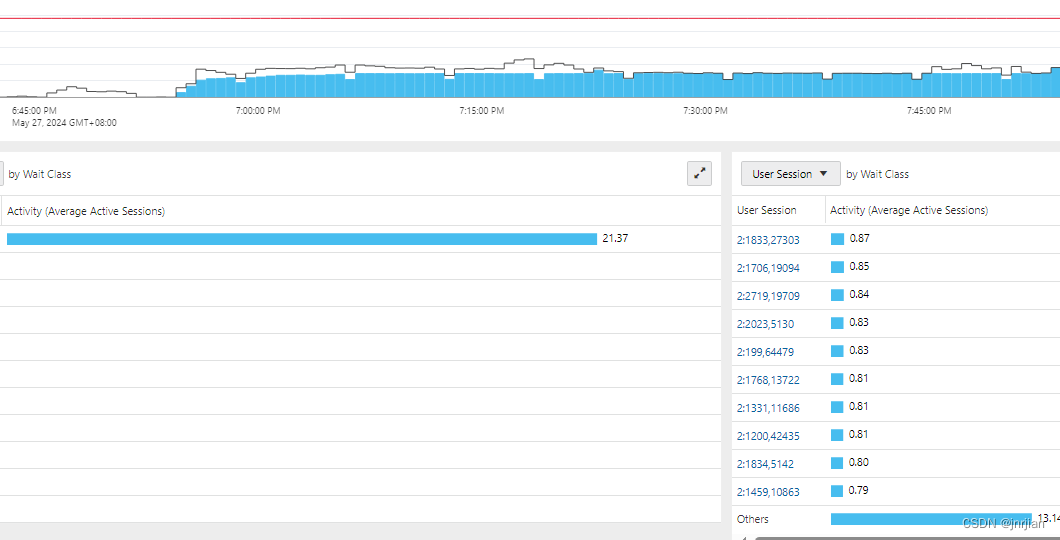
去到dblink 所在的db,发现20多个sql在执行一个sql,等待事件fast object check point

发现同一个sql的两个执行计划,最终发现PK index失效导致。


The following SELECT Statement shows different elapsed time from the original database to the coloning database.
For the excution plan, database parameters and rows of table are same on two databases.
SELECT *
FROM xxx MMT
WHERE mmt.xxx_id = 1661
1. On Original database: elapsed time is 10s.
2. On cloning database: elapsed time is 72s.
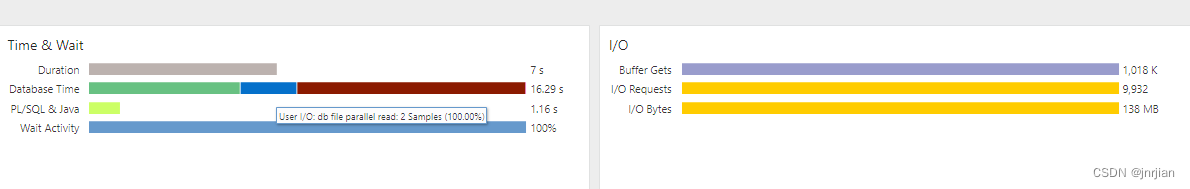
The direct path read wait event from cloning database consumes 65s in the below 10046 trace.
call count cpu elapsed disk query current rows
------- ------ -------- ---------- ---------- ---------- ---------- ----------
Parse 1 0.04 0.03 0 0 0 0
Execute 1 0.00 0.00 0 0 0 0
Fetch 2 7.75 72.17 611660 612506 0 1
------- ------ -------- ---------- ---------- ---------- ---------- ----------
total 4 7.79 72.21 611660 612506 0 1
Misses in library cache during parse: 1
Optimizer mode: ALL_ROWS
Parsing user id: 173
Number of plan statistics captured: 1
Rows (1st) Rows (avg) Rows (max) Row Source Operation
---------- ---------- ---------- ---------------------------------------------------
1 1 1 TABLE ACCESS FULL xxx (cr=612506 pr=611660 pw=0 time=0 us cost=167711 size=277 card=1)
Elapsed times include waiting on following events:
Event waited on Times Max. Wait Total Waited
---------------------------------------- Waited ---------- ------------
SQL*Net message to client 2 0.00 0.00
SQL*Net more data to client 1 0.00 0.00
enq: KO - fast object checkpoint 1 0.00 0.00
direct path read 38390 0.45 65.02 <<<<<<<<<<<<<<< direct path read : 65s
SQL*Net message from client 2 37.56 37.56
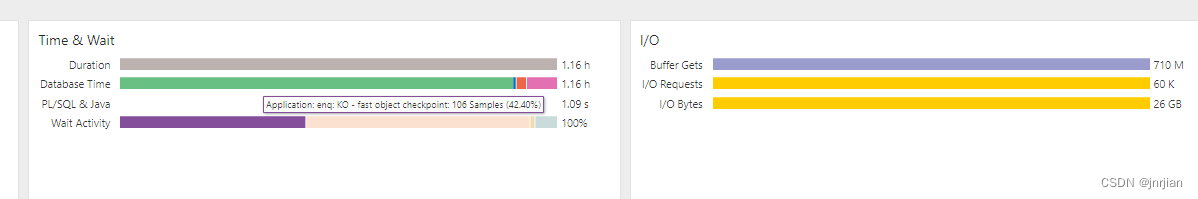
enq: KO - fast object checkpoint 1 0.00 0.00 --SGA 压力 不足
1.
"enq: KO - fast object checkpoint" is a wait event that is waiting until the checkpoints finishes in a particular object level.
At checkpoints, dirty buffers(updated buffers) on the buffer cache has to be written out to the disk by DBWR.
This checkpoint occurs by object level so if the process is not related to this particular object, the client should not have a delay from it.
However when DBWR process is under high load, it might affect to the performance.
2.
All reporting queries are doing full table scans concurrently. Oracle uses direct path reads instead of db file scattered reads. And direct path reads require a checkpoint
SOLUTION
"_serial_direct_read"=NEVER
WARNING: This solution is for non-Exadata system only. On Exadata system please don't disable direct path reads as it is critical to SmartIO benefits.
3. 就是cache不足, keep为0 所以不停的读盘
- EM displays a huge amount of 'Application' and 'Other' on the 'Average active sessions' chart compared to normal
- CKPT process consistently high in the process list
- AWR top 5 wait events show :
- "enq: KO - fast object checkpoint"
- "reliable message"
- ASH report Top SQL with Top Events shows queries with high waits on "enq: KO - fast object checkpoint"
- A review of the tables in the query revealed that the table is defined to use the keep cache:
...
STORAGE(INITIAL 327680 NEXT 1048576 MINEXTENTS 1 MAXEXTENTS 2147483645
PCTINCREASE 0 FREELISTS 1 FREELIST GROUPS 1
BUFFER_POOL KEEP FLASH_CACHE <<<######
DEFAULT CELL_FLASH_CACHE DEFAULT) - The Initialization parameters section in AWR report indicate that DB_KEEP_CACHE_SIZE was not set,
CAUSE
Tables involved in the process that is waiting on these events have buffer_pool = keep but the keep buffer pool was not configured on these instances.
Altering these tables to use the default buffer pool resolved the issue.
This issue was due to the excessive direct path reads that occurred as a result of the misconfiguration explained above and is dealt with in:
Bug 12530276 High 'direct path read' waits when buffer pools are not setup.
SOLUTION
1. The bug is fixed in 11.2.0.3
2. Workarounds:
- Change the object definitions with keep buffer cache to use the default buffer cache
- Allocate a keep buffer pool by setting parameter DB_KEEP_CACHE_SIZE to a non-zero value
CHANGES
CAUSE
It's due to buffer cache overflow on cloning database. So, the query become slow when data reads from the disk.
Note : The SGA_SIZE is 32G. However the the current usage of buffer cache(__db_cache_size) reaches to 30G. So, It indicted that buffer cache was almost fully used by other hot data.
SOLUTION
Options:
1. Flush buffer cache only when it's a test server.
sqlplus / as sysdba
SQL> alter system flush buffer_cache;
- or -
2. keep the data of table into keep buffer cache
-- Check the table size
select BYTES/1024/1024 as SIZE_MB , table_name, owner from dba_segments where table_name = '<TABLE_NAME>';
-- Check KEEP buffer cache size
select component, current_size
from v$memory_dynamic_components
where component = 'KEEP buffer cache';
-- Increase keep buffer cache size if needed
alter system set db_keep_cache_size = 500m scope=both;
Note: the size 500m is an example.
-- Keep whole data of table into keep buffere cache
alter table <TABLE_NAME> storage( buffer_pool keep);
-- Check the table whether in keep buffer cache
select buffer_pool
from dba_tables
where table_name = '<TABLE_NAME>';


 674
674

 被折叠的 条评论
为什么被折叠?
被折叠的 条评论
为什么被折叠?
 到【灌水乐园】发言


