


JavaScript Diagram Library
DHTMLX Diagram library is a powerful component for generating any JavaScript diagrams you need
in a few lines of code. Automatic layout and live editors will help you visualize complex data in a neat hierarchical structure.
DHTMLX Diagram Library Features
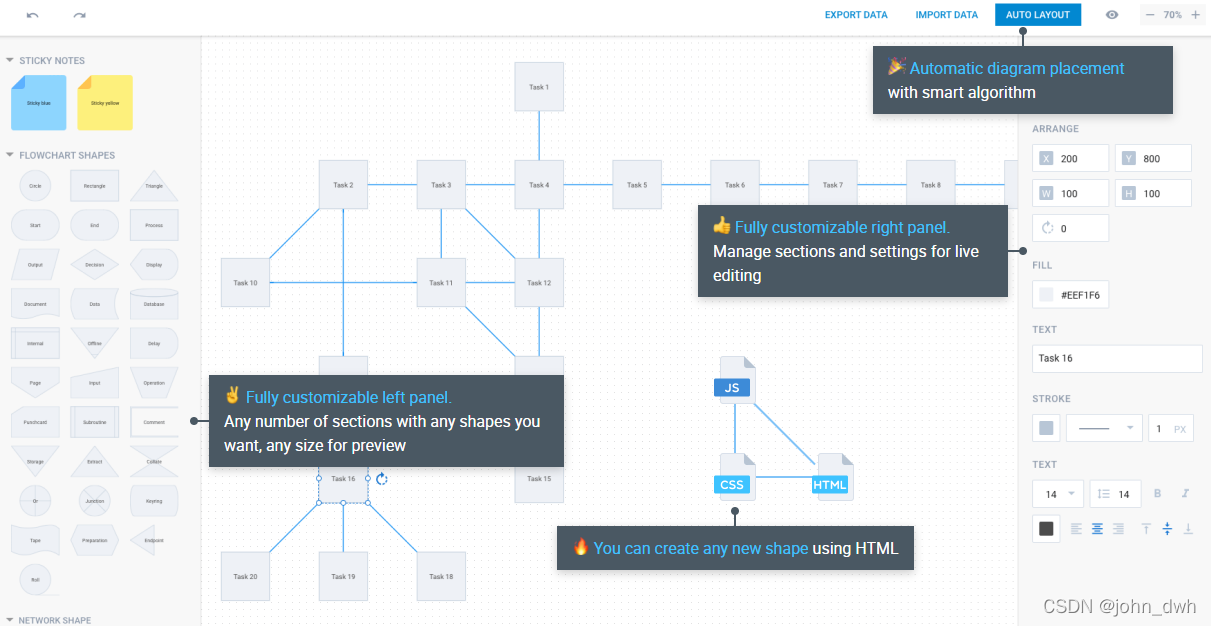
Automatic diagram placement with smart algorithm
Fully customizable left panel.
Any number of sections with any shapes you want, any size for preview
Fully customizable right panel.
Manage sections and settings for live editing
You can create any new shape using HTML
Live Diagram and Org chart editors for a quick diagram arrangement
Group work with multiple objects (select, copy, move, delete)
Simple creation of custom figures to suit your needs
Cross-browser support (IE11+)
Search feature
Template change while zooming
Export to PDF and PNG
Data import/export in JSON format
High performance with large datasets
Editable and non-editable modes
Auto layout (auto-placement) modes
Expanding and collapsing branches
Localization for Org chart and Diagram editors
Convenient API
Easy customization according to your needs
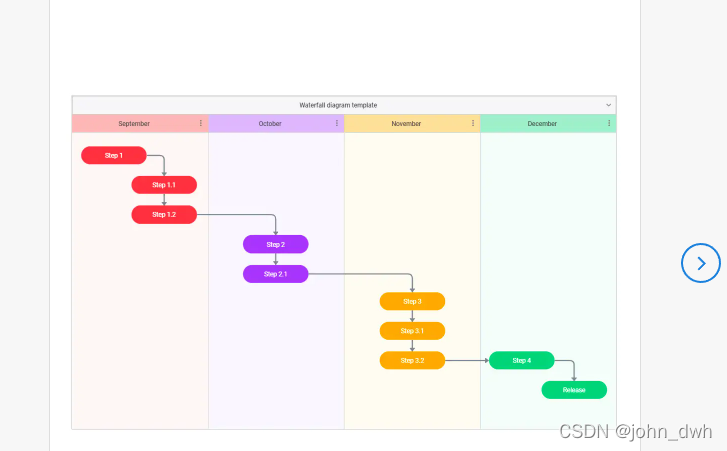
Creating swimlanes and groups
Inline editing
Decision Tree
One of the most convenient ways to find the right solution for the company is to compare different options graphically by means of decision tree diagrams. A tree structure helps you to reflect your business decisions together with the expenses and draw conclusions.
Create separate branches for each decision to be taken
Add details like the amount of time and resources needed for decision implementation
Make graphics colorful for better illustration
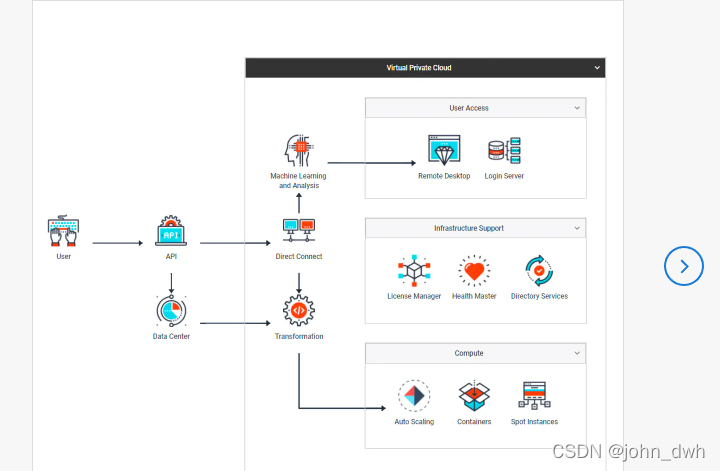
Simple Code to Create Any JavaScript Diagram Shape
diagram.addShape("networkCard", {
template: config => (
`<section class="network_template">
<img src='${config.img}'></img>
<span>${config.title}</span>
<span>${config.text}</span>
</section>`
),
defaults: {
width: 160,
height: 160,
img: "../network_image/desktop.svg",
title: "I’m custom shape",
text: "With two text lines"
}
});
What You Get with DHTMLX JavaScript Diagram Library
DHTMLX Diagram library can add beautiful and interactive graphics
to your web application. It is created by software professionals who are successfully building web development tools for ages.

High performance
You can visualize data with any amount of nodes and connectors. The library is very lightweight and provides fast rendering and high performance. It works seamlessly in all modern web browsers: Google Chrome, Firefox, IE11+, Safari.
Due to a short learning curve, you can easily integrate DHTMLX in any web app. The diagram framework is purely JavaScript with data loading in the JSON format. It can be flawlessly used with any server-side technologies. We also provide an export service supporting PDF and PNG formats.
Flexible visualization
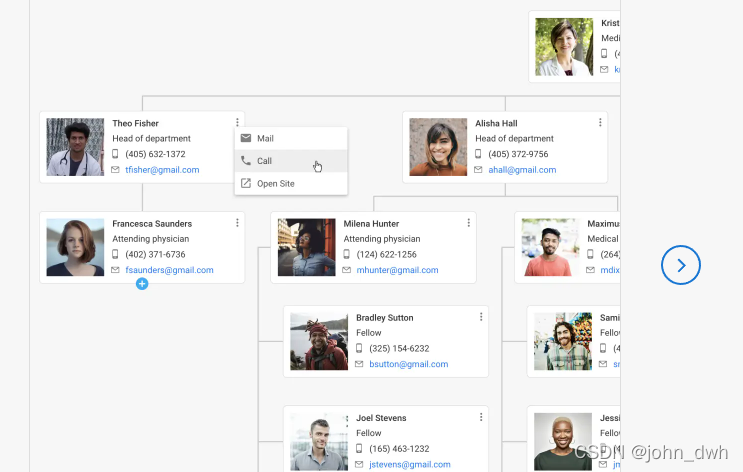
Using our diagram library JavaScript developers can easily visualize data with the help of predefined or custom elements. You can combine textual nodes, nodes with an image, or mixed types of nodes in one diagram. All in all, there are more than 30 built-in figures available. You can easily add custom ones with the help of straightforward HTML templates.
Convenient live editors
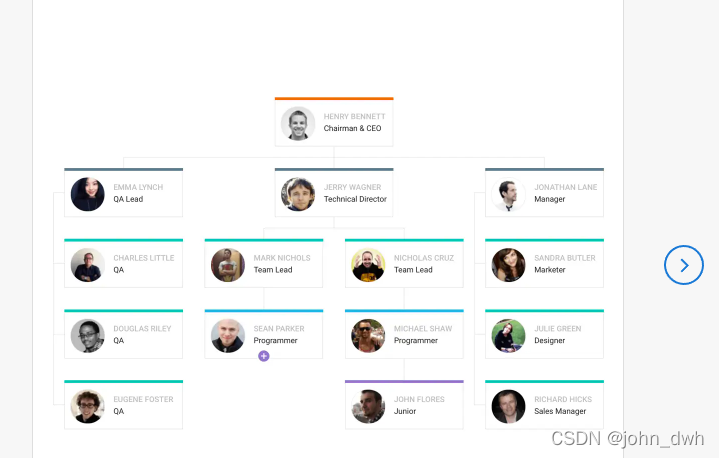
You can change the appearance of all elements without coding in the edit mode. There are three types of editors available: for org charts, mind maps, and other JavaScript diagrams such as flowcharts, activity, block, tree diagrams, etc. After you have finished the design process, you can export the result in JSON format.


 被折叠的 条评论
为什么被折叠?
被折叠的 条评论
为什么被折叠?
 到【灌水乐园】发言


