


All the charts, single package
It’s easy with amCharts 5 – all chart types come in a single, easy to understand package!
No need to figure out product line up – just get amCharts 5 for everything.
And since it was designed to work with modern web dev toolkits like React, Angular, Vue it will just fall into place, right out of the box.
X/Y
Line & Smoothed line
Area
Column & Bar
Scatter & Bubble
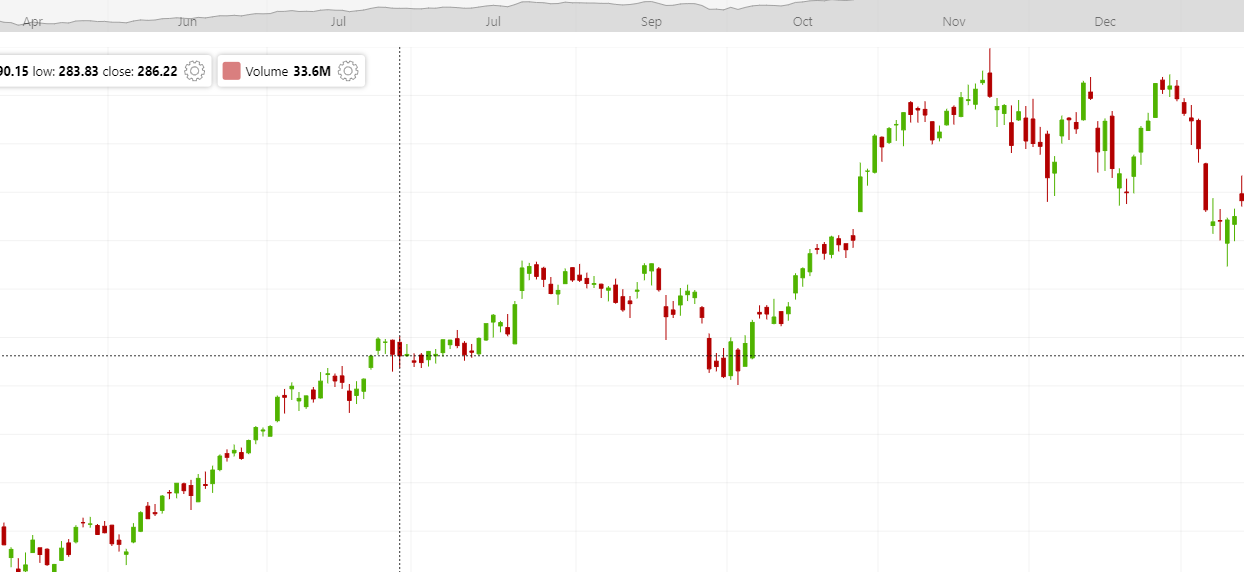
Candlestick & OHLC
Step (incl. w/ no-riser)
Floating & Gantt
Waterfall
Error
Stacked (regular or 100%)
Heatmap
… and any combination of the above
Percent
Pie & Donut
Nested donut
Funnel
Pyramid
Pictorial
Geo maps
Map chart
Geo heat map
Map combined with charts
Maps is an add-on and requires separate license.

Other
Sankey diagram
Chord, Chord directed, and Chord non-ribbon diagrams
Pack
Treemap
Tree
Sunburst
Partition
Force-directed tree
Radar & Polar
Word cloud
Venn diagram
Efficiency built-in
Canvas rendering
amCharts 5 uses browser’s Canvas API which in most cases is way faster than SVG. Less moving parts in the DOM tree, faster rendering.

Layering
Common element groups are isolated into separate independent canvases, so that heavily updated sections do not trigger expensive repaints in places that do not change.
Fast data processing
Data processing in amCharts 5 is designed to be as efficient as possible. Incremental updates, lack of repetitive aggregations, and lightweight data object use makes data processing fast and very memory-efficient.
Faster dashboards
amCharts 5 is capable of running scores of charts on the same page, without crippling the browser, due to its lightweight approach to data parsing and rendering.

Tiny binaries
We made amCharts 5 really small – the core functionality compiles to a file of only around 400KB. Each niche functionality is separated into files, so you load only what you really need. Users will surely appreciate faster load times.
Better tree-shaking
We also designed amCharts 5 to be extremely tree-shakable. If you are using Webpack or similar packager, only code that is really needed will be included into your final application.

The most advanced chart package
Classics with some new twists
XY charts are now so powerful and flexible, you can plot any data on them. Number, date, duration, or category axes are supported, in all directions.
Pie charts are now fully nestable, with support for custom start and end angles, to create half circles.

New geo maps
Our maps use GeoJSON format. Being open and widely accepted standard it opens up a lot of possibilities and sources for ready-made and custom maps.
Furthermore, maps are now very flexible, with multi-series support, configurable down to the nut and bolt.
(Maps is and add-on to amCharts 5: Charts which requires separate license)
More about amCharts 5: Maps
Pictorials
Create multi-layer, multi-series pictorial charts. Any SVG path can be used as a shape for your chart.
Sankey Diagrams
Stunning flow diagrams, in horizontal and vertical.
With draggable, fully configurable nodes.
Enhanced radar charts
With stacked column, bands, axes, and other dramatic enhancements, radar charts are now way more useful.
Treemaps
Completely zoomable, multi-level, highly configurable.
Heatmaps
Automatically build heat-maps, with custom axes, color ranges, and awesome new interactive Heat Legend.
Create heatmaps using colors, or point size or both.
Universal and flexible heat rules allow attaching any value in data to any property or properties on any element.
Chord diagrams
Visualize your 2-way relational data in a neat circular Chord diagrams.
We do have different variations of the classic diagram: Chord, Chord directed, and Chord non-ribbon.
True funnel charts
amCharts 5 offers true Funnel charts the way they were meant to be.
Slice’s area size represents the value, so each step’s influence on overall volume reduction is more prominent than with basic funnels.
Trapezoid form can also be configured to further emphasize reduction.
Complete it with other visual elements, like fully configurable slice lines, multiple series support, togglable legends, and many many more options.
Customizable beauty built-in
Powerful theme engine
amCharts 5 comes with a bunch of beautiful themes as well as a super flexible theme engine, which you can use.
We devised a CSS-like rule-based theme targeting system in themes. Using, creating, customizing themes or standalone rules has never been so easy. The new system allows applying defaults to elements based on their type, features, or position in a virtual element tree.
Fresh new look
Default looks designed to look fresh, like something out of tomorrow.
Carefully selected color schemes and default settings were specifically chosen to make the charts stand out.
Silk-smooth animations
Every setting – colors, positions, sizes, opacity, and many more – is animatable to ensure smooth transitions.
No choppy, stepped animations – everything is fluid, including zoom and toggling of series and other items.
Flexibility
Element templates
Most elements are created using templates: a collection of default settings, events, and adapters. Changing template automatically propagates changes to actual elements, making it easy to do batch updates.
Everything’s configurable
Numerous configuration options allow inventive uses, bordering on new chart types.
Angles, colors, positions, radii, a-n-y-t-h-i-n-g can be set to bend classic and new chart types exactly the way you need them.
Element states
Easily change how an element looks like under different circumstances, e.g. on some interaction, hover, click, or related to data (eg. column look if a value is down).
The engine will automatically apply the required properties as needed, animating between old and new values smoothly.
Create and apply custom states via the API.
Multi-type multi-axis support
Add any number of axes of any type.
Create overlaid comparison of different time scales.
Use any mix of dimensional values: numbers, dates, categories, or duration.
Adapters
“Adapters” functionality allows plugging in custom code to dynamically override just about any setting or data value.
Text formatting
All text labels – tooltips, axis labels, titles, etc. – now support rich text formatting options, like changing colors, font weight, or applying just about any styling option from the CSS arsenal.
In addition to formatting support, labels can now contain in-line placeholders for real data, with the ability to apply custom formatting to values.
Accessibility & Interactivity
Accessibility was riding shotgun when amCharts 5 was being developed. All interactive elements are TAB-selectable, with customizable roles, order, and screen-reader texts. Everything that can be moved by touch or mouse, can be moved by keyboard. Everything that can be clicked or toggled, can be interacted with with keyboard, too.
Touch support
Charts have been designed to work with touch devices out-of-the-box. They will work not only on phones or tablets, but also touch capable computers.
Under the hood
Built with TypeScript
Supports strong type and error checking in TypeScript applications.
Enjoy code completion, error checking and dynamic help popups in major IDEs.
Full support for TypeScript and ES6 modules.
100% for JavaScript
Can be fully used in any vanilla JavaScript application.
amCharts 5 does not use or rely on globals, external frameworks or 3rd party libraries.
Universal rendering engine
Can be used to build dynamic, interactive Canvas-based interfaces and applications.
Add various elements to the screen, make them interactive, with a few lines of code. Make them clickable, draggable, hoverable, using built-in interactivity functionality.
Our universal layout engine will place, size and arrange elements according to set rules.


 1552
1552


 被折叠的 条评论
为什么被折叠?
被折叠的 条评论
为什么被折叠?
 到【灌水乐园】发言


