


性能分析工具
软件的性能是软件质量的重要考察点,不论是在线服务程序还是离线程序,甚至是终端应用,性能都是用户体验的关键。这里说的性能重大的范畴来讲包括了性能和稳定性两个方面,我们在做软件测试的时候也是要重点测试版本的性能表现和稳定性的。对于软件测试过程中发现的性能问题,如何定位有很多的方法。基本的方法可能是开发者对代码进行review,或者是使用一些工具对代码进行性能分析。常见的性能分析tuning工具有哪些呢?下面两篇文章做了详细的总结:
- https://computing.llnl.gov/tutorials/performance_tools/#Considerations
- http://en.wikipedia.org/wiki/List_of_performance_analysis_tools
在我工作中主要是关于Linux C++程序代码的性能分析,gprof是可用于Linux C++代码性能profiling的工具之一,本文主要讲讲我对gprof的学习和使用过程。
Gprof的基本原理
gprof能够让你知道你的代码哪些地方是比较耗时的,哪些函数是被调用次数很多的,并且能够让你一目了然的看到函数与函数之间的调用关系。gprof是gcc/g++编译器支持的一种性能诊断工具。只要在编译时加上-pg选项,编译器就会在编译程序时在每个函数的开头加一个mcount函数调用,在每一个函数调用之前都会先调用这个mcount函数,在mcount中会保存函数的调用关系图和函数的调用时间和被调次数等信息。最终在程序退出时保存在gmon.out文件中,需要注意的是程序必须是正常退出或者通过exit调用退出,因为只要在exit()被调用时才会触发程序写gmon.out文件。
那么,gprof的使用方法主要以下三步:
- 会用-pg参数编译程序
- 运行程序,并正常退出
- 查看gmon.out文件
Gprof使用实例
- #include<iostream>
- using namespace std;
- int add(int a, int b)
- {
- return a+b;
- }
- int sub(int a, int b)
- {
- return a-b;
- }
- int call ()
- {
- std::cout << add(1,2) << std::endl;
- std::cout << sub(2,4) << std::endl;
- }
- int main()
- {
- int a=1, b=2;
- cout << add(a,b) << endl;
- for (int i=0; i<10000; i++)
- call();
- return 0;
- }
使用g++编译并加上-pg参数:
- g++ -o hello hello_grof.cpp -pg -g
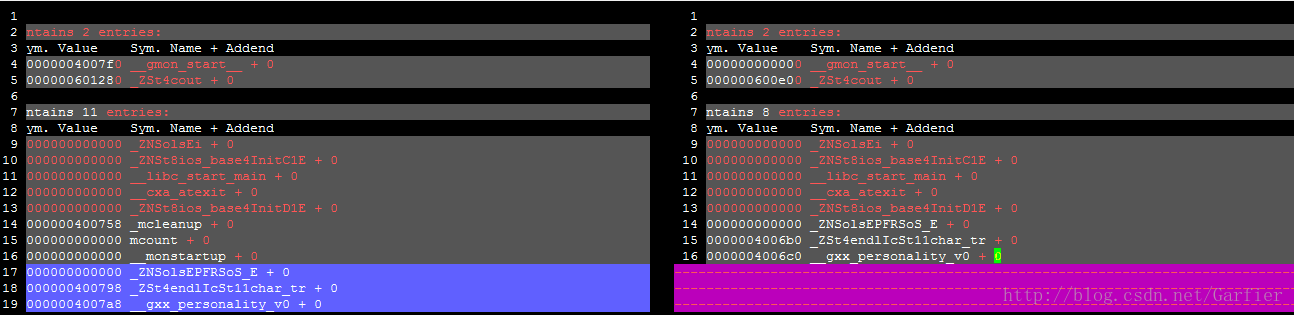
得到可执行文件,我们可以使用readelf查看一下它的符号表里和没有-pg时编译的有啥不同:readelf -r ./hello和readelf -r ./hello_normal得出的结果对比。
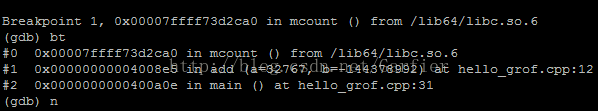
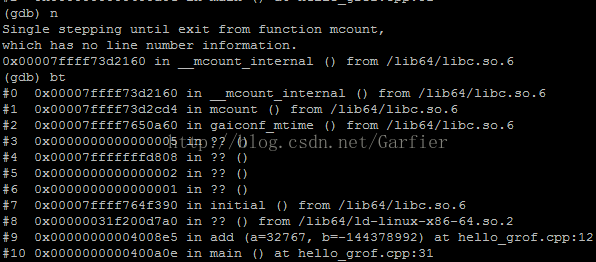
使用gdb调试hello程序,在mcount函数中打断点也可以看到其调用关系,在add函数执行前先调用mcount函数:
接下来运行程序./hello,会在当前目录下生成gmon.out文件。使用gprof查看文件信息:
- gprof -b ./hello gmon.out
- Flat profile:
- Each sample counts as 0.01 seconds.
- no time accumulated
- % cumulative self self total
- time seconds seconds calls Ts/call Ts/call name
- 0.00 0.00 0.00 10001 0.00 0.00 add(int, int)
- 0.00 0.00 0.00 10000 0.00 0.00 sub(int, int)
- 0.00 0.00 0.00 10000 0.00 0.00 call()
- 0.00 0.00 0.00 1 0.00 0.00 global constructors keyed to _Z3addii
- 0.00 0.00 0.00 1 0.00 0.00 __static_initialization_and_destruction_0(int, int)
- Call graph
- granularity: each sample hit covers 2 byte(s) no time propagated
- index % time self children called name
- 0.00 0.00 1/10001 main [7]
- 0.00 0.00 10000/10001 call() [10]
- [8] 0.0 0.00 0.00 10001 add(int, int) [8]
- -----------------------------------------------
- 0.00 0.00 10000/10000 call() [10]
- [9] 0.0 0.00 0.00 10000 sub(int, int) [9]
- -----------------------------------------------
- 0.00 0.00 10000/10000 main [7]
- [10] 0.0 0.00 0.00 10000 call() [10]
- 0.00 0.00 10000/10001 add(int, int) [8]
- 0.00 0.00 10000/10000 sub(int, int) [9]
- -----------------------------------------------
- 0.00 0.00 1/1 __do_global_ctors_aux [13]
- [11] 0.0 0.00 0.00 1 global constructors keyed to _Z3addii [11]
- 0.00 0.00 1/1 __static_initialization_and_destruction_0(int, int) [12]
- -----------------------------------------------
- 0.00 0.00 1/1 global constructors keyed to _Z3addii [11]
- [12] 0.0 0.00 0.00 1 __static_initialization_and_destruction_0(int, int) [12]
- -----------------------------------------------
- Index by function name
- [11] global constructors keyed to _Z3addii (hello_grof.cpp) [9] sub(int, int) [10] call()
- [8] add(int, int) [12] __static_initialization_and_destruction_0(int, int) (hello_grof.cpp)
可以使用运行命令:
- gprof -b ./hello gmon.out | gprof2doc.py > ~WWW/hello.dot
生成dot格式的调用关系图文件,可以使用windows版的GVEdit for Graphviz软件查看调用关系图:
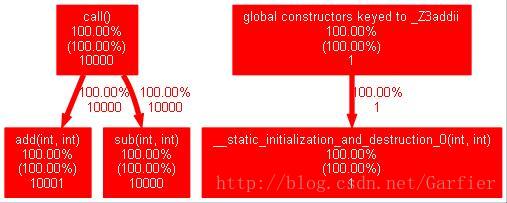
附上一张比较复杂的程序调用关系图:
对于调用的关系和调用热点一目了然。
Gprof输出解读
这部分内容可将gprof -b ./hello中的-b参数去掉,可以显示字段的详细含义描述:
- 14 % the percentage of the total running time of the
- 15 time program used by this function.
- 16
- 17 cumulative a running sum of the number of seconds accounted
- 18 seconds for by this function and those listed above it.
- 19
- 20 self the number of seconds accounted for by this
- 21 seconds function alone. This is the major sort for this
- 22 listing.
- 23
- 24 calls the number of times this function was invoked, if
- 25 this function is profiled, else blank.
- 26
- 27 self the average number of milliseconds spent in this
- 28 ms/call function per call, if this function is profiled,
- 29 else blank.
- 30
- 31 total the average number of milliseconds spent in this
- 32 ms/call function and its descendents per call, if this
- 33 function is profiled, else blank.
- 34
- 35 name the name of the function. This is the minor sort
- 36 for this listing. The index shows the location of
- 37 the function in the gprof listing. If the index is
- 38 in parenthesis it shows where it would appear in
- 39 the gprof listing if it were to be printed.
总结
gprof是常见的性能分析工具,在此罗列一下它的一些不足,也是从网上看的:
- 1、对多线程支持不好,不准确
- 2、必须退出exit()才行
- 3、它只能分析应用程序在运行过程中所消耗掉的用户时间,无法得到程序内核空间的运行时间。对内核态的调用分析无能为力。如果程序系统调用比率比较大,就不适合。
转自:http://blog.csdn.net/garfier/article/details/12489953


 1220
1220

 被折叠的 条评论
为什么被折叠?
被折叠的 条评论
为什么被折叠?
 到【灌水乐园】发言


