


zabbix监控配置及邮箱告警
zabbix监控指标
系统 (CPU 内存 硬盘)
网络 (网卡 网口)
业务 (进程 端口号 日志)
硬件 (电源个数 CUP温度 硬盘温度 )
zabbix监控配置流程
1.添加主机或主机组
2.添加监控项
- 使用模板
- 自定义模板
- 手动加监控项
3.添加触发器
4.添加媒介
5.为用户选择要使用的媒介
6.添加动作
7.手动触发并验证
zabbix监控配置流程详解
指标的概念;提供,获取到他要监控内容的值
zabbix监控项配置
准备工作
客户端配置
//开启服务端机的所有软件
[root@zabbix_server ~]# ss -antl
State    Recv-Q   Send-Q       Local Address:Port        Peer Address:Port
LISTEN   0        32           192.168.122.1:53               0.0.0.0:*
LISTEN   0        128                0.0.0.0:22               0.0.0.0:*
LISTEN   0        5                127.0.0.1:631              0.0.0.0:*
LISTEN   0        128                0.0.0.0:10050            0.0.0.0:*
LISTEN   0        128                0.0.0.0:10051            0.0.0.0:*
LISTEN   0        128              127.0.0.1:9000             0.0.0.0:*
LISTEN   0        128                0.0.0.0:111              0.0.0.0:*
LISTEN   0        128                   [::]:22                  [::]:*
LISTEN   0        5                    [::1]:631                 [::]:*
LISTEN   0        80                       *:3306                   *:*
LISTEN   0        128                   [::]:111                 [::]:*
LISTEN   0        128                      *:80                     *:*

//在客户端配置
[root@localhost ~]# ls
公共  图片  音乐             fhdsfds     initial-setup-ks.cfg
模板  文档  桌面             httpd       pass
视频  下载  anaconda-ks.cfg  index.html  zabbix-5.0.25.tar.gz
[root@localhost ~]# tar xf zabbix-5.0.25.tar.gz
[root@localhost ~]# useradd -r -M -s /sbin/nologin zabbix
[root@localhost ~]# cd zabbix-5.0.25/
[root@localhost zabbix-5.0.25]# ls
aclocal.m4  compile       configure.ac  INSTALL      man      sass
AUTHORS     conf          COPYING       install-sh   misc     src
bin         config.guess  database      m4           missing  ui
build       config.sub    depcomp       Makefile.am  NEWS
ChangeLog   configure     include       Makefile.in  README
[root@localhost zabbix-5.0.25]# dnf -y install gcc gcc-c++ vim wget make
[root@localhost zabbix-5.0.25]# dnf -y install pcre-devel   //安装一个依赖包
[root@localhost zabbix-5.0.25]# ./configure --enable-agent  //客户端编译
[root@localhost zabbix-5.0.25]# make install
[root@localhost ~]# cd /usr/local/etc/
[root@localhost etc]# ls
zabbix_agentd.conf  zabbix_agentd.conf.d
[root@localhost etc]# systemctl disable --now firewalld
[root@localhost etc]# setenforce 0
setenforce: SELinux is disabled
[root@localhost etc]# vim zabbix_agentd.conf

# Default:
# Server=

Server=192.168.70.134   //改成服务端IP

### Option: ListenPort

# ServerActive=

ServerActive=192.168.70.134    //改成服务端IP

### Option: Hostname

# Hostname=

Hostname=jjyy       //要唯一,想改什么都行 ,我取的jjyy

### Option: HostnameItem
[root@localhost etc]# zabbix_agentd  //启动服务
[root@localhost etc]# ss -antl
State    Recv-Q   Send-Q       Local Address:Port        Peer Address:Port
LISTEN   0        128                0.0.0.0:111              0.0.0.0:*
LISTEN   0        32           192.168.122.1:53               0.0.0.0:*
LISTEN   0        128                0.0.0.0:22               0.0.0.0:*
LISTEN   0        5                127.0.0.1:631              0.0.0.0:*
LISTEN   0        128                0.0.0.0:10050            0.0.0.0:*
服务端配置
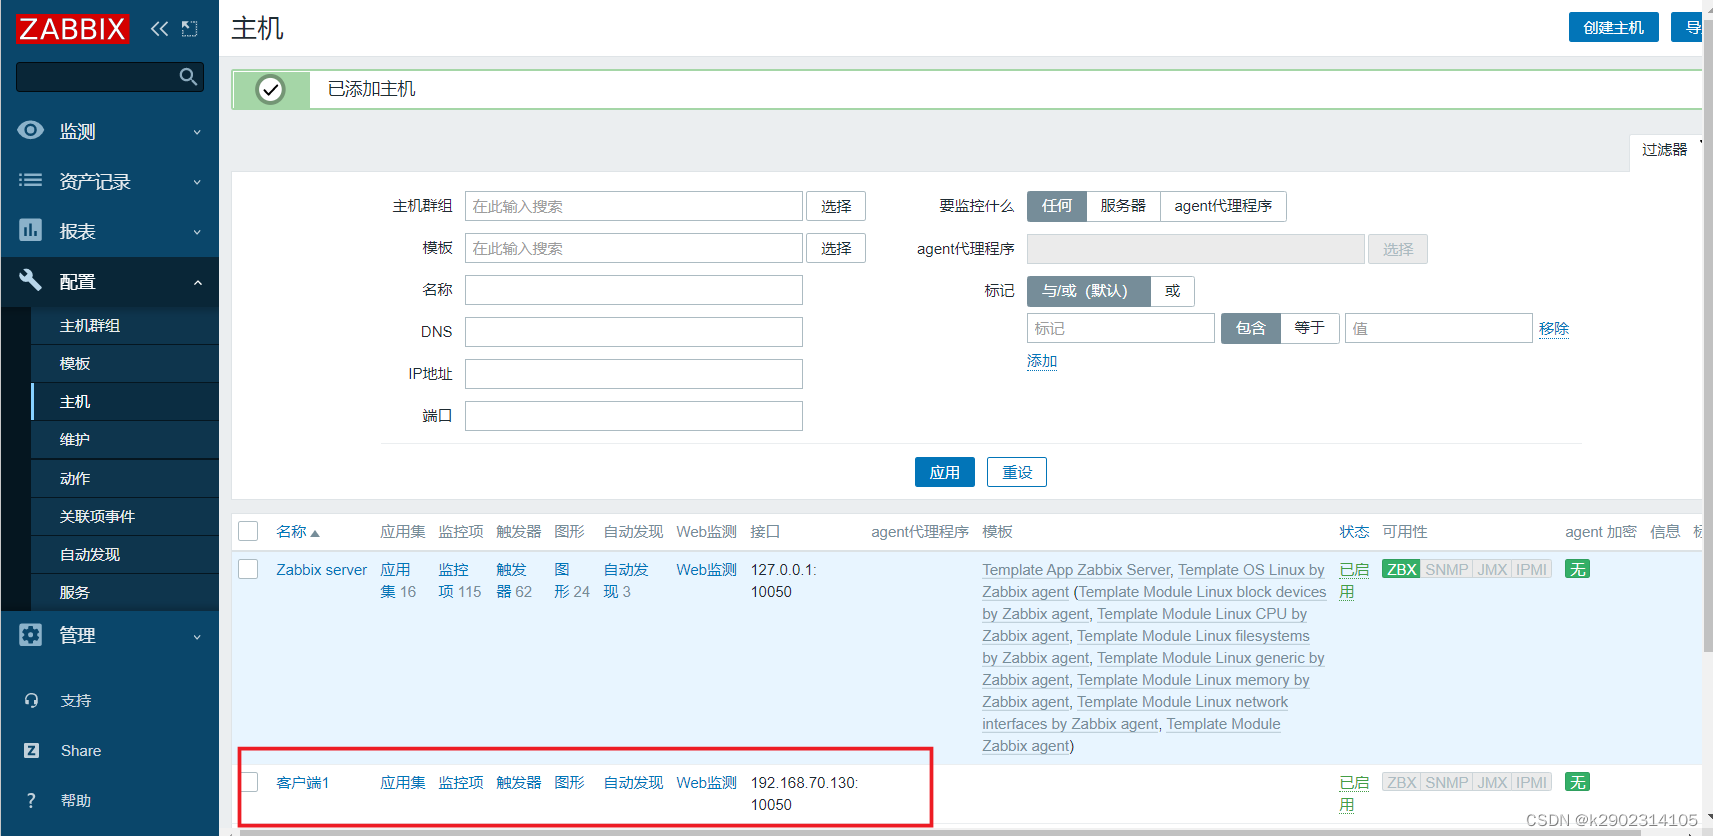
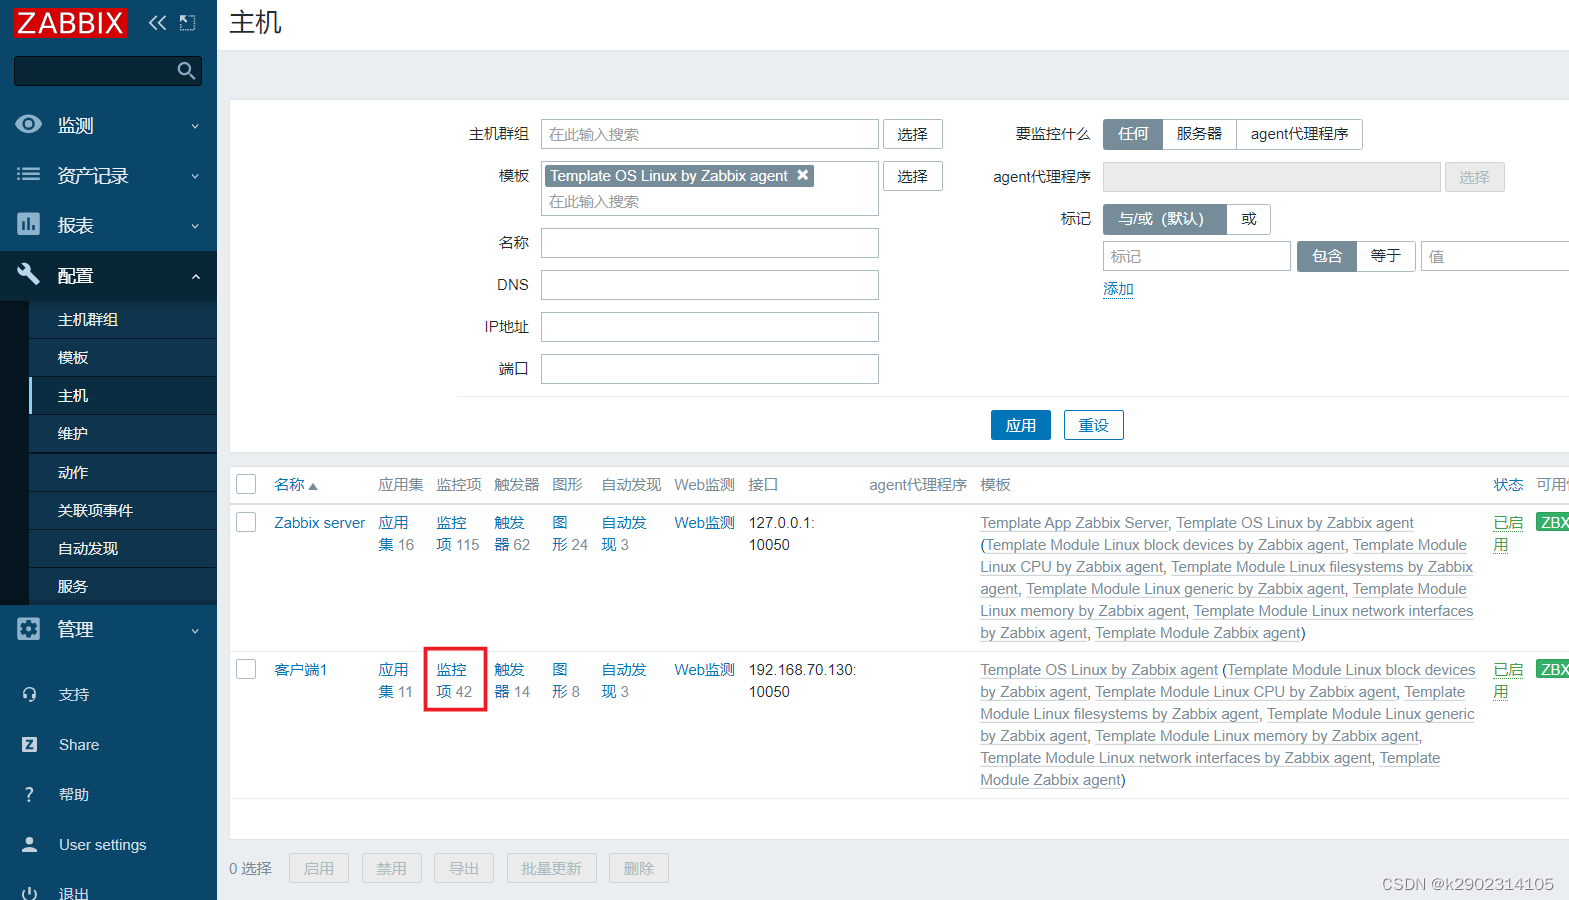
1.添加主机
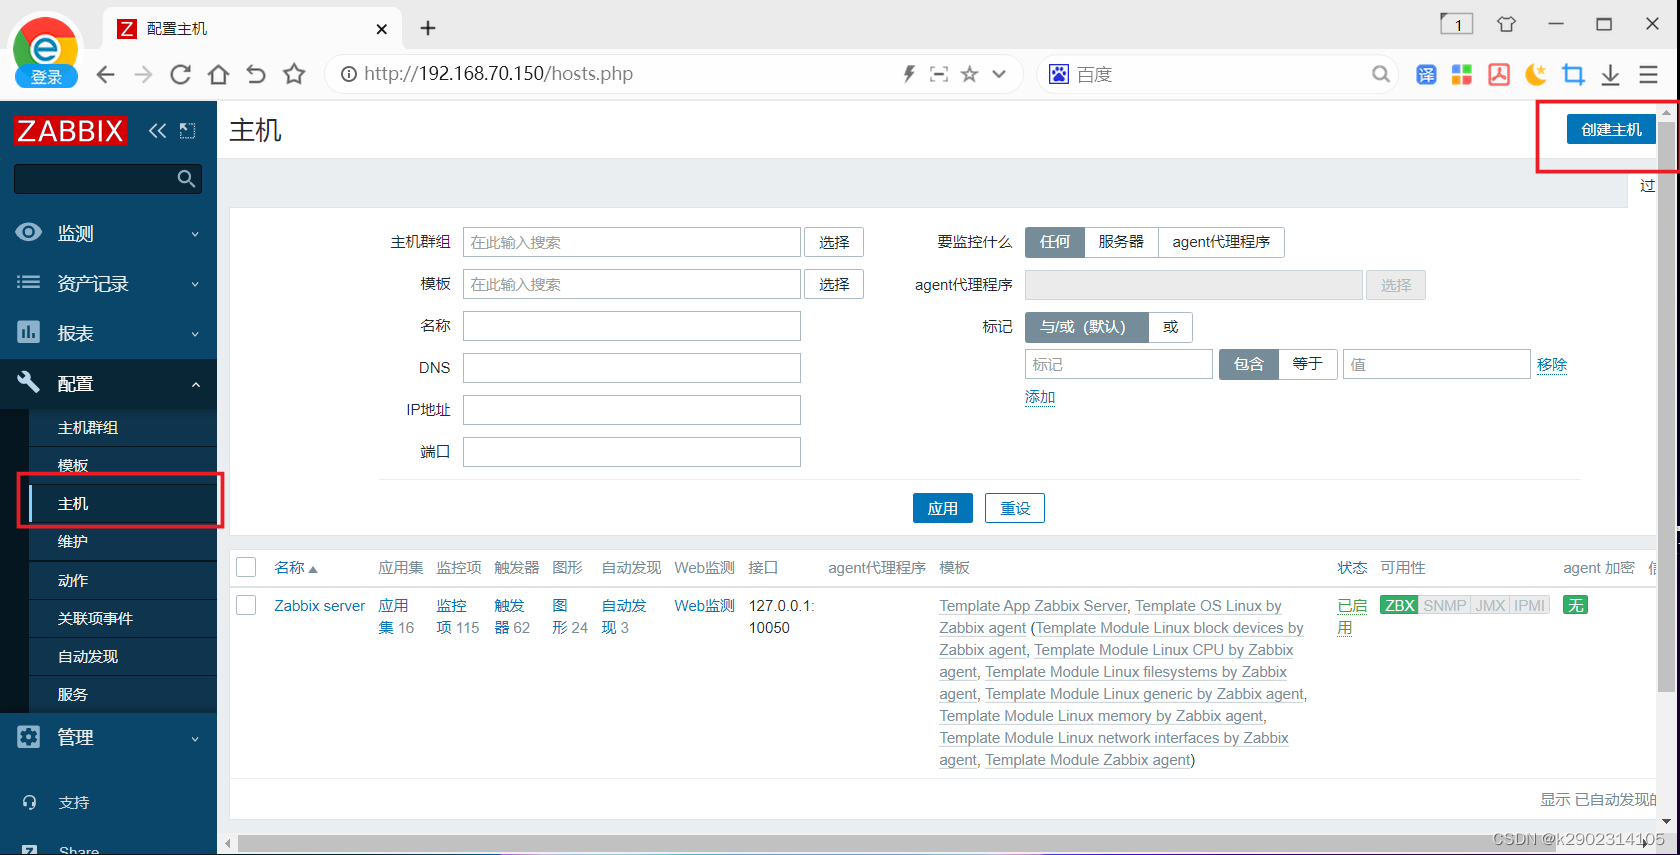

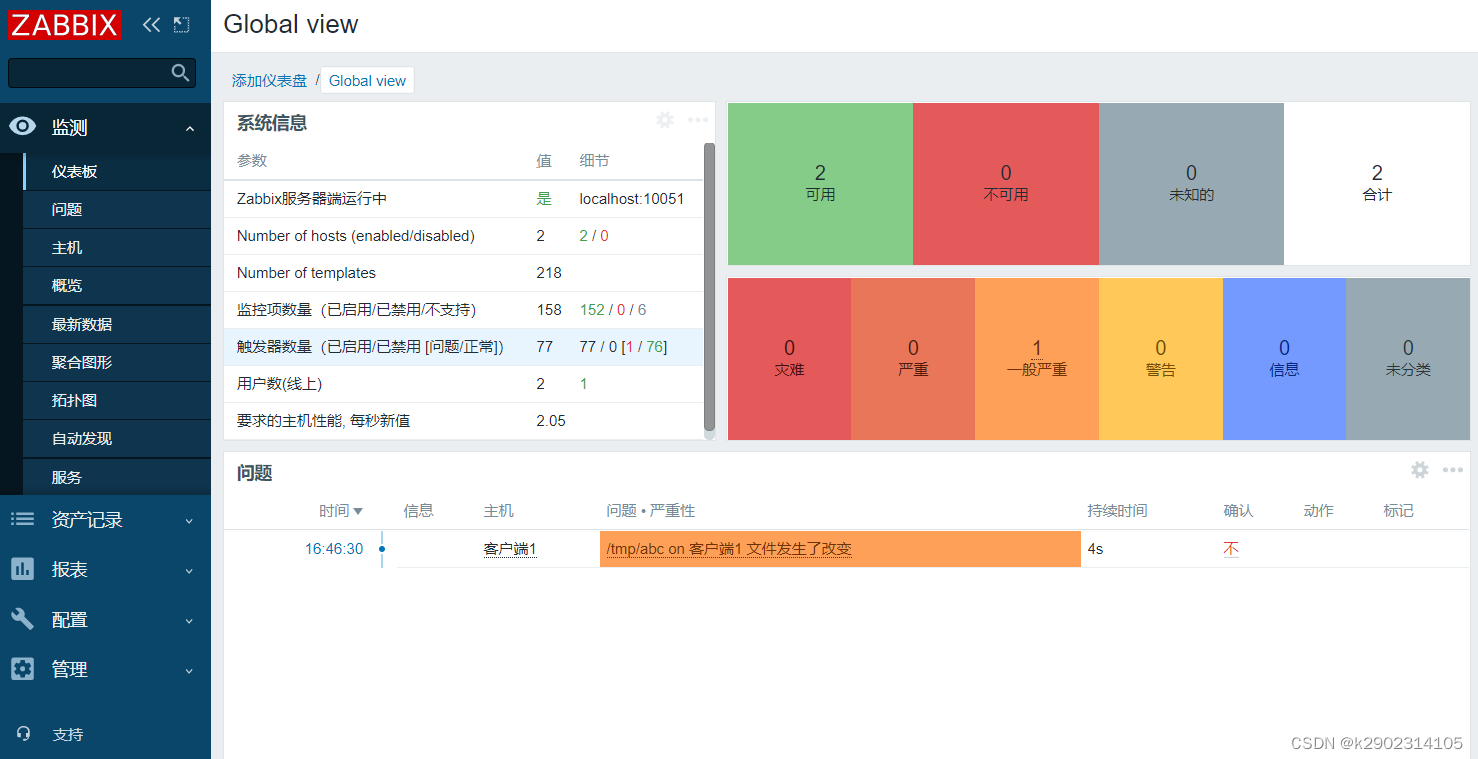
效果图
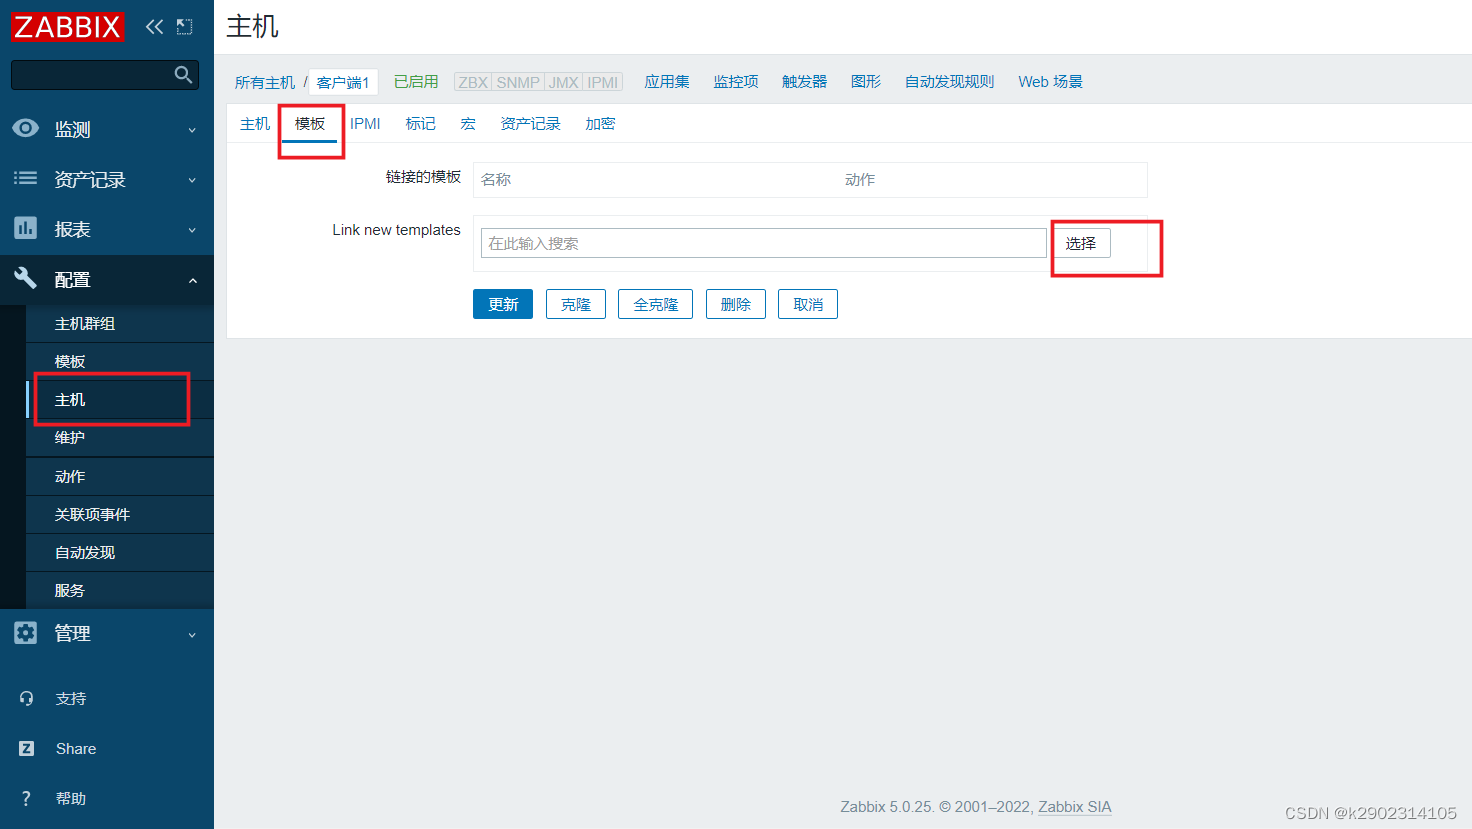
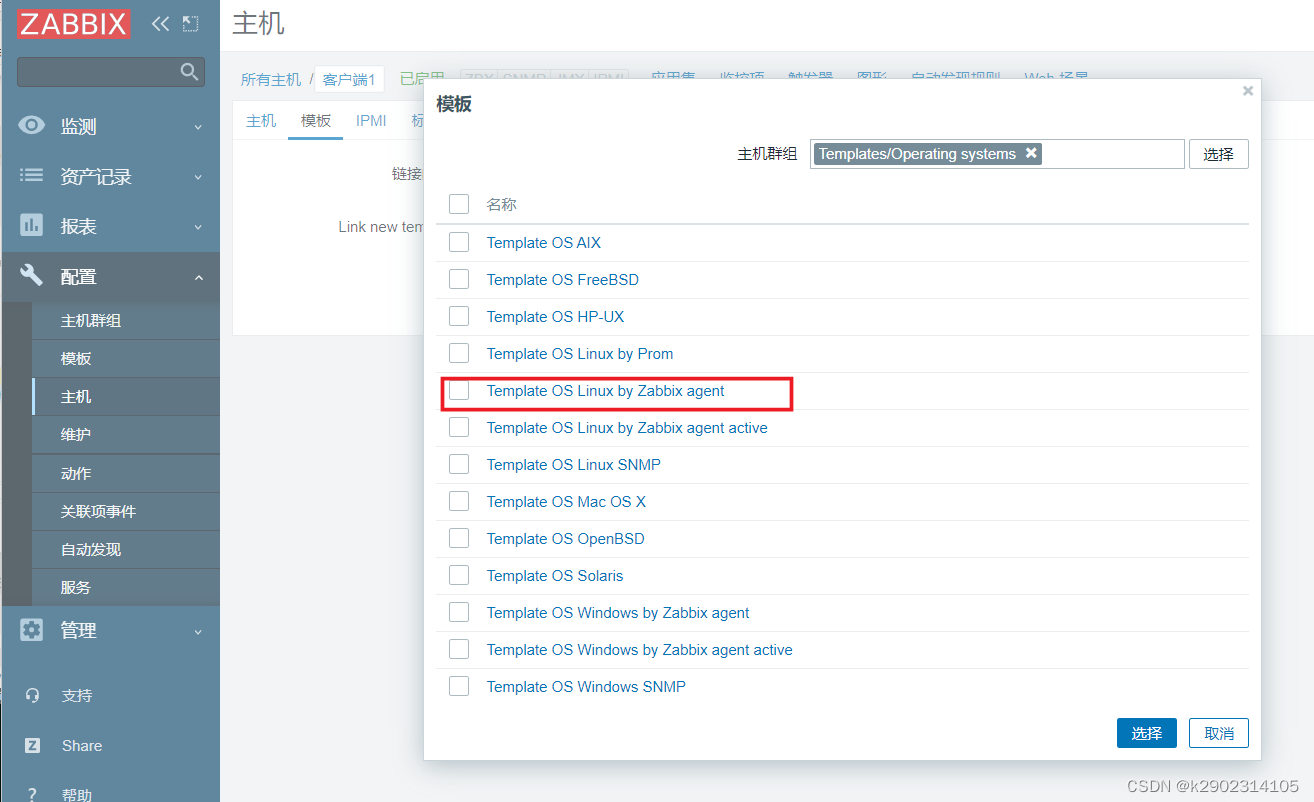
2.添加监控项
使用模板添加

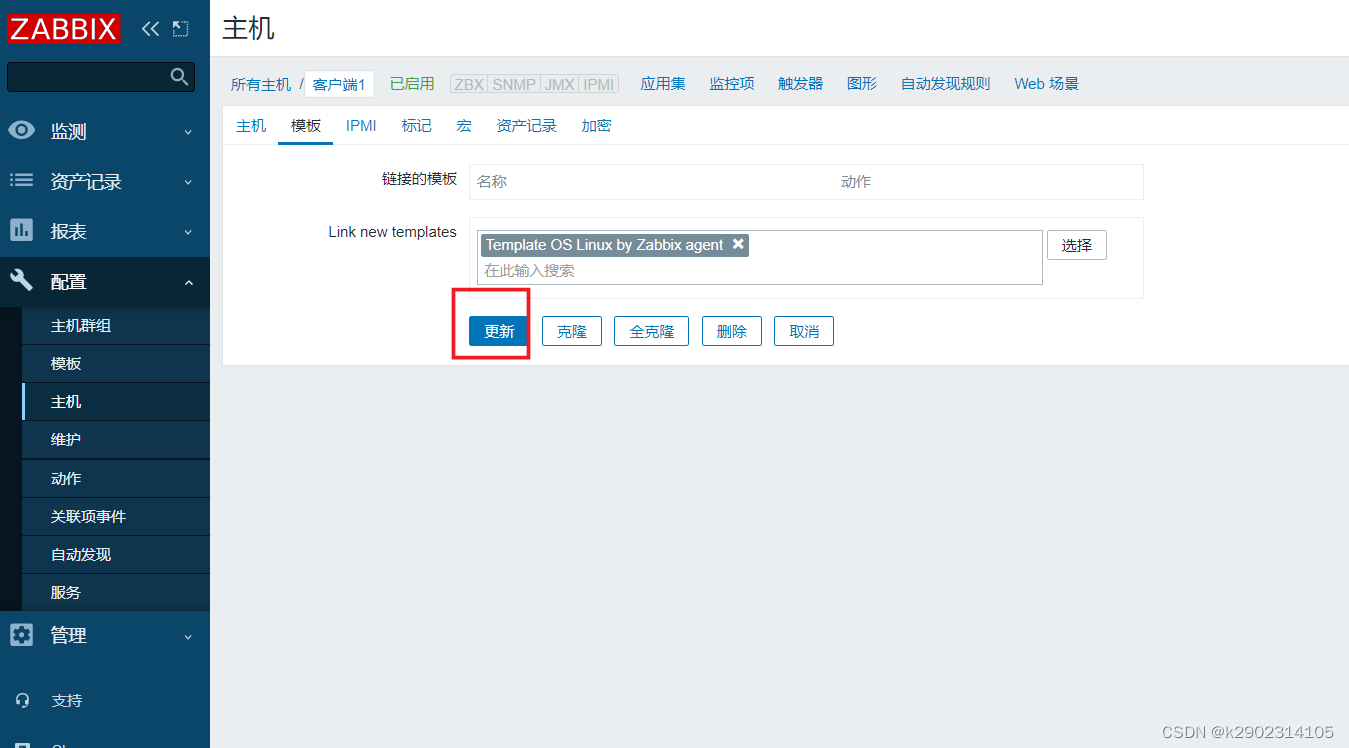
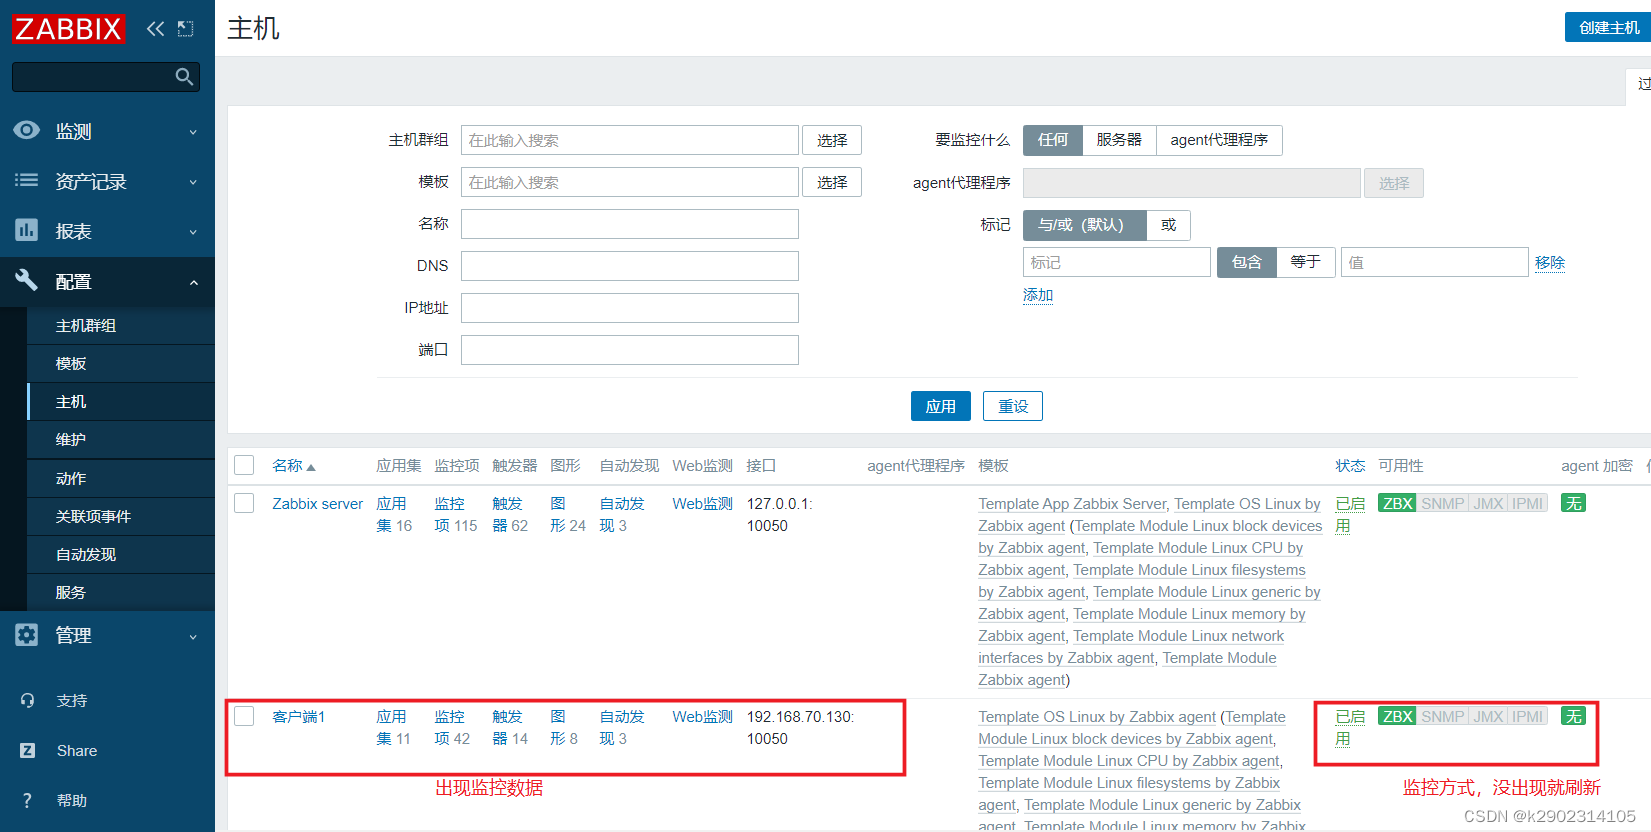
添加模板后查看监控 的zbx变成绿色就是成功了
若是为变成绿色需要等待一段时间然后刷新页面
zabbix如何查看key

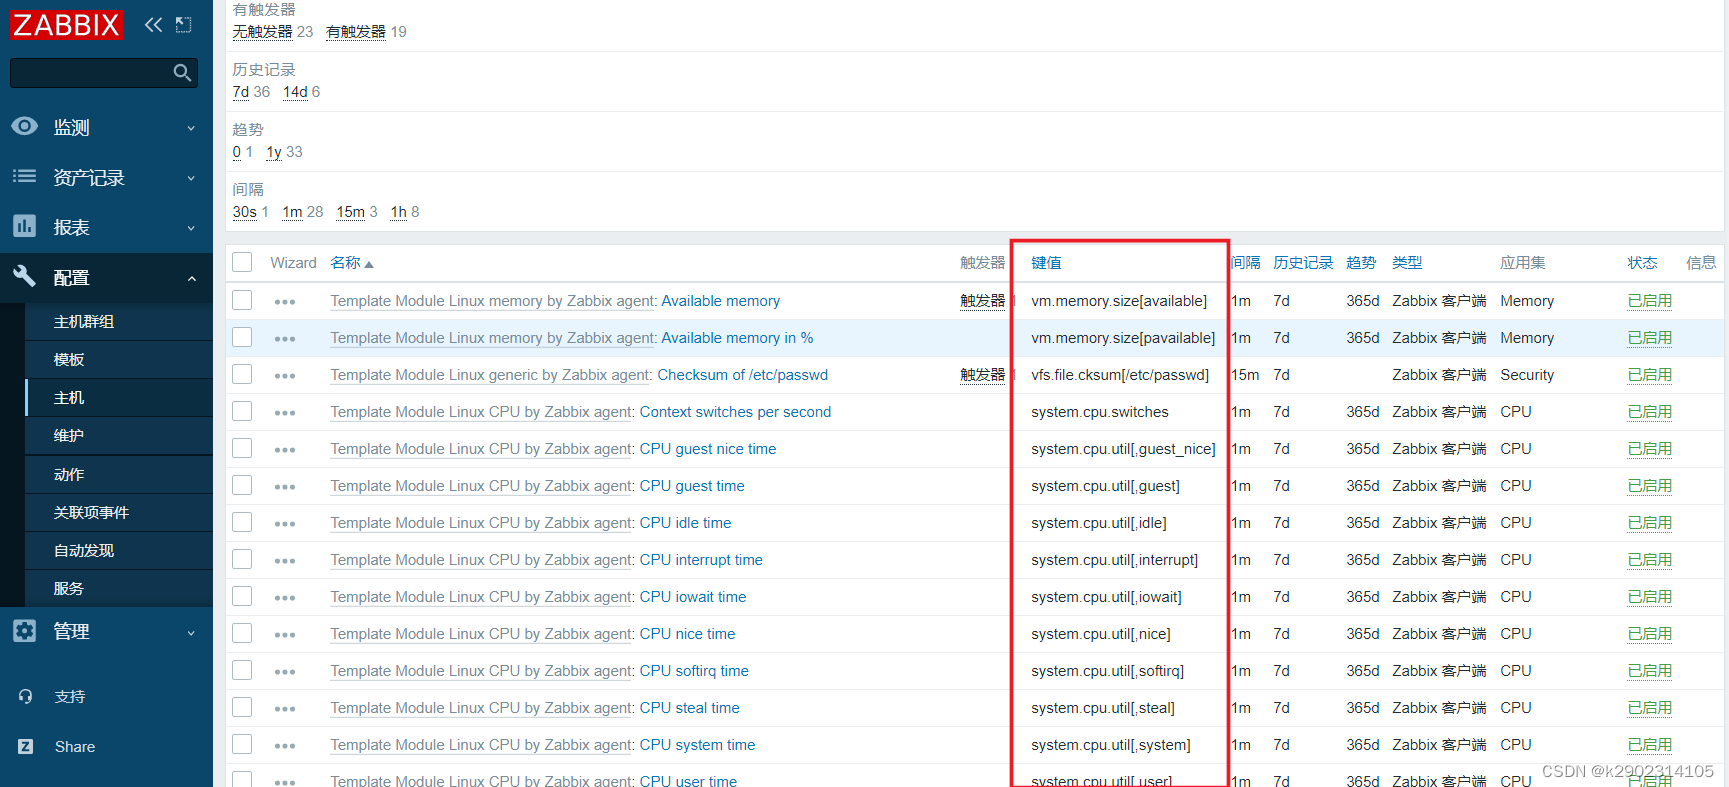
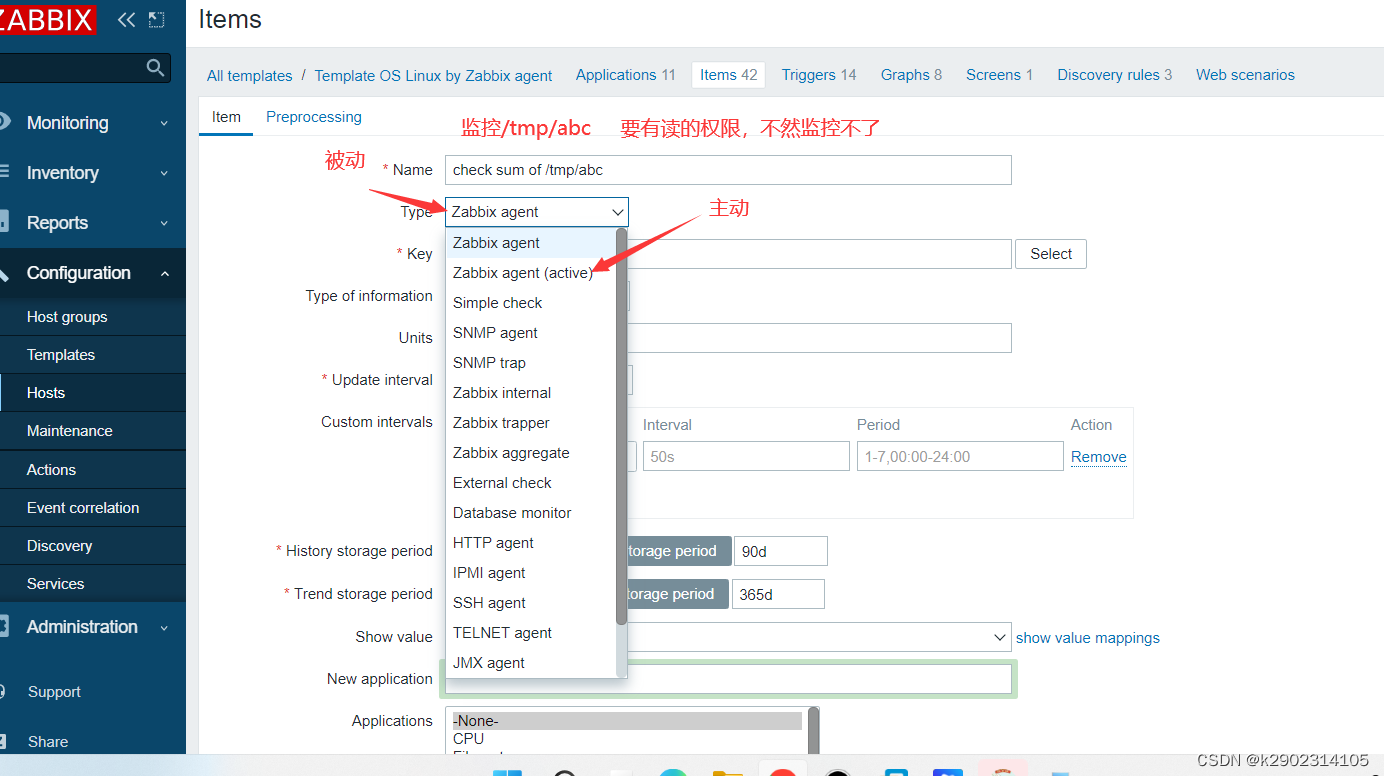
自定义模板

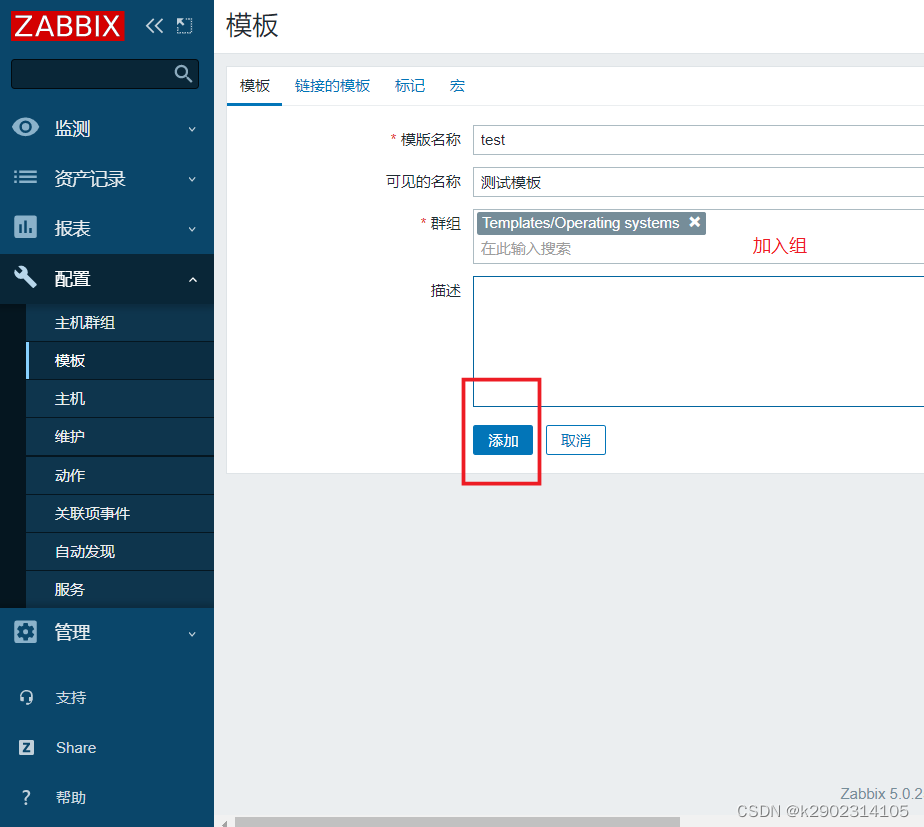
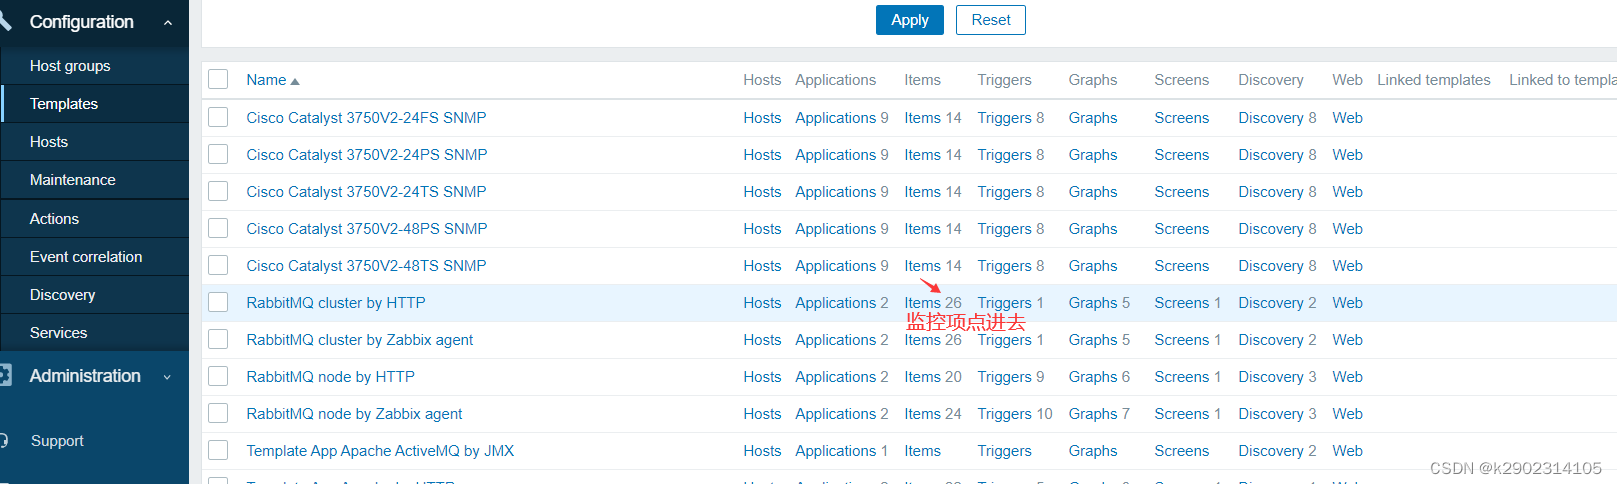
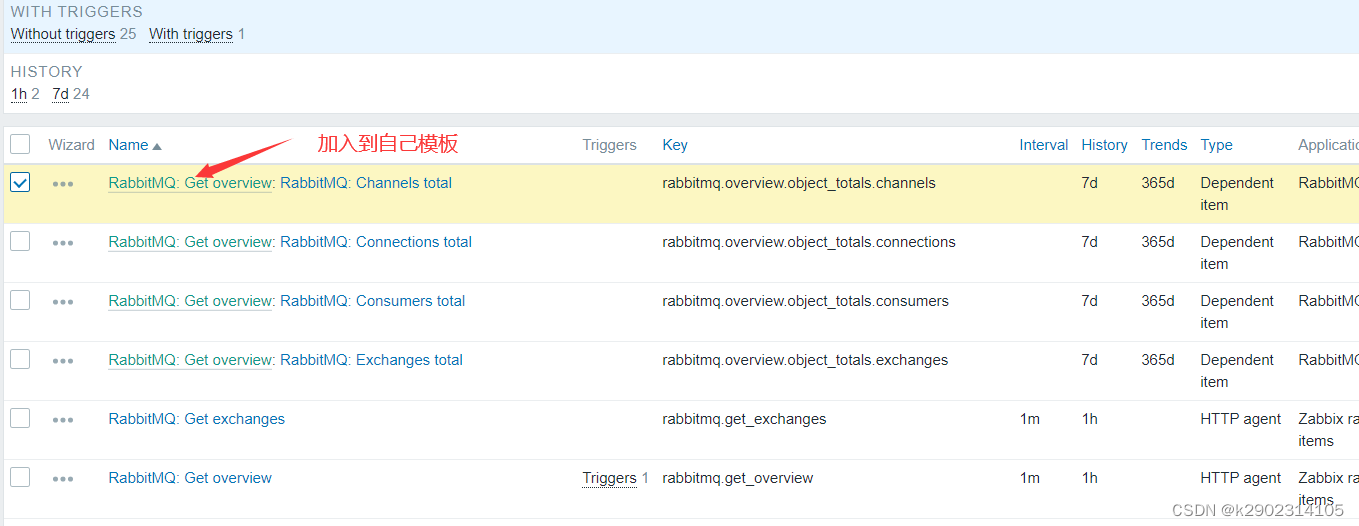
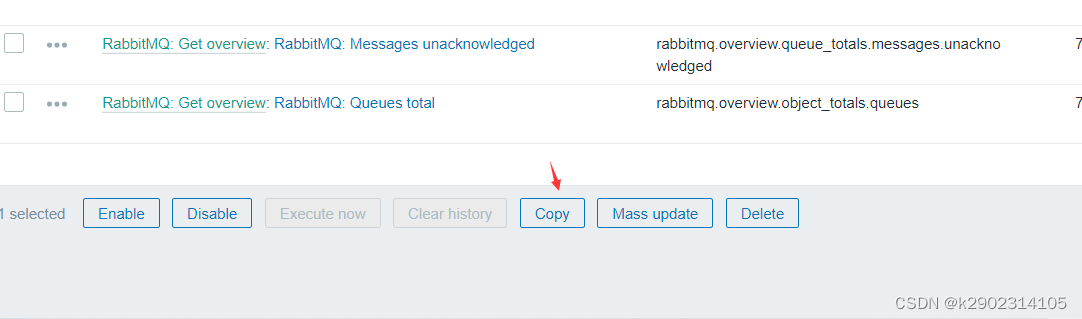
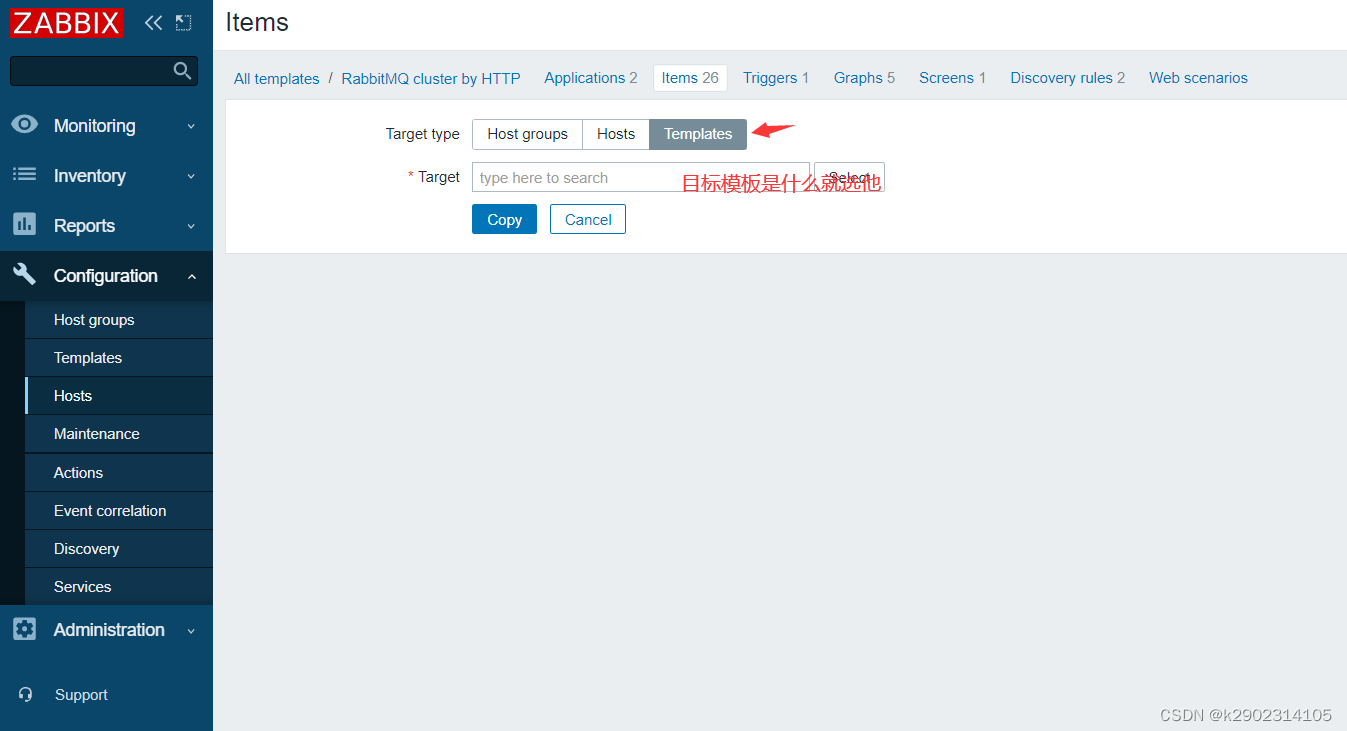
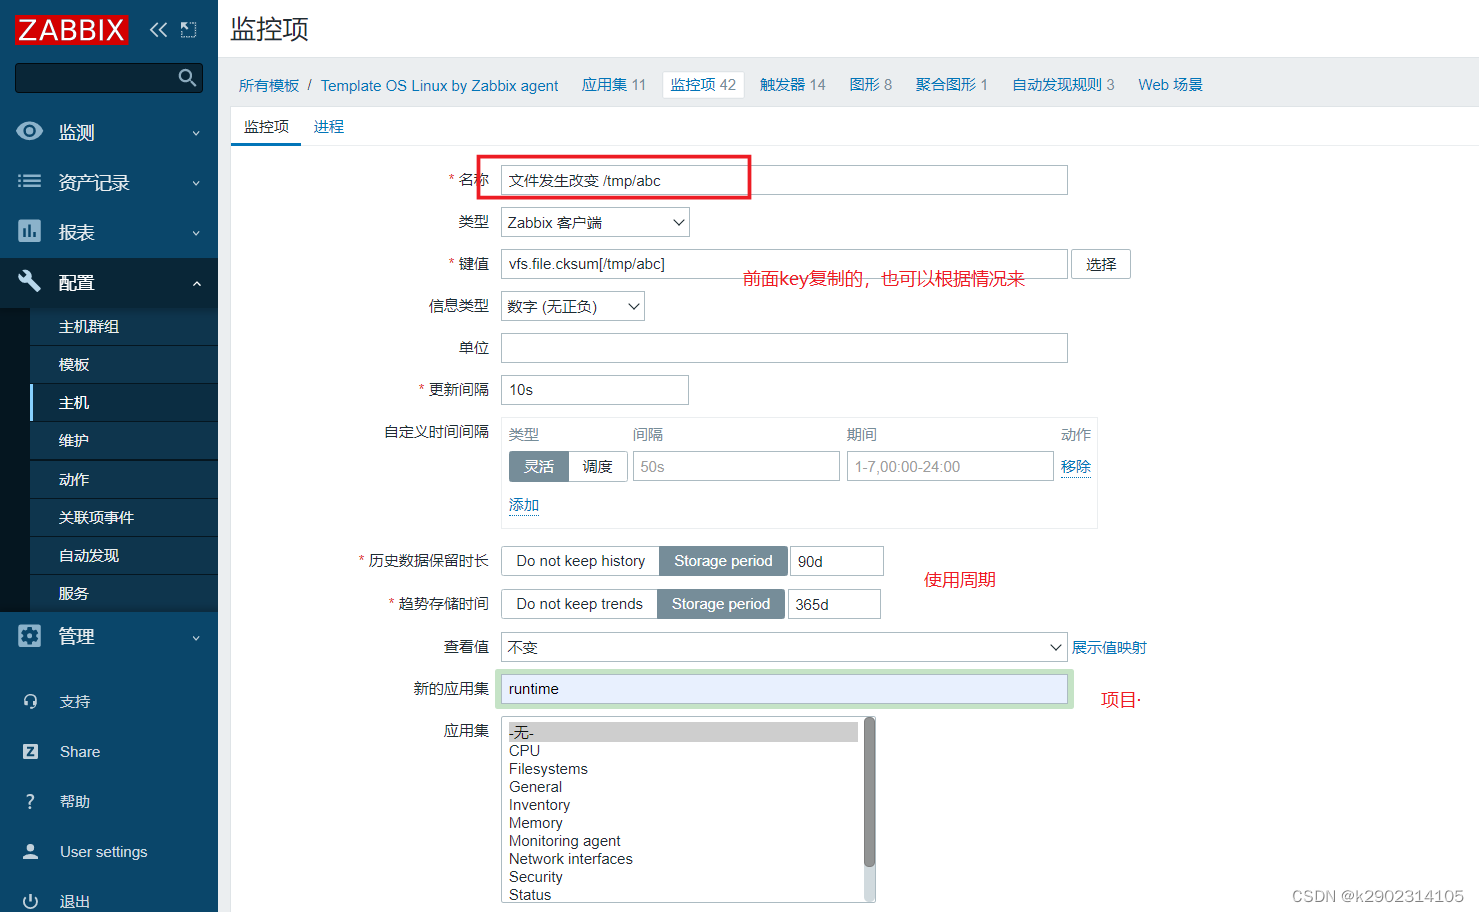
添加监控项
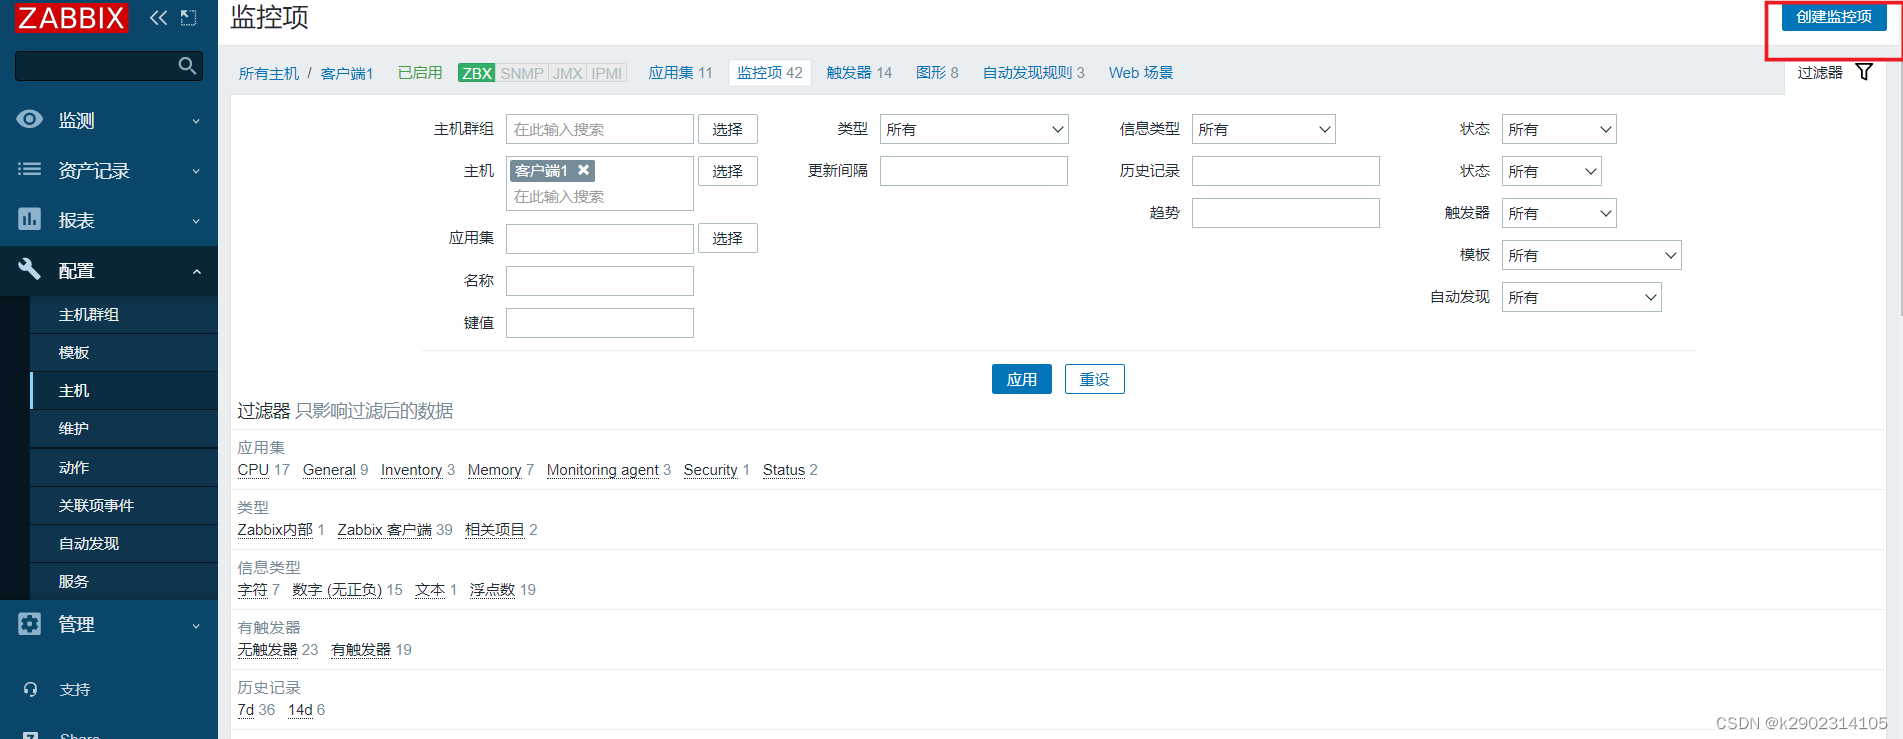
项目就是监控类型
键值是算法

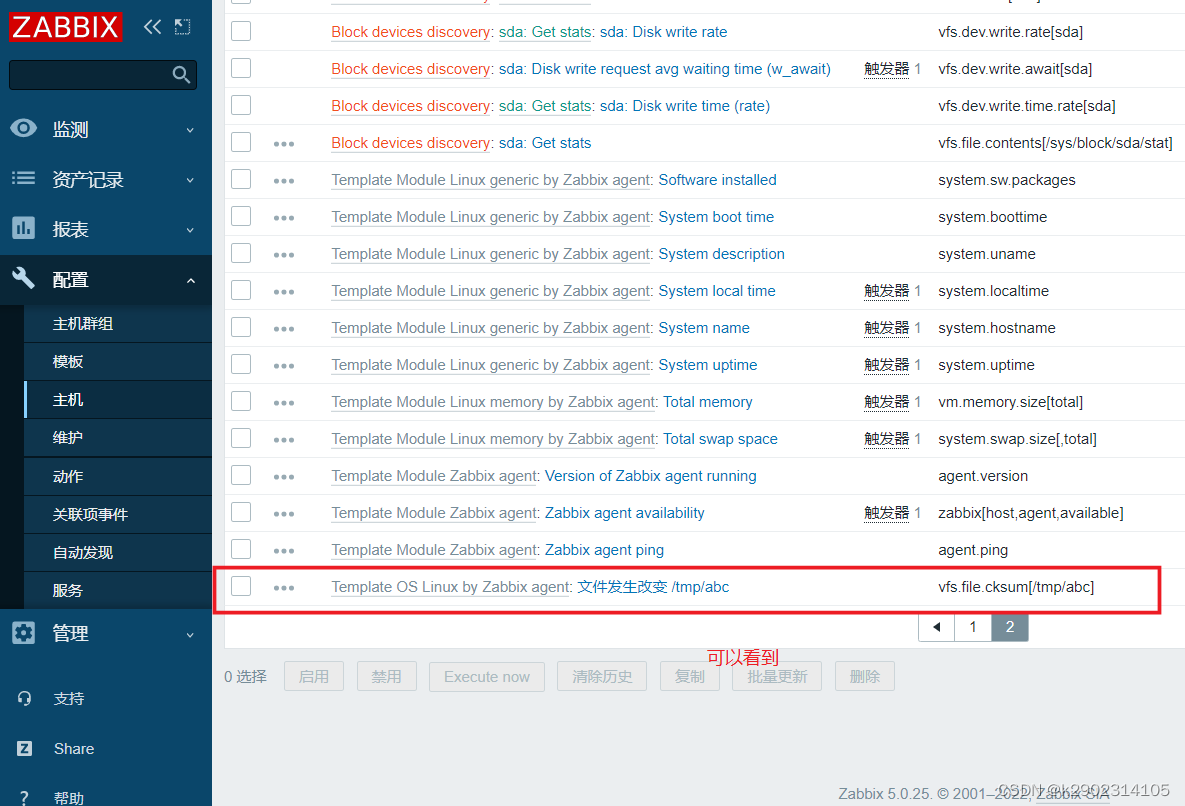
设置监控项成功
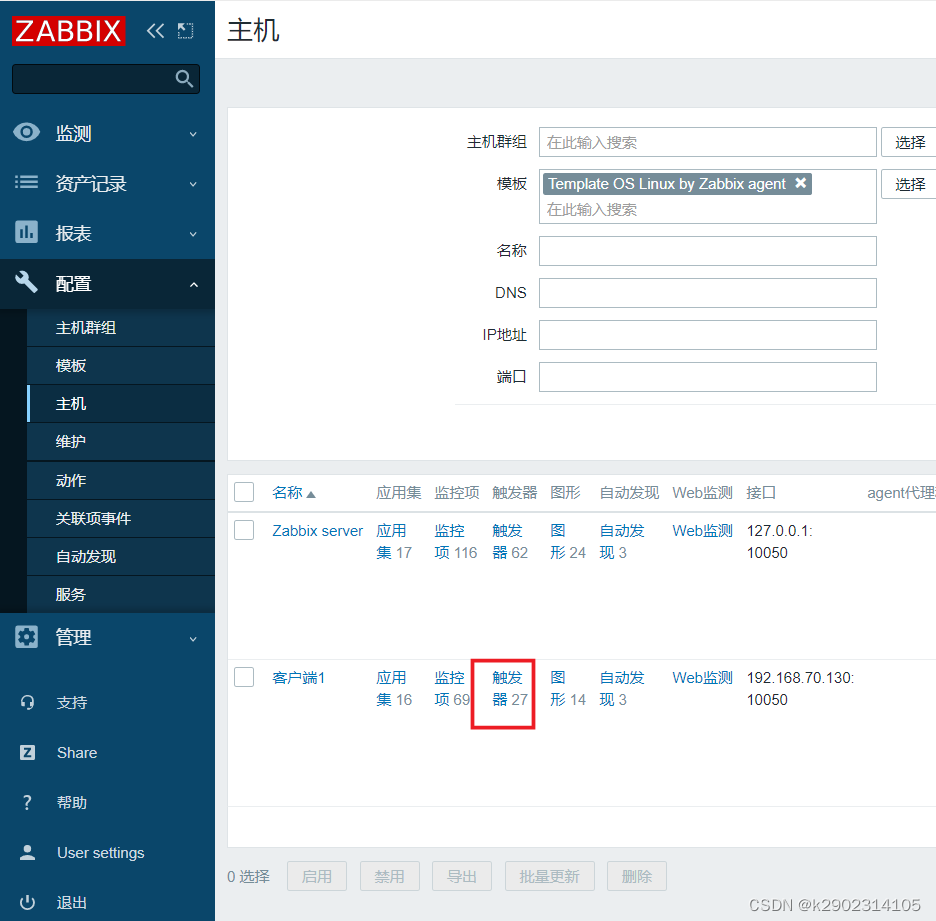
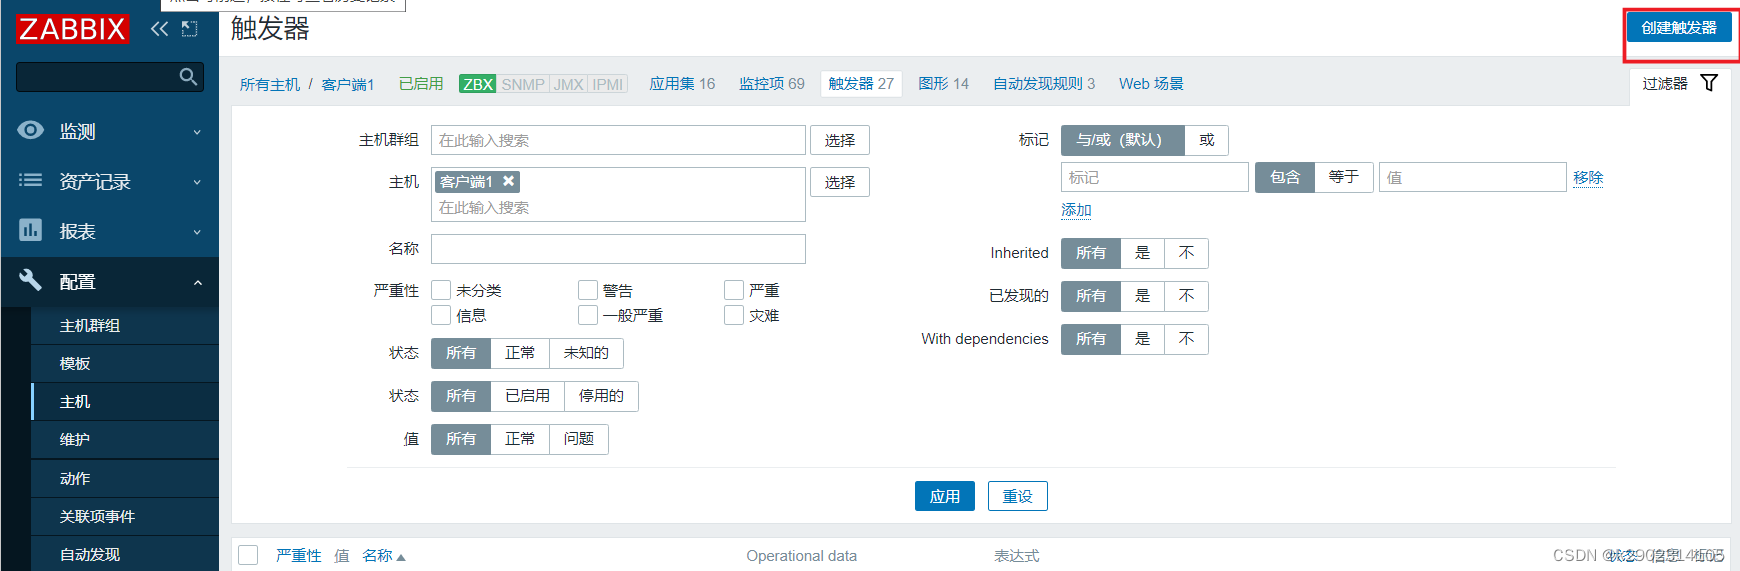
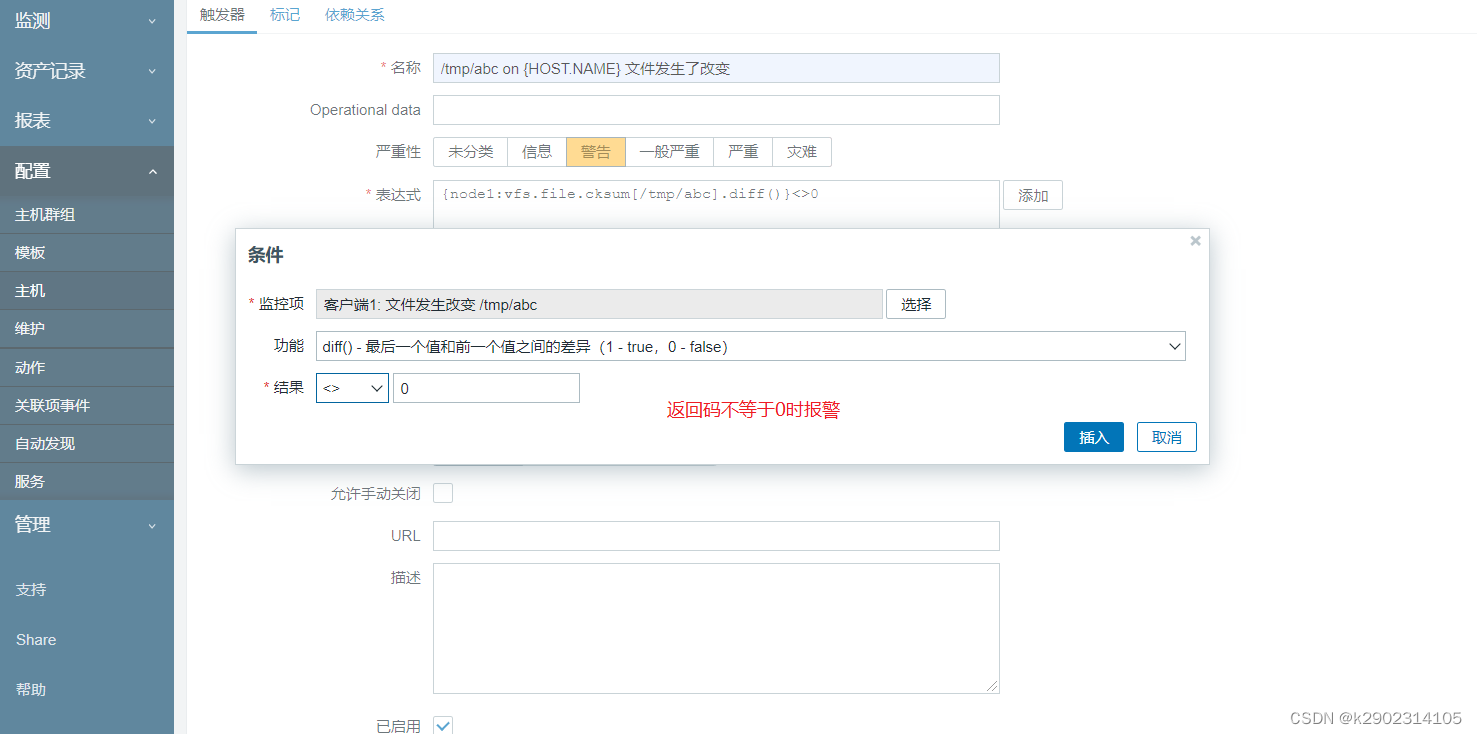
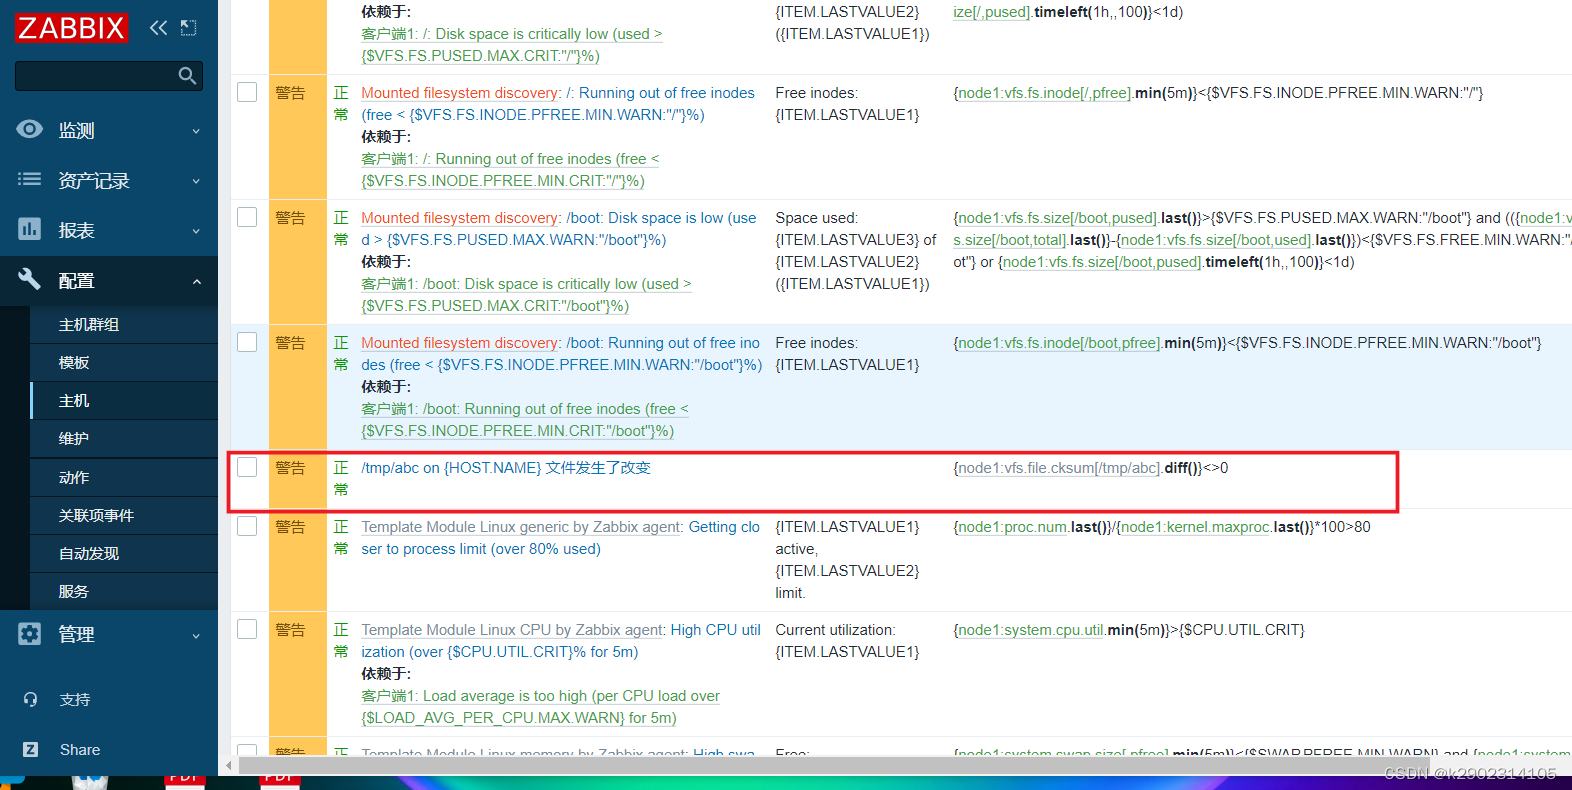
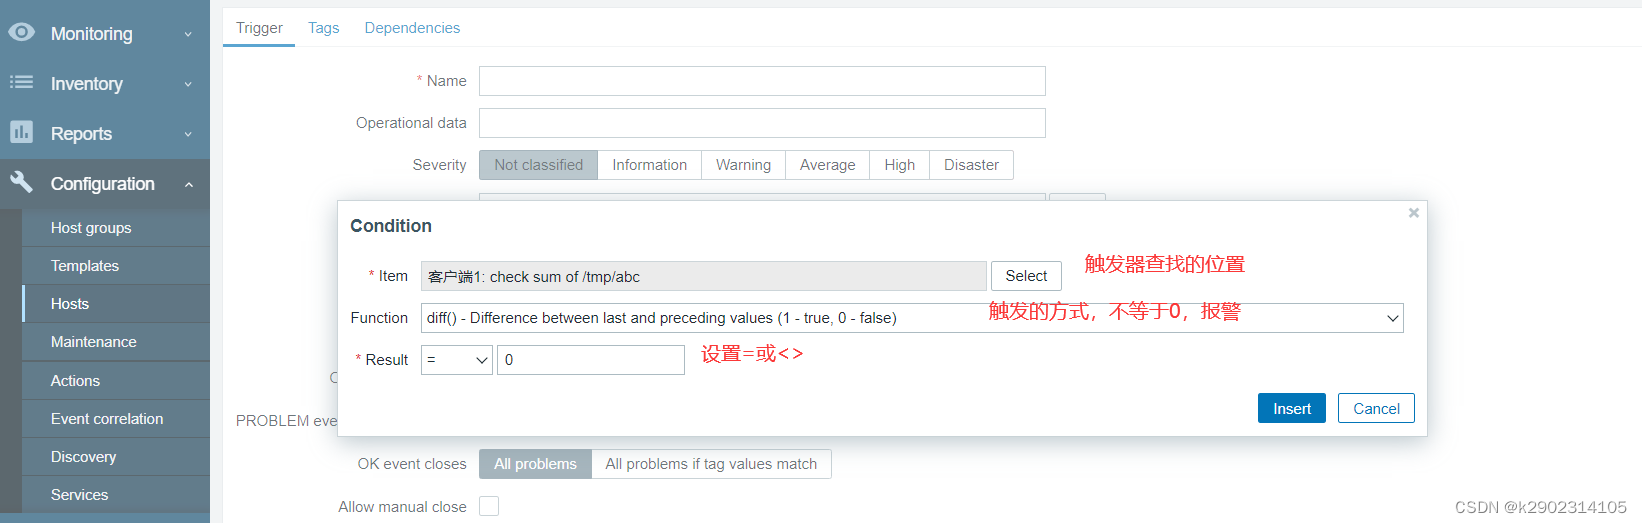
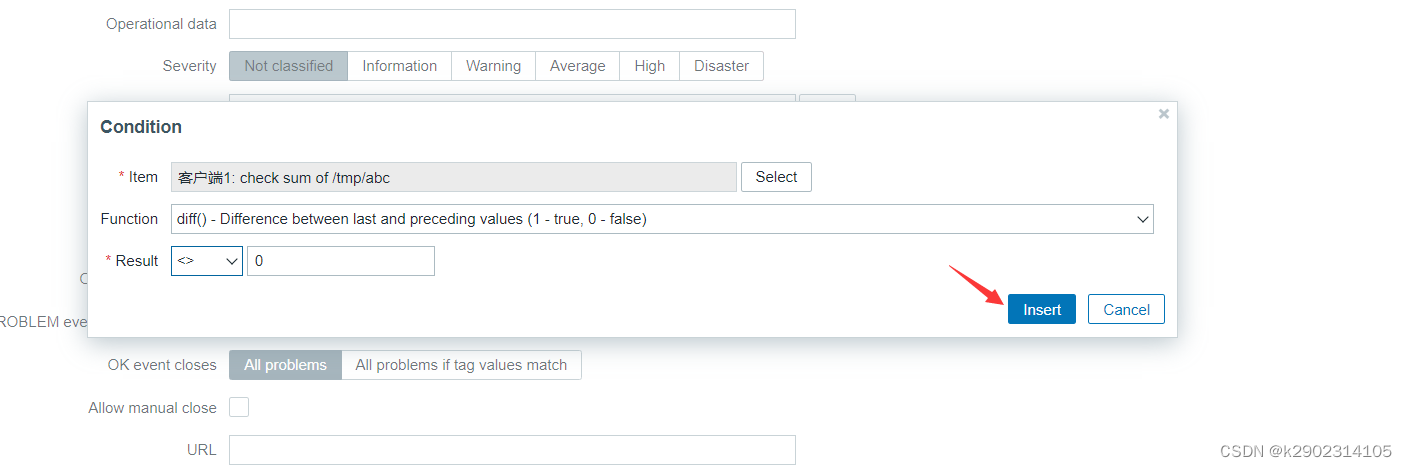
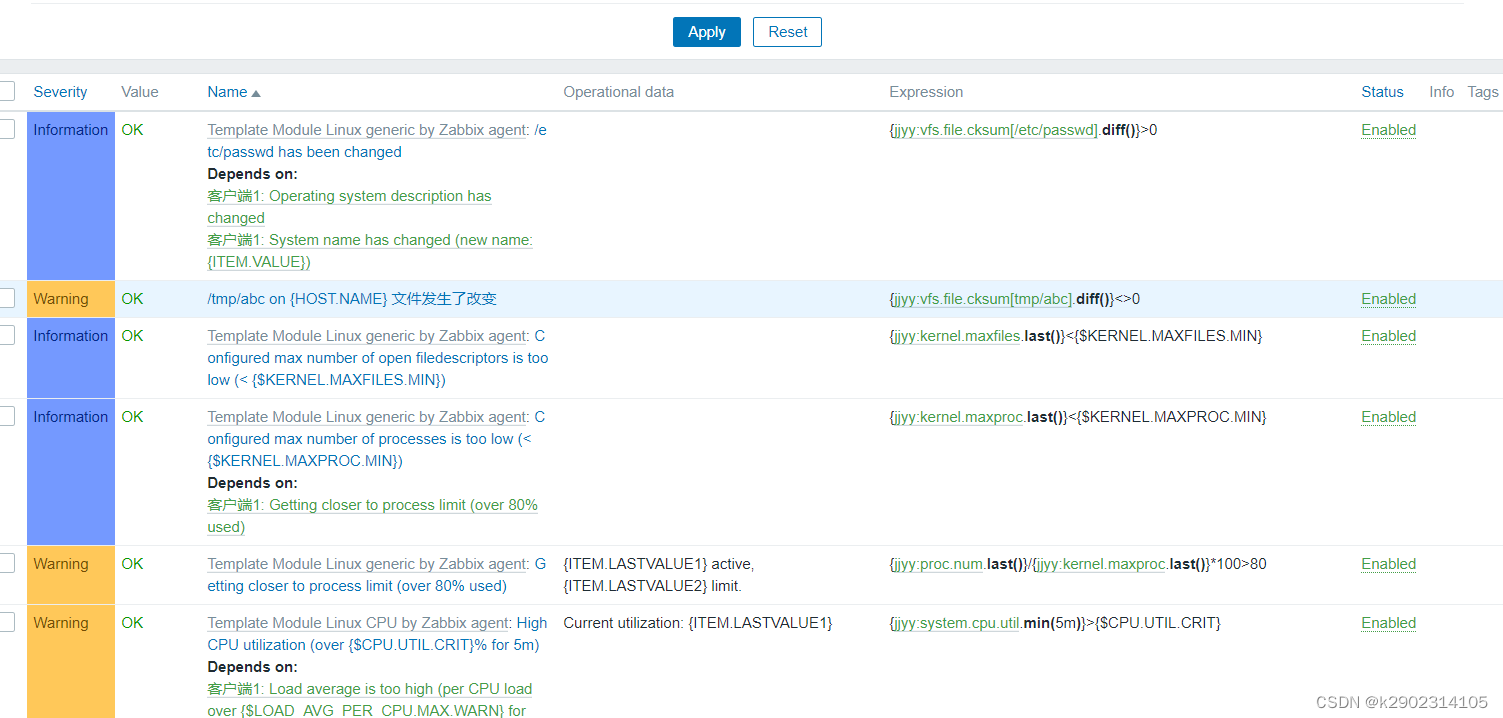
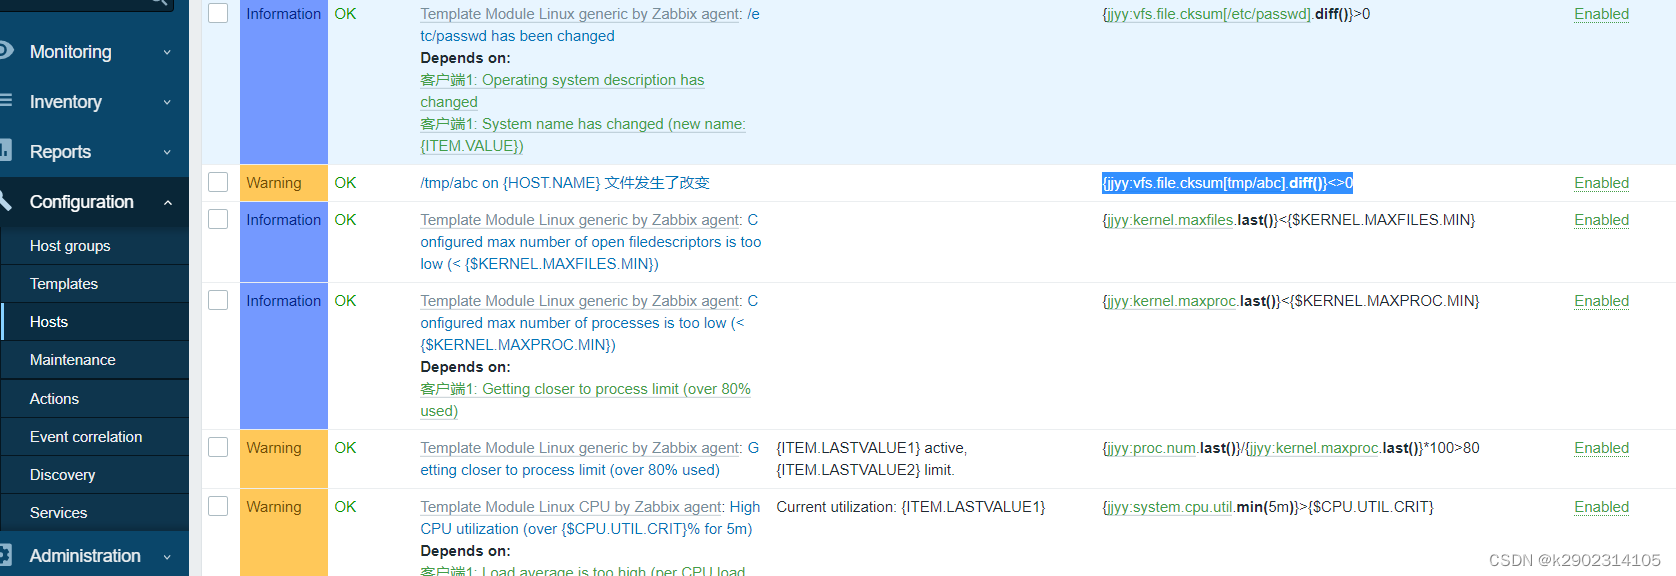
3.添加触发器

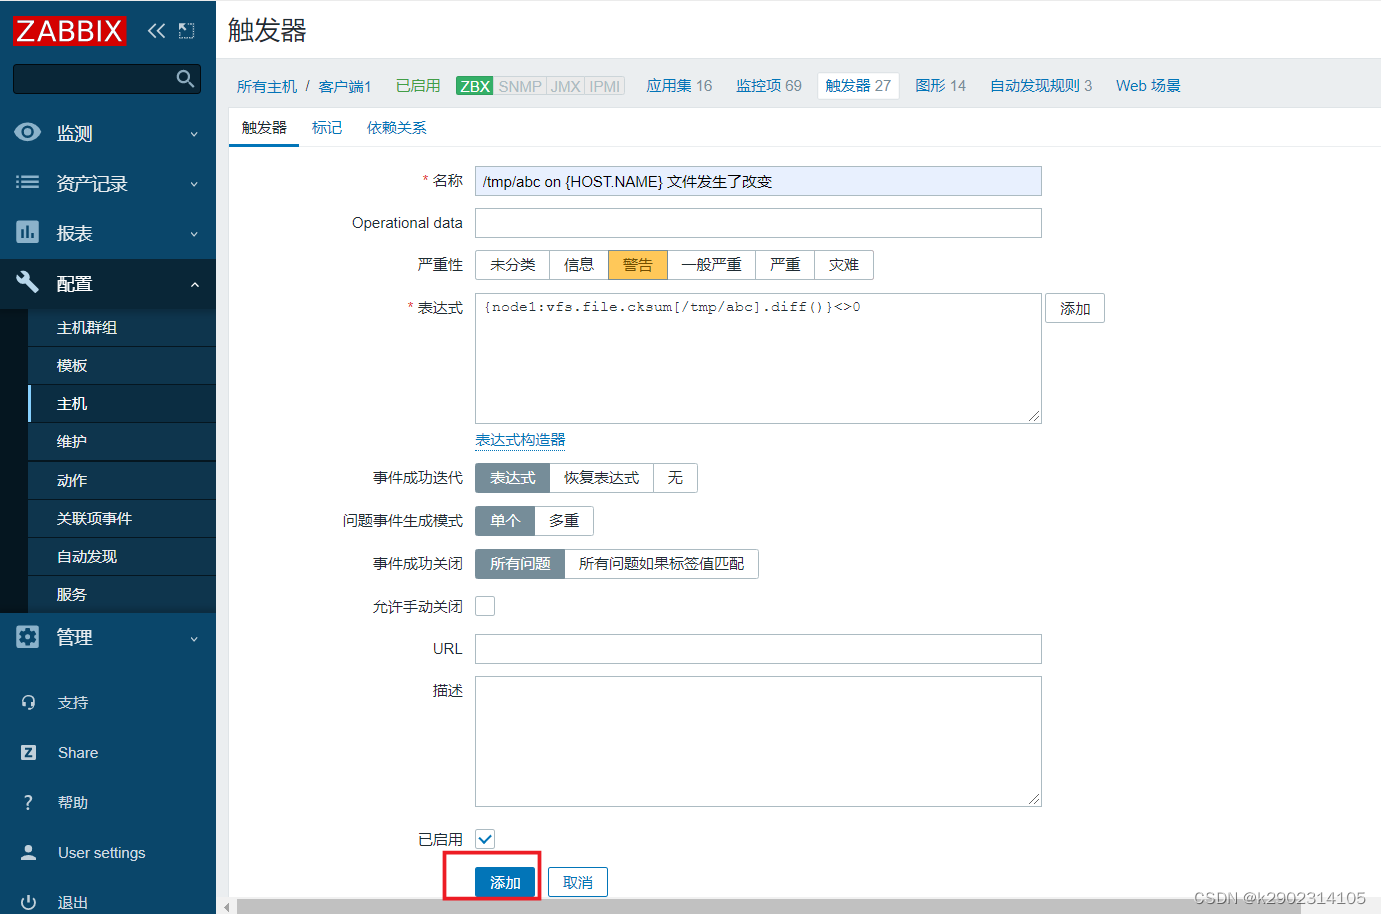
触发器成功
手动触发测试
添加媒介,动作是为了通知你
先看一下,能不能看到,在设置通知
//添加文件,要有可读的权限
[root@localhost tmp]# echo 'hello world' > abc
[root@localhost tmp]# ll -d abc
-rw-r--r--. 1 root root 12 1月  25 12:57 abc
[root@localhost tmp]#

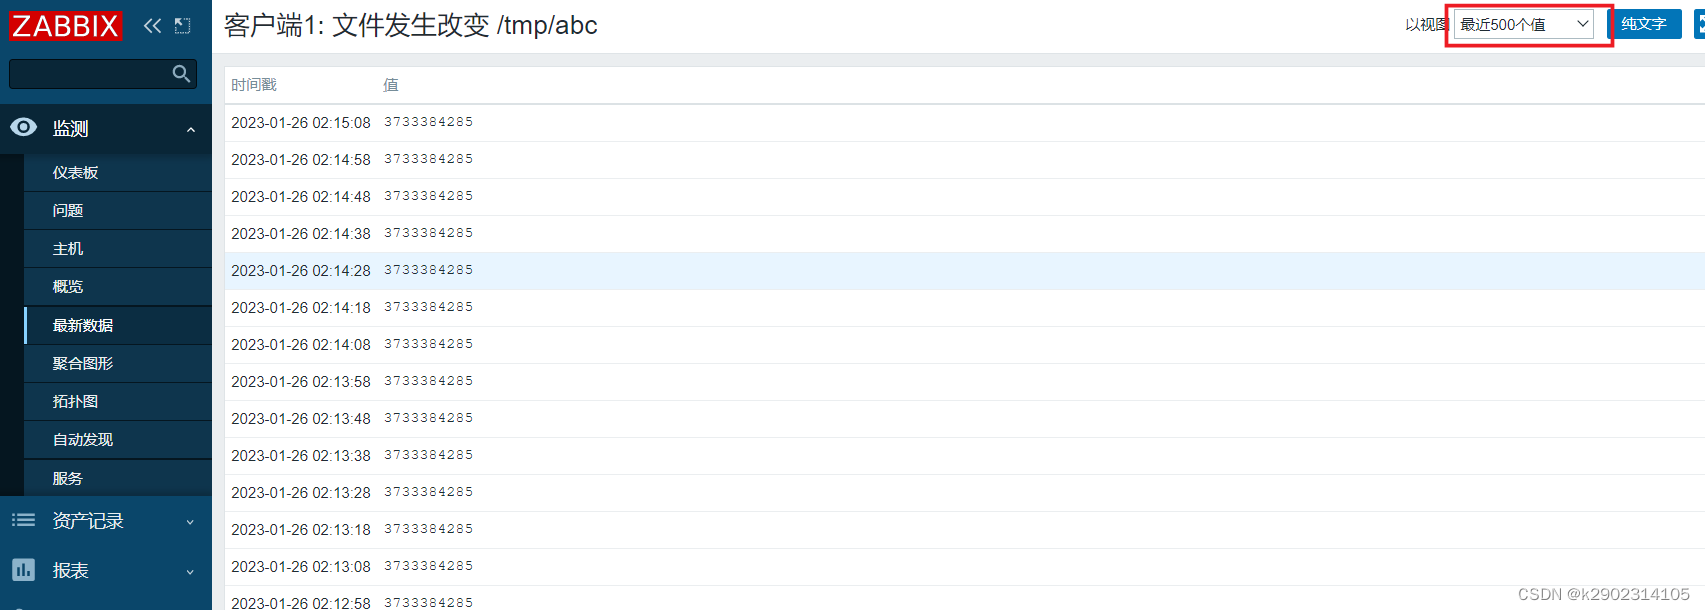
可以取到值
发生报警
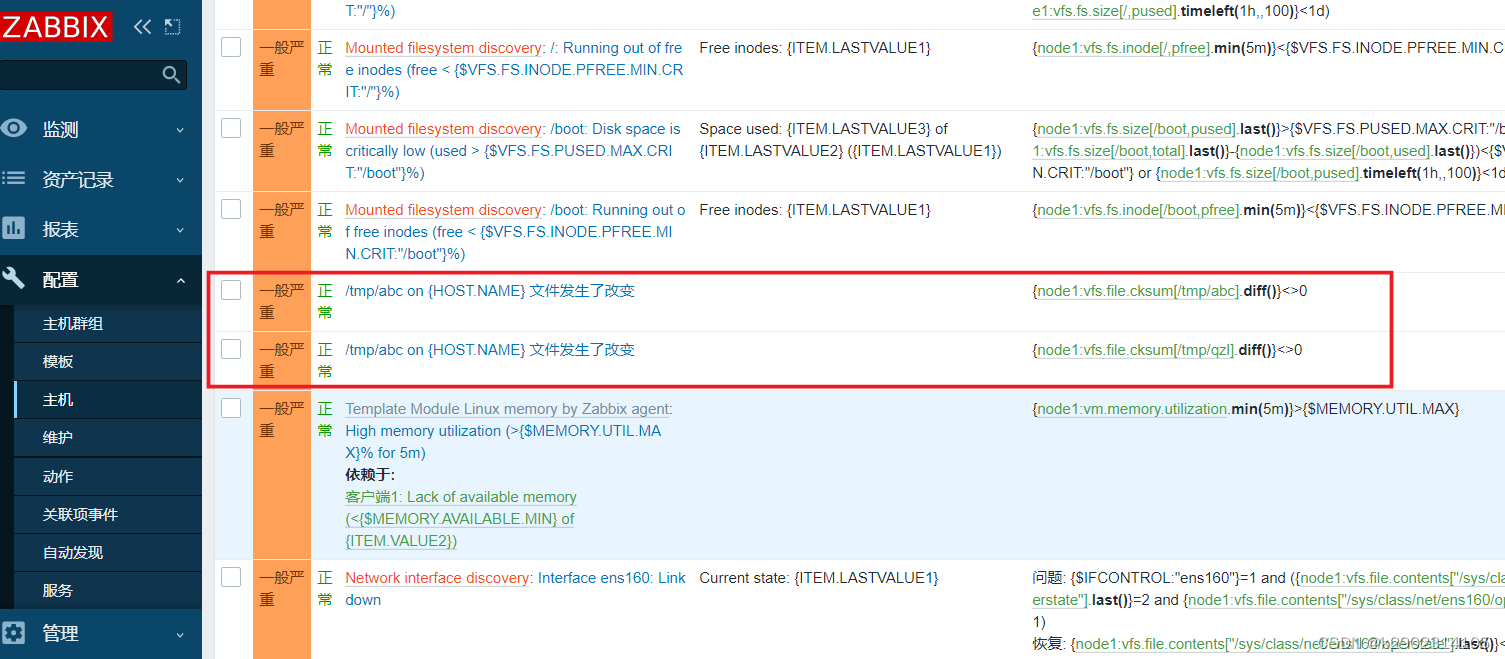
添加表达式


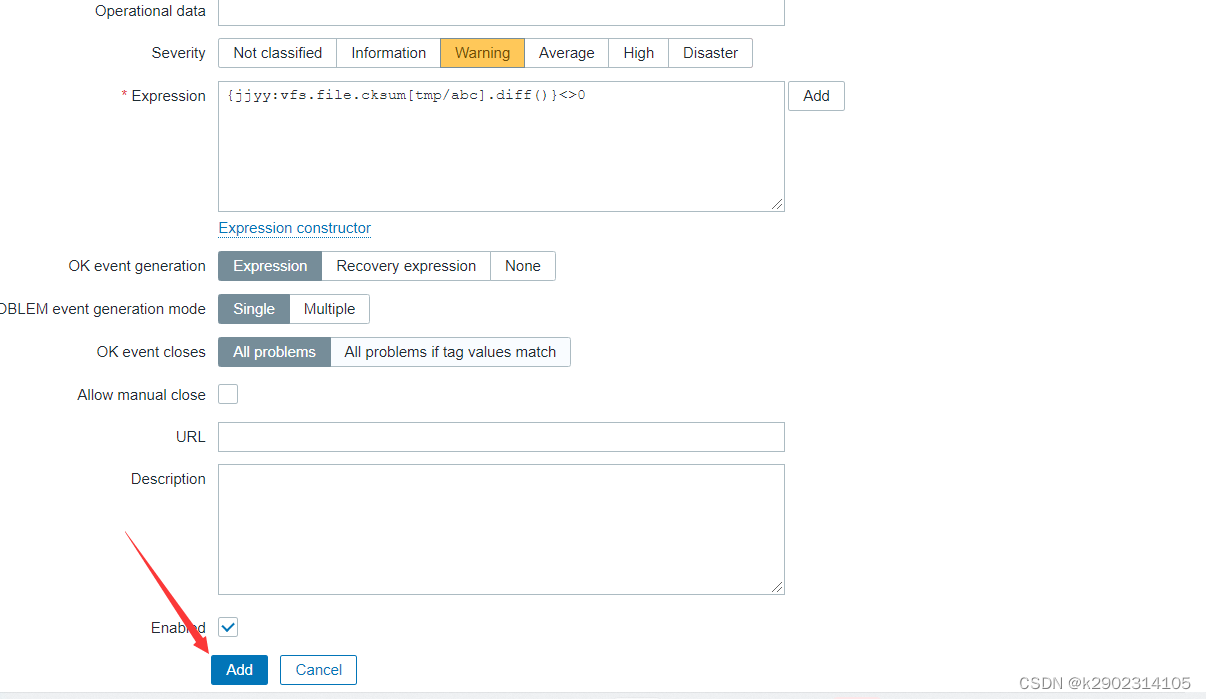
手动触发测试
添加媒介,动作是为了通知你
先看一下,能不能看到,在设置通知
//客户机
[root@localhost ~]# cd /tmp/
[root@localhost tmp]# echo 'hello world' > abc
[root@localhost tmp]# ll
总用量 40
-rw-r--r--  1 root   root      12 7月   7 22:23 abc
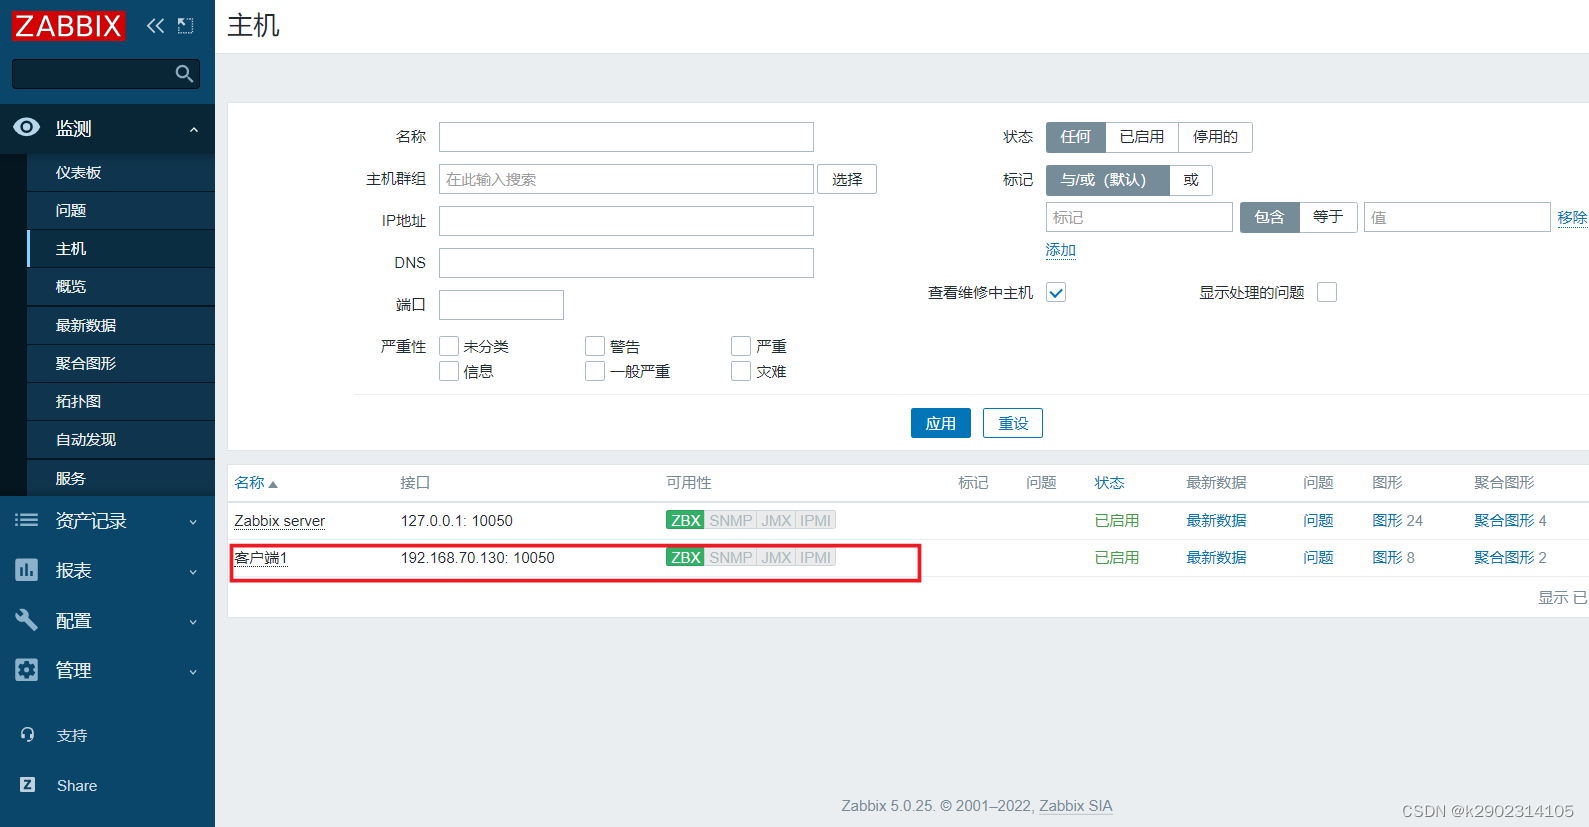
选择要看的主机

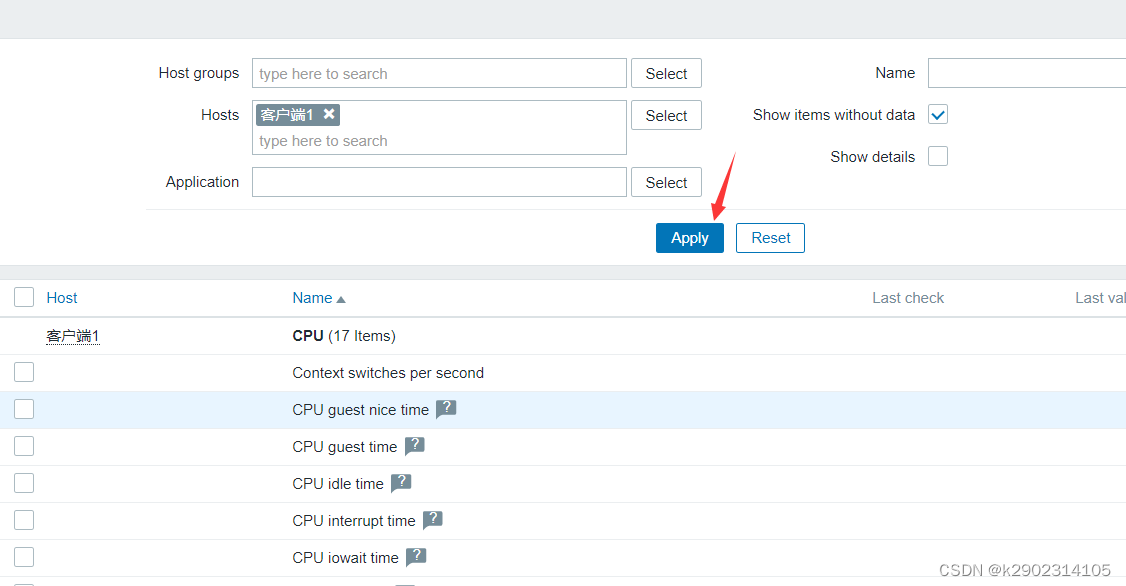
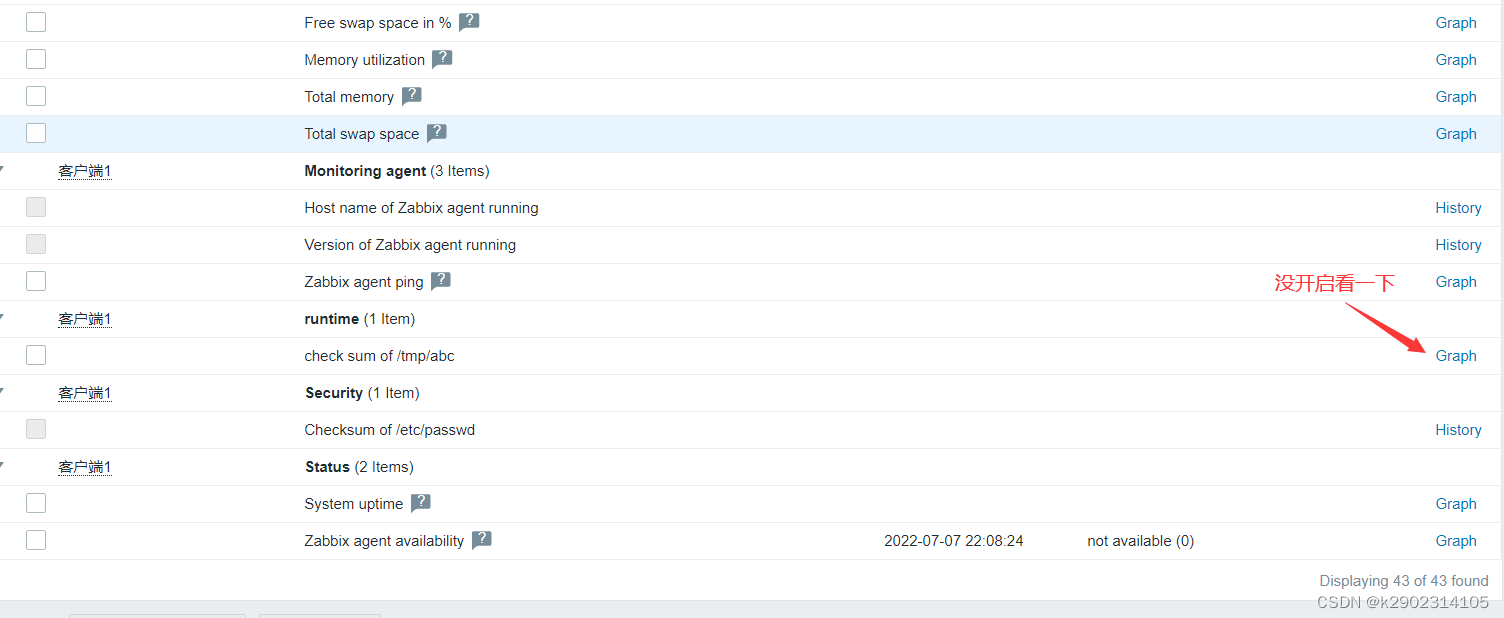
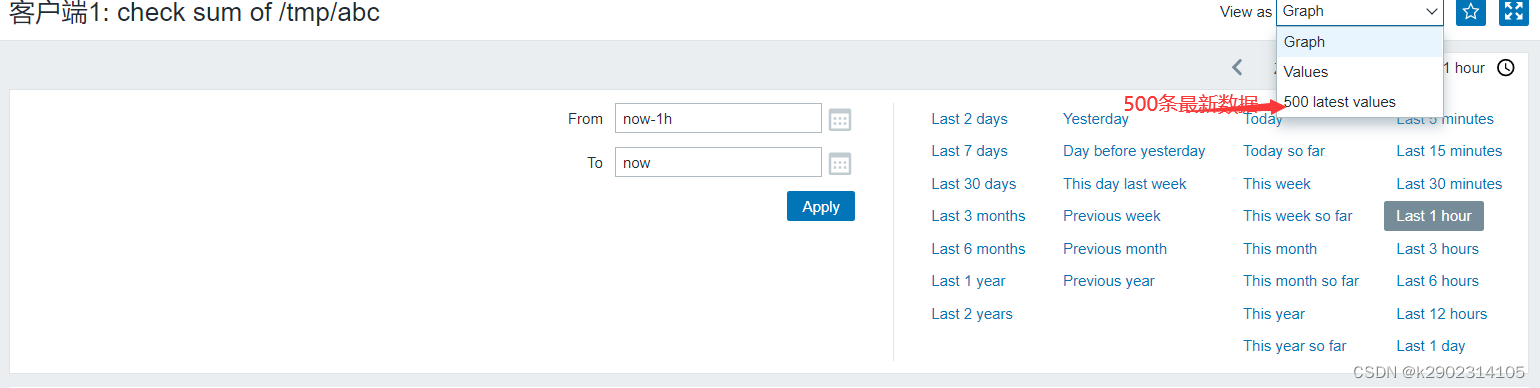
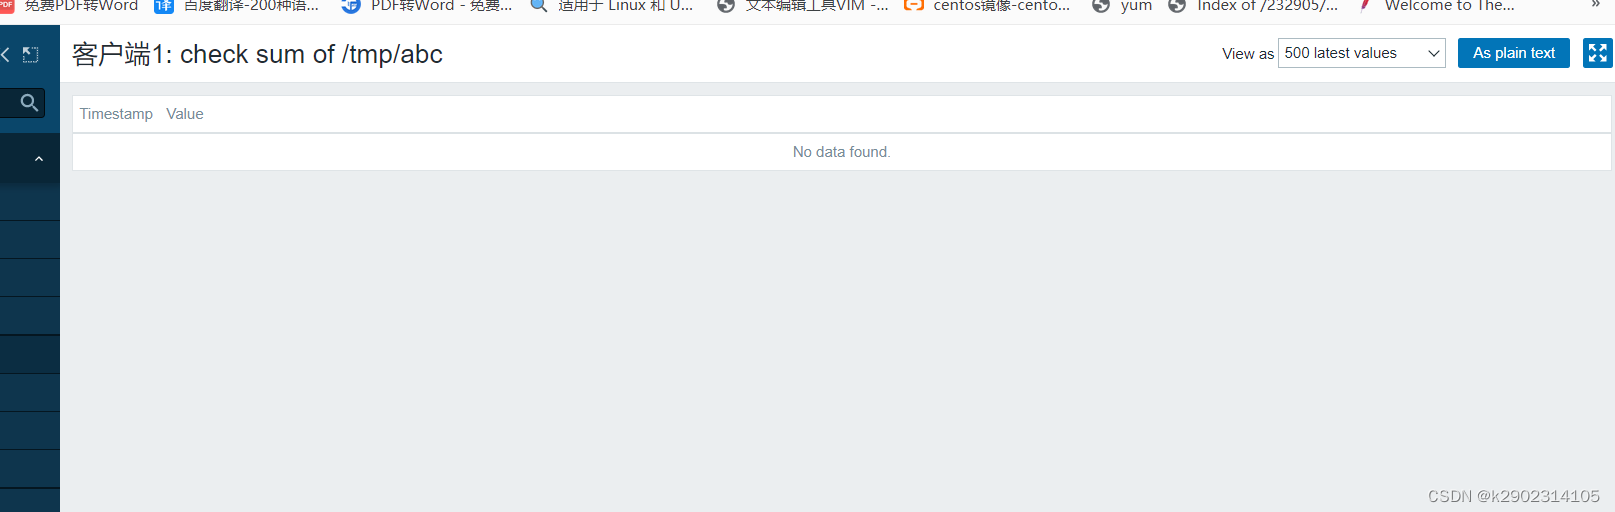
在服务端上手动获取看看能不能获取到值
复制这个key
主机不用指
[root@localhost tmp]# zabbix_get -s 192.168.70.129 -k vfs.file.cksum[tmp/abc]     //在服务机上用这个命令
3733384285       // 可以看到说明可以取到值
[root@localhost tmp]#
[root@localhost tmp]# chown zabbix.zabbix abc
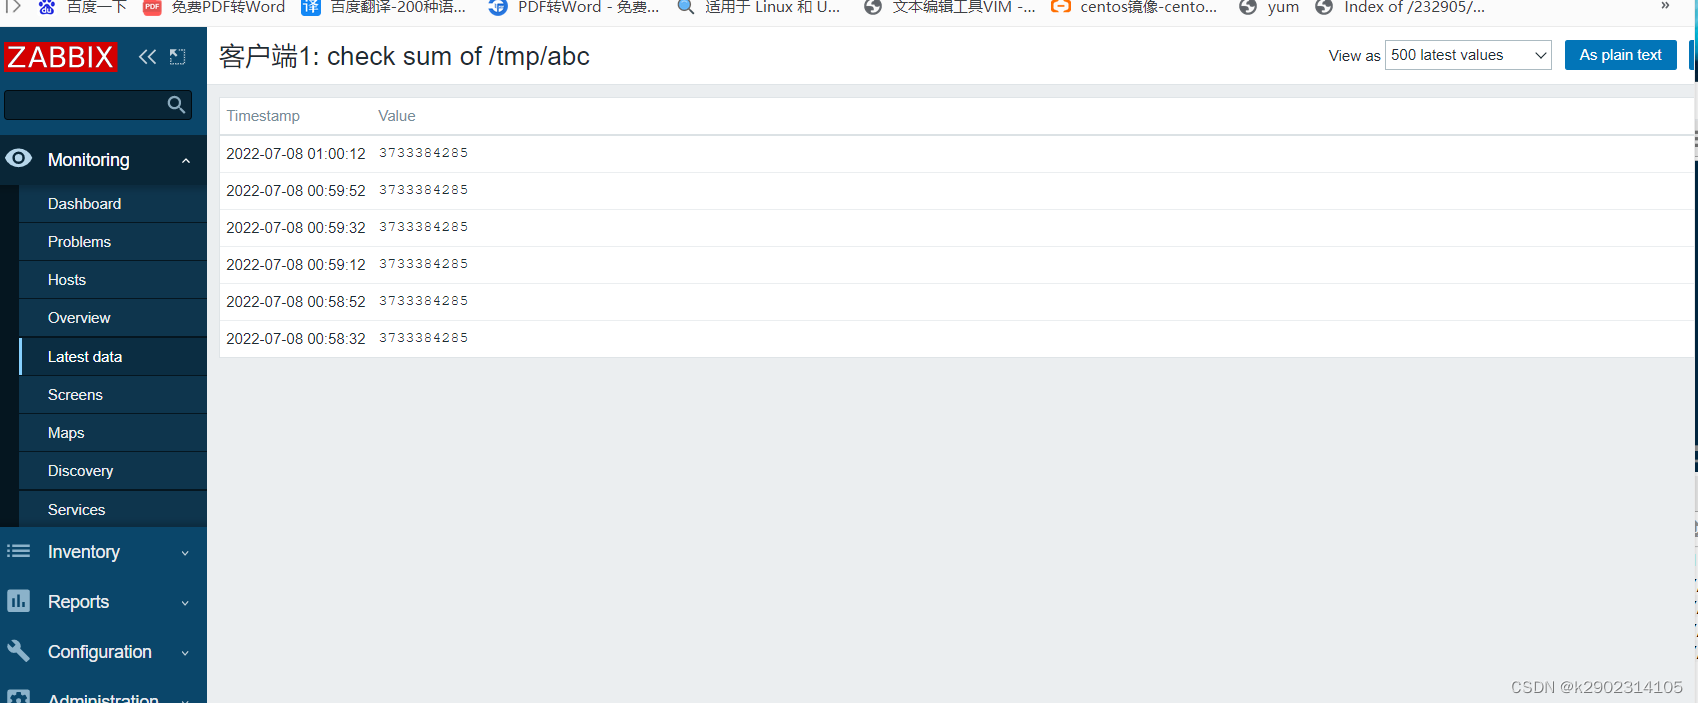
测试
[root@localhost tmp]# echo "hello " > abc
[root@localhost tmp]#

添加声音报警

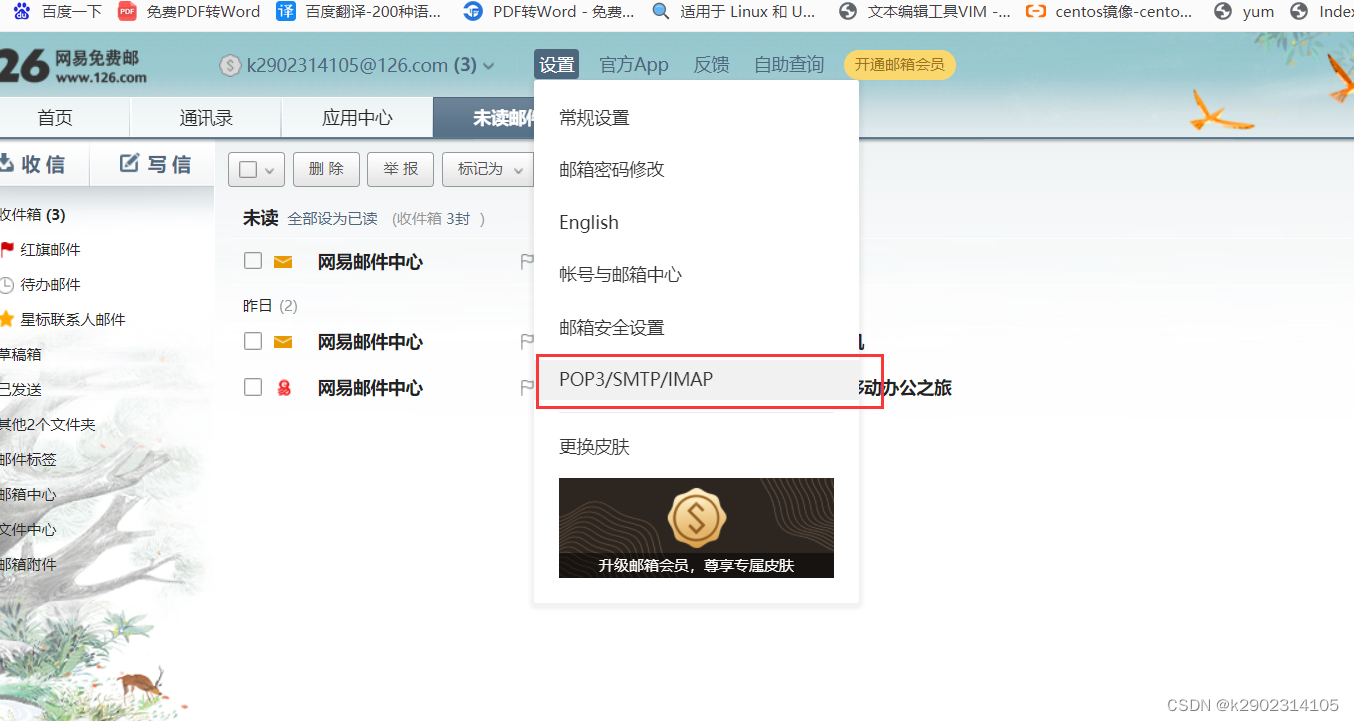
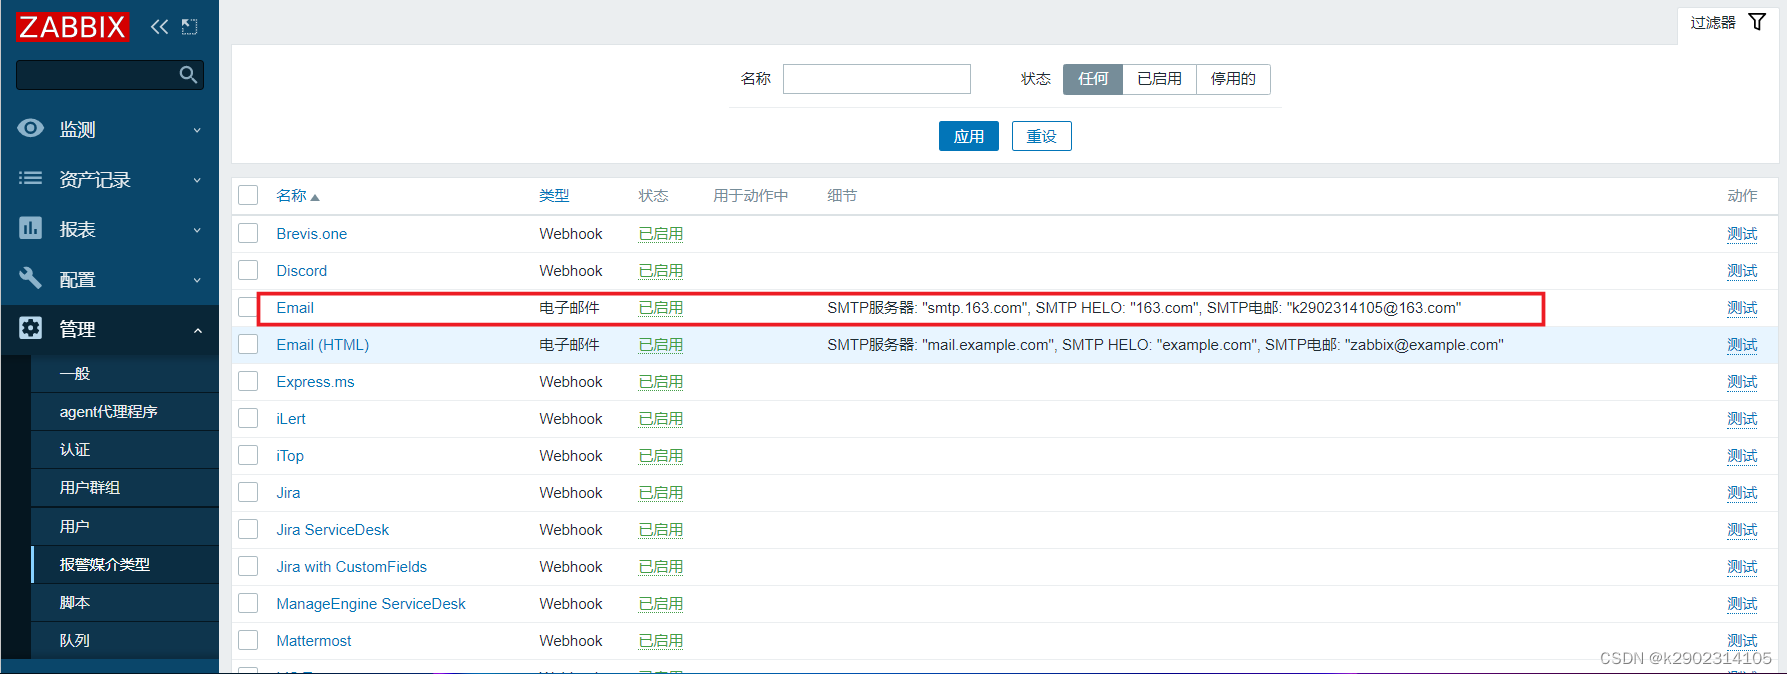
邮箱告警配置
点击管理–>用户–>选择用户–>报警媒介
配置邮件告警之前先得把/STMP/IMAP/POP3功能打开

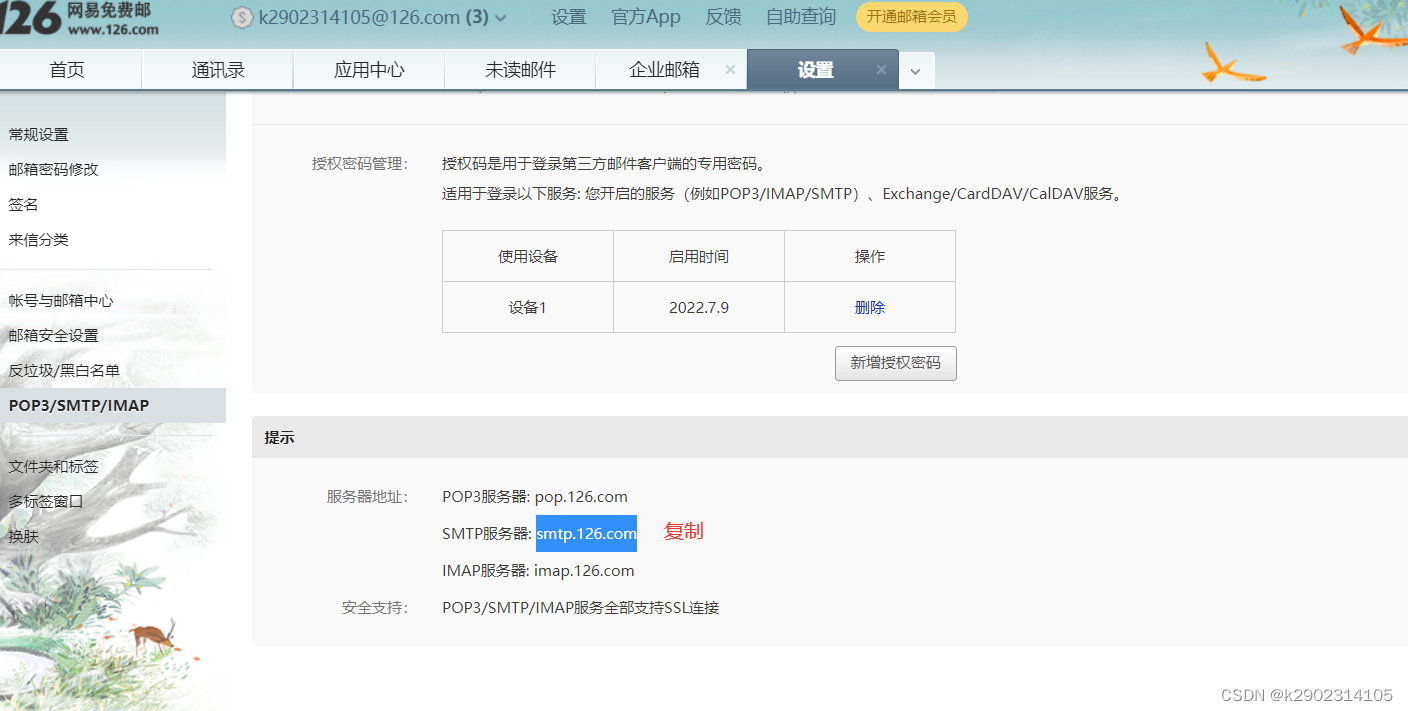
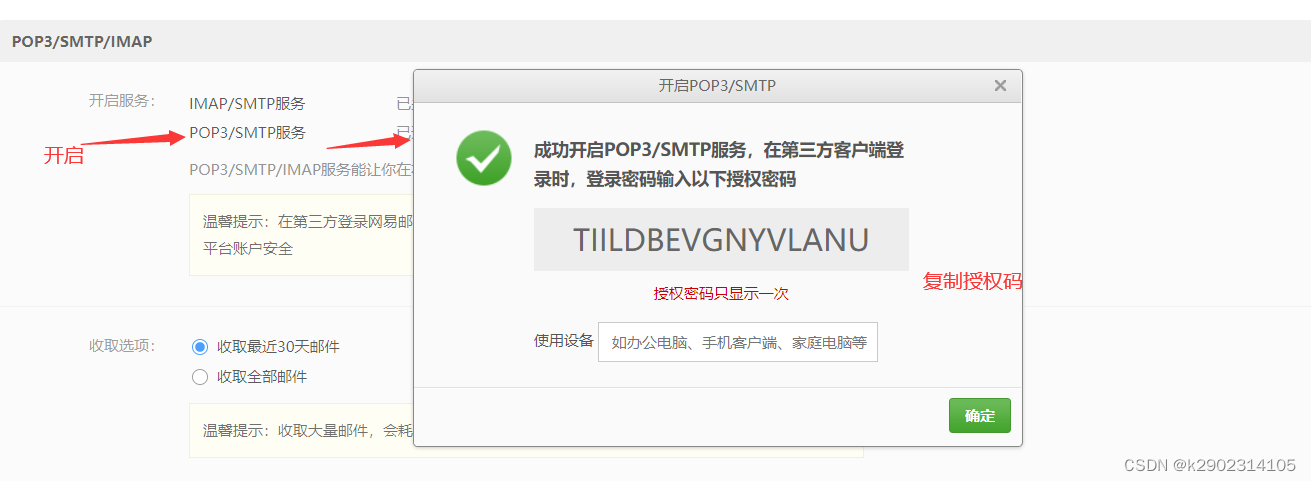
连接邮箱报警媒介
OYNSDUWCKBRQOLMM
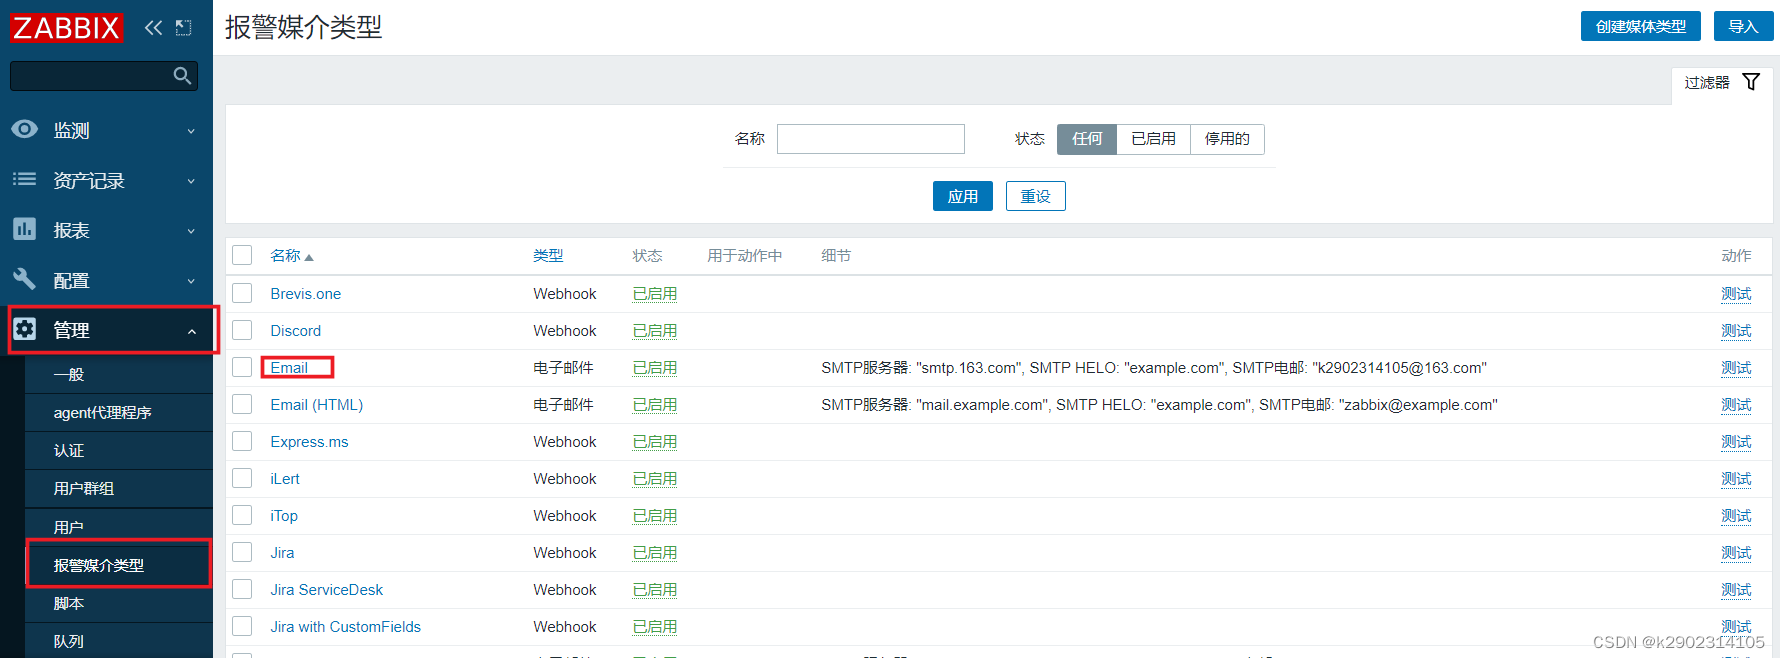

创建媒介成功
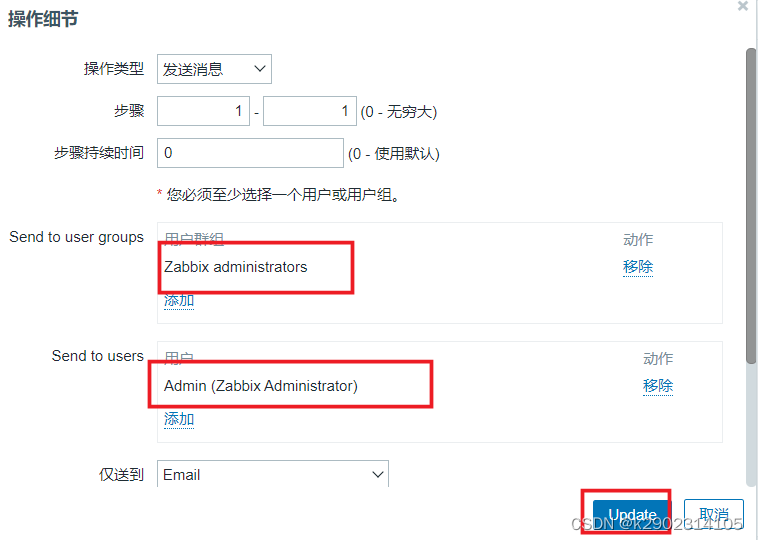
指定用户发送报警邮件

更新报警媒介


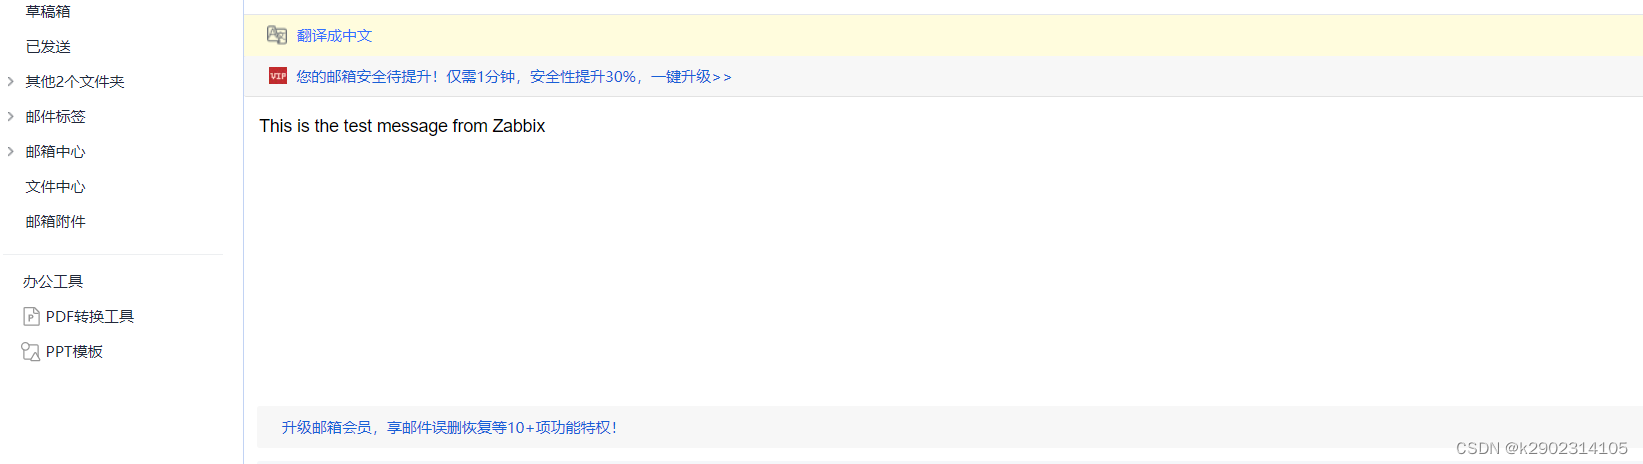
测试邮件成功
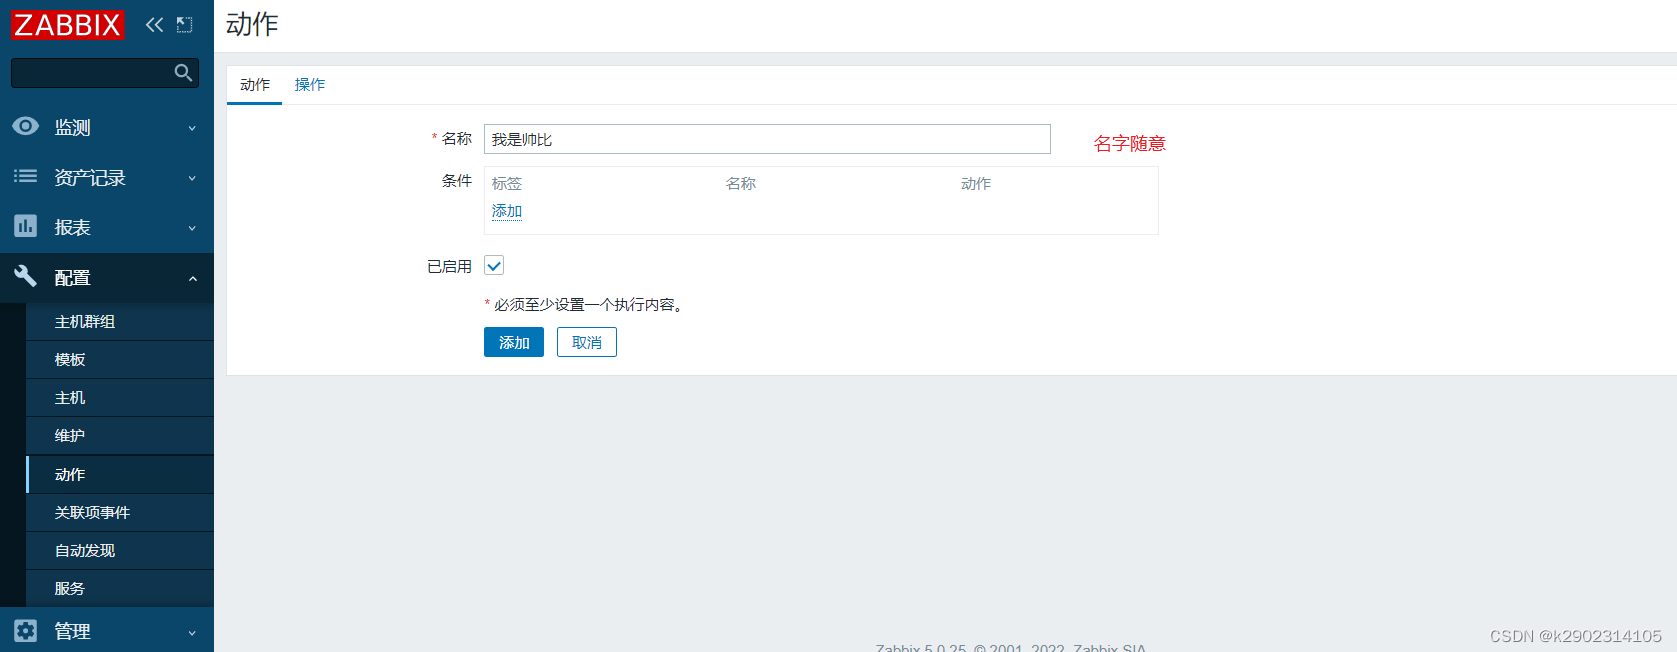
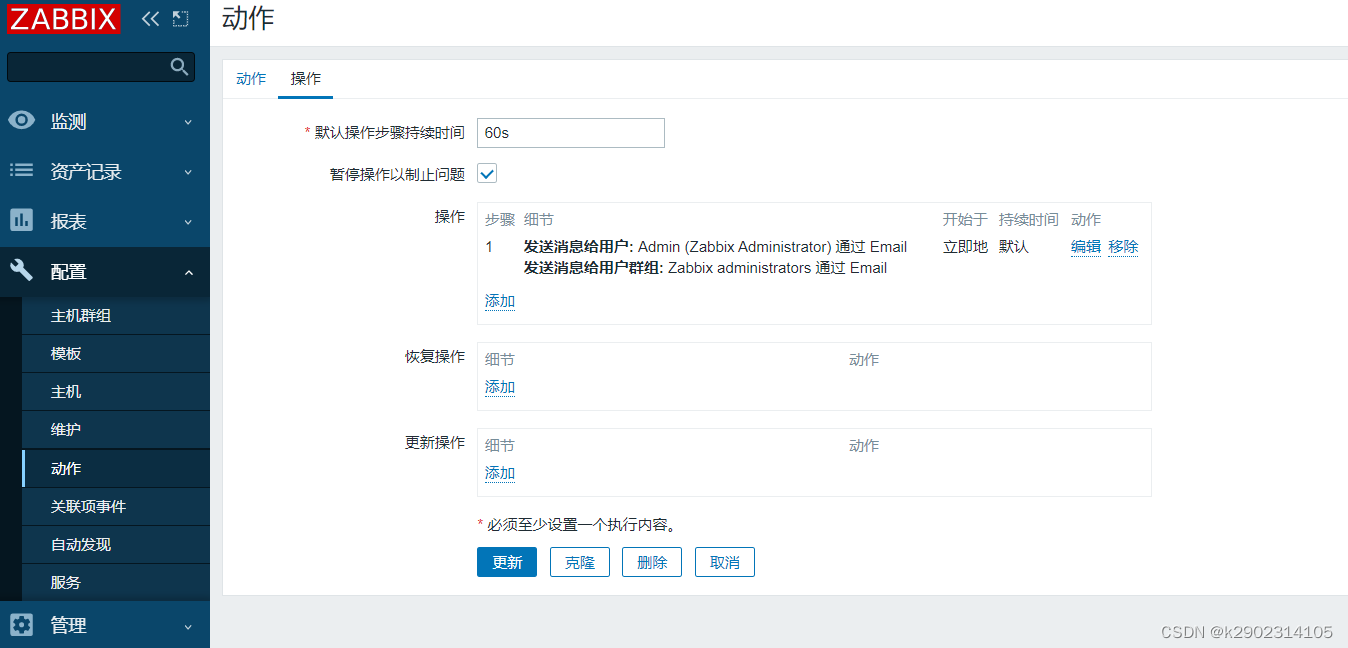
添加动作
触发器可以在当接受到某个值超过预设的值时,直观的显示出问题,但是也只是仅仅显示在web界面,监控人员还是需要时刻盯着屏幕,才能及时看到问题。这样工作效率还是没有明显提升,我们需要当这个触发器被触发时,有一个动作帮我们报警或者直接帮我们恢复故障。
配置–>动作–>创建动作
添加白名单
手动验证并触发
qq邮箱需要添加白名单 不然不会收到告警邮件


 765
765


 被折叠的 条评论
为什么被折叠?
被折叠的 条评论
为什么被折叠?
 到【灌水乐园】发言


