visualMap:{
backgroundColor:"transparent", //标题背景色
borderColor:"#ccc", //边框颜色
borderWidth:1, //边框线宽
align: 'left',
show:true, //是否显示 visualMap-continuous 组件。如果设置为 false,不会显示,但是数据映射的功能还存在
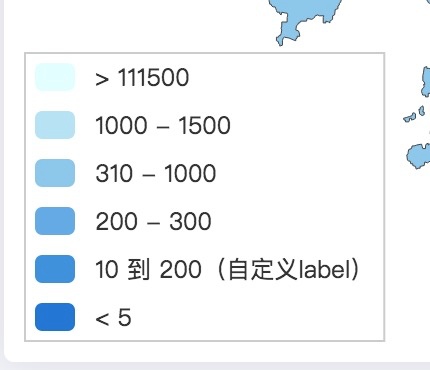
type: 'piecewise', // 定义为分段型 visualMap
splitNumber:5, //对于连续型数据,自动平均切分成几段。默认为5段
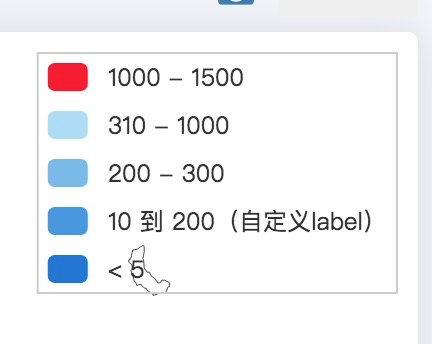
pieces: [ //自定义『分段式视觉映射组件(visualMapPiecewise)』的每一段的范围,以及每一段的文字,以及每一段的特别的样式
{min: 111500}, // 不指定 max,表示 max 为无限大(Infinity)。
{min: 900, max: 1500},
{min: 310, max: 1000},
{min: 200, max: 300},
{min: 10, max: 200, label: '10 到 200(自定义label)'},
{value: 123, label: '123(自定义特殊颜色)', color: 'grey'}, // 表示 value 等于 123 的情况。
{max: 5} // 不指定 min,表示 min 为无限大(-Infinity)。
]
}
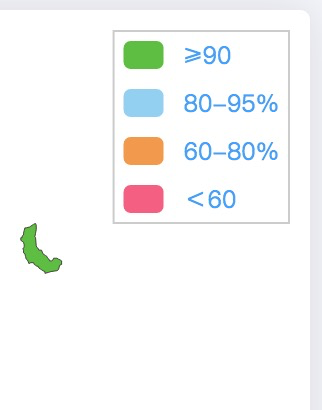
 dataRange: {
         borderColor:"#ccc",                         //边框颜色
        borderWidth:1,                               //边框线宽
    x: 'right',
    y: 'top',
      align: 'left',
    splitList: [
      {start: 95, label: '≥90', color: '#52C41A'},
      {start: 0.8, end: 0.95, label: '80-95%', color: '#8CCFF7'},
      {start: 0.6, end: 0.80, label: '60-80%', color: '#F89A27'},
      {end: 0.6, label: '<60', color: '#FA597C'},
    ],


 本文探讨了如何使用visualMap组件创建自定义分段的视觉映射,并展示了如何通过dataRange组件设置数据范围的颜色标记。重点在于piecewise类型和splitNumber的设置,以及如何通过pieces属性实现特定数值的特殊样式和文字标签。


 9万+
9万+

 被折叠的 条评论
为什么被折叠?
被折叠的 条评论
为什么被折叠?
 到【灌水乐园】发言


