


matlibplot 横向双柱形图
横向柱形图的指令是**.barh**, (h: horizontal)
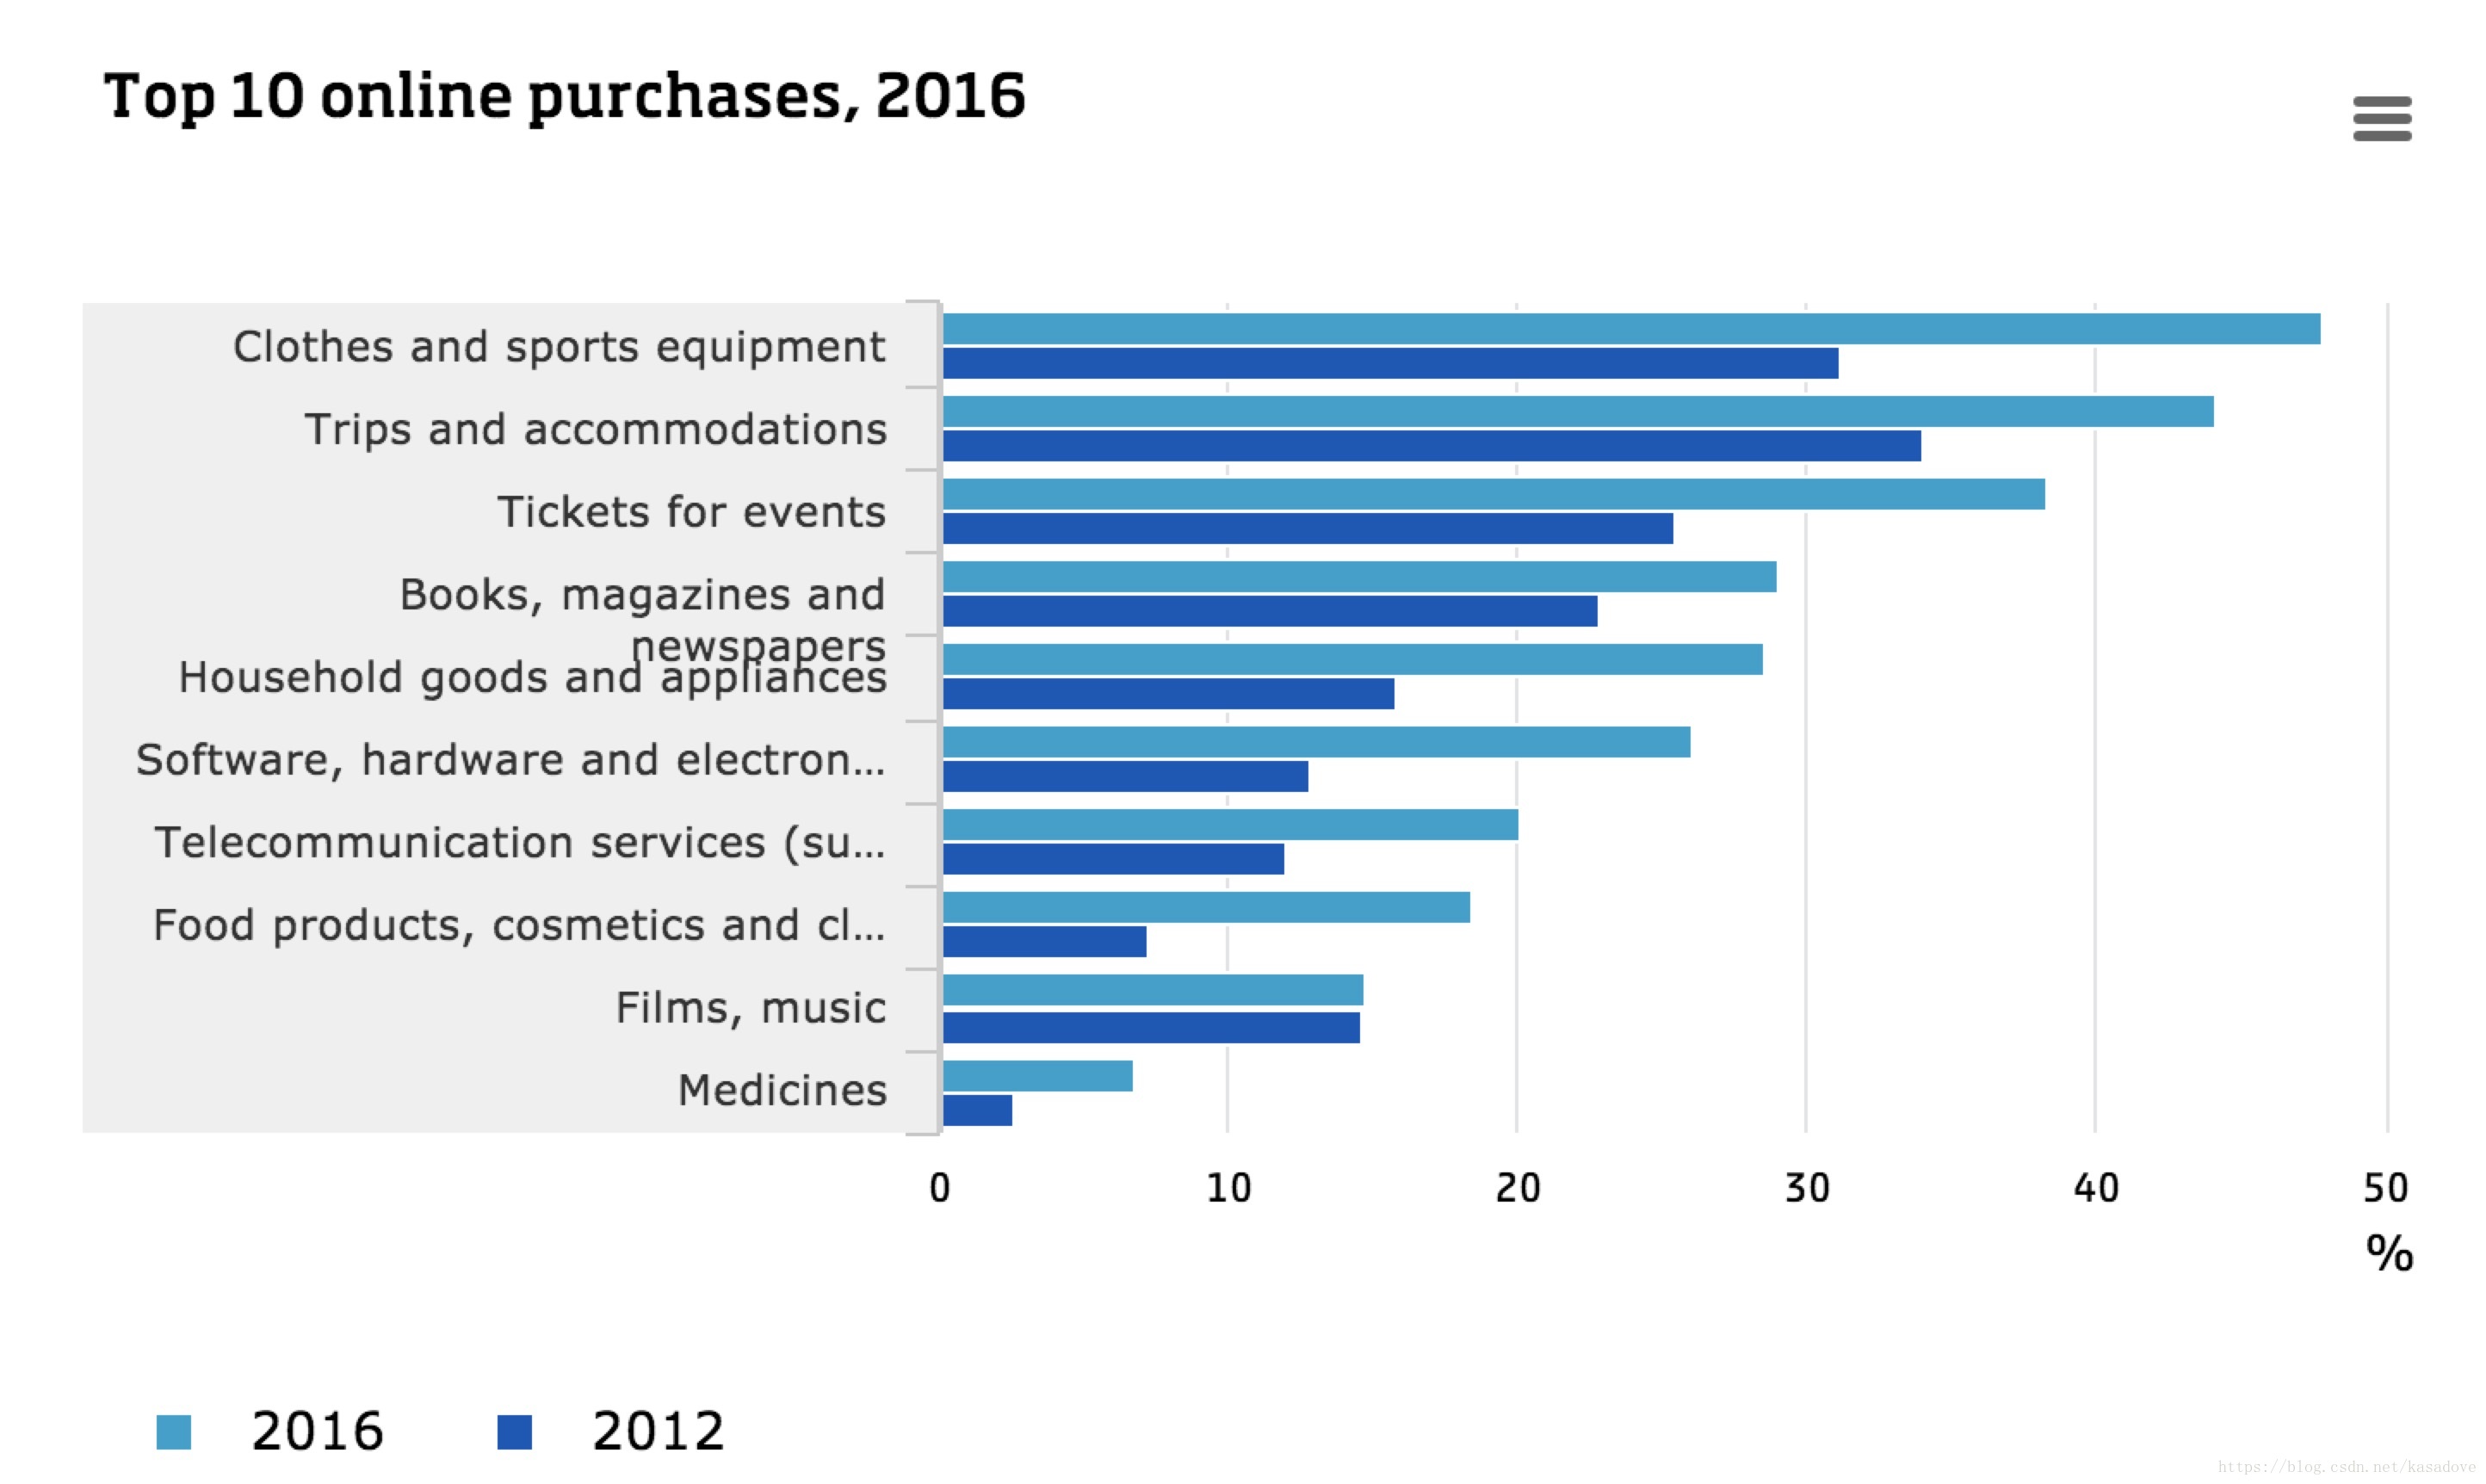
category= ['Medicines', 'Films, music', 'Food products, cosmetics and cleaning products', \
           'Telecommunication services', 'Software,   hardware and electronic equipment',\
           'Household goods and appliances', 'Books, magazines and newspapers', 'Tickets for events', \
           'Trips and accommodations', 'Clothes and sports equipment']

year_2016 = [6.8, 14.8, 18.5, 20.1, 26.1, 28.6, 29.1, 38.3, 44.2, 47.9]
year_2012 = [2.6, 14.6, 7.3, 12, 12.8, 15.8, 22.9, 25.5, 34, 31.2]

total_height = 0.8
n_bar = 2 # 做双柱状图,所以n=2
height = total_height / n_bar

x = [0,1,2,3,4,5,6,7,8,9]
plt_2012 = plt.barh(x, year_2012, height=-h
最低0.47元/天 解锁文章


 被折叠的 条评论
为什么被折叠?
被折叠的 条评论
为什么被折叠?
 到【灌水乐园】发言


