


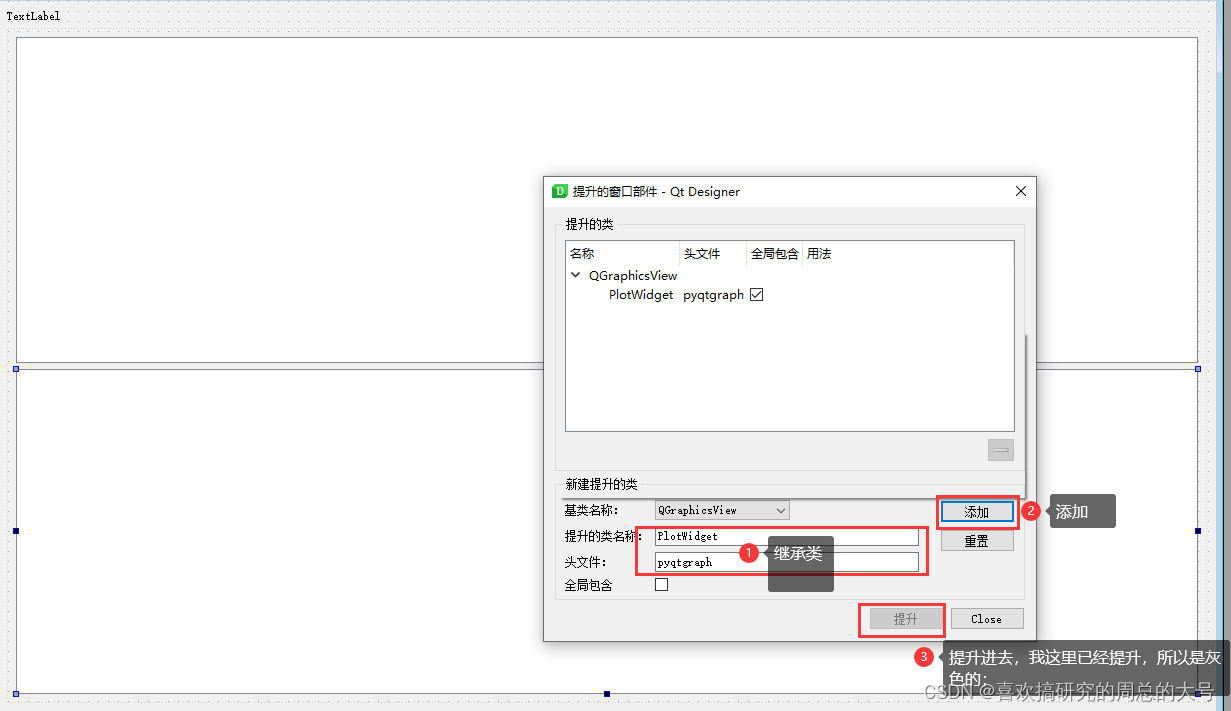
pyqt显示波形的控件为graphicsView,在ui界面中新建一个graphicsView控件,然后如图所示提升类,然后ui转为py文件,就可以在主py文件中调用
以下是初始化
        y_min = 0
        y_max = 1950
        self.graphicsView.plotItem.clear()  # 清空绘图部件中的项
        self.graphicsView.showGrid(x=True, y=True)  # 设置绘图部件显示网格线
        self.graphicsView.setYRange(y_min, y_max)
        self.graphicsView.setXRange(0, 100)
        self.graphicsView.setLabel(axis='left', text='数据')  # 设置Y轴标签
        self.graphicsView.setLabel(axis='bottom', text='时间')  # 设置X轴标签
        self.label = pg.TextItem()  # 创建一个文本项
        self.graphicsView.addItem(self.label)  # 在图形部件中添加文本项

        self.vLine = pg.InfiniteLine(angle=90, movable=False, )  # 创建一个垂直线条
        self.hLine = pg.InfiniteLine(angle=0, movable=False, )  # 创建一个水平线条
        self.graphicsView.addItem(self.vLine, ignoreBounds=True)  # 在图形部件中添加垂直线条
        self.graphicsView.addItem(self.hLine, ignoreBounds=True)  # 在图形部件中添加水平线条

        self.move_slot = pg.SignalProxy(self.graphicsView.scene().sigMouseMoved, rateLimit=60, slot=self.print_slot)

        self.graphicsView.getAxis("bottom").setTicks([[(1, 'A'), (2, 'B'), (3, 'C'), (4, 'D')]]) # 设置y轴显示坐标;
        self.canvasZ = self.graphicsView.plot(pen="g", name="y2")
        self.canvasZ.setData([1,2,3,4])  # 显示数据;


        # 显示数据的另外方法;
        hour = [1,2,3,4,5,6,7,8,9,10] # X轴坐标
        temperature = [30,32,34,32,33,31,29,32,35,45] # Y轴坐标
        self.graphicsView.setBackground('w') # 设置背景颜色为白色
        pen = pg.mkPen(color = (255 , 0 , 0) , width = 15) # 设置曲线颜色为红色,宽度设置为15个像素点
        styles ={'color':'r' , 'font-size':'30px'} # 设置标签的颜色和大小
        self.graphicsView.setLabel('bottom'  , '温度' , **styles) # 设置底部X的标签名字为温度
        self.graphicsView.setLabel('left'  , '功率' , **styles) # 设置左边Y的标签名字为功率
        self.graphicsView.plot(hour , temperature ,pen = pen)
如果不用ui提升方式,也可以直接定义,这里的self.k_plt_2就等于self.graphicsView;但是注意的是要将self.k_plt_2添加到对应的显示控件中
self.k_layout_volume = QtWidgets.QGridLayout()  # 实例化一个网格布局层
self.widget_3.setLayout(self.k_layout_volume)
self.k_plt_2 = pg.PlotWidget()
self.k_layout_volume.addWidget(self.k_plt_2)
这里是csdn其他人搞得pyqt串口波形显示数据,我测试过,是跑的起来的,但是显示ui中需要提升pyqtgraph才行
import sys
import numpy as np

from PyQt5.QtGui import *
from PyQt5.QtCore import *
from PyQt5.QtWidgets import *

import serial
import serial.tools.list_ports
from ui_main import Ui_MainWindow
import pyqtgraph as pg


class AppMainWindow(QMainWindow, Ui_MainWindow):
    def __init__(self, parent=None):
        super(AppMainWindow, self).__init__(parent)
        self.setupUi(self)
        self.setWindowTitle("串口数据波形显示工具")
        self.PosX = 0
        self.dataIndex = 0          # 数据列表当前索引
        self.dataMaxLength = 10000  # 数据列表最大长度
        self.dataheader = b'$$:'    # 数据帧开头
        self.dataX = np.zeros(self.dataMaxLength, dtype=float)
        self.dataY = np.zeros(self.dataMaxLength, dtype=float)
        self.dataZ = np.zeros(self.dataMaxLength, dtype=float)
        self.dataH = np.zeros(self.dataMaxLength, dtype=float)

        self.mSerial = serial.Serial()
        self.ScanComPort()
        self.SelectComPort()

        self.btnScanPort.clicked.connect(self.ScanComPort)
        self.btnOpenPort.clicked.connect(self.OpenComPort)
        self.btnClosePort.clicked.connect(self.CloseComPort)
        self.cmbComPort.currentIndexChanged.connect(self.SelectComPort)

        self.mTimer = QTimer()
        self.mTimer.timeout.connect(self.ReceiverPortData)

        self.plotM.setAntialiasing(True)
        # self.plotM.setBackground()
        self.canvasX = self.plotM.plot(self.dataX, pen=pg.mkPen(color='r', width=1))
        self.canvasY = self.plotM.plot(self.dataY, pen=pg.mkPen(color='g', width=1))
        self.canvasZ = self.plotM.plot(self.dataZ, pen=pg.mkPen(color='b', width=1))
        self.canvasH = self.plotM.plot(self.dataH, pen=pg.mkPen(color='y', width=1))

    def ScanComPort(self):
        self.cmbComPort.clear()
        self.portDict = {}
        portlist = list(serial.tools.list_ports.comports())
        for port in portlist:
            self.portDict["%s" % port[0]] = "%s" % port[1]
            self.cmbComPort.addItem(port[0])
        if len(self.portDict) == 0:
            QMessageBox.critical(self, "警告", "未找到串口设备!", QMessageBox.Cancel, QMessageBox.Cancel)
        pass

    def SelectComPort(self):
        if len(self.portDict) > 0 :
            self.labComPortName.setText(self.portDict[self.cmbComPort.currentText()])
        else:
            self.labComPortName.setText("未检测到串口设备!")
        pass

    def OpenComPort(self):
        self.mSerial.port = self.cmbComPort.currentText()
        self.mSerial.baudrate = int(self.cmbBaudrate.currentText())

        if self.mSerial.isOpen():
            QMessageBox.warning(self, "警告", "串口已打开", QMessageBox.Cancel, QMessageBox.Cancel)
        else:
            try:
                self.btnOpenPort.setEnabled(False)
                self.mSerial.open()
                self.mSerial.flushInput()
                self.mSerial.flushOutput()
                self.mTimer.start(1)
            except:
                QMessageBox.critical(self, "警告", "串口打开失败!", QMessageBox.Cancel, QMessageBox.Cancel)
                self.btnOpenPort.setEnabled(True)
        print(self.mSerial)
        pass

    def CloseComPort(self):
        self.mTimer.stop()
        if self.mSerial.isOpen():
            self.btnOpenPort.setEnabled(True)
            self.mSerial.flushInput()
            self.mSerial.flushOutput()
            self.mSerial.close()
        pass

    def ReceiverPortData(self):
        '''
        接收串口数据,并解析出每一个数据项更新到波形图
        数据帧格式'$$:95.68,195.04,-184.0\r\n'
        每个数据帧以b'$$:'开头,每个数据项以','分割
        '''
        try:
            n = self.mSerial.inWaiting()
        except:
            self.CloseComPort()

        if n > 0:
            # 端口缓存内有数据
            try:
                self.recvdata = self.mSerial.readline(1024) # 读取一行数据最大长度1024字节

                if self.recvdata.decode('UTF-8').startswith(self.dataheader.decode('UTF-8')):
                    rawdata = self.recvdata[len(self.dataheader) : len(self.recvdata) - 2]
                    data = rawdata.split(b',')
                    # print(rawdata)

                    if self.dataIndex < self.dataMaxLength:
                        # 接收到的数据长度小于最大数据缓存长度,直接按索引赋值,索引自增1
                        # print(rawdata, rawdata[0], rawdata[1], rawdata[2], self.dataX[self.dataIndex], self.dataY[self.dataIndex], self.dataZ[self.dataIndex])
                        self.dataX[self.dataIndex] = float(data[0])
                        self.dataY[self.dataIndex] = float(data[1])
                        self.dataZ[self.dataIndex] = float(data[2])
                        self.dataH[self.dataIndex] = float(data[3])
                        self.dataIndex = self.dataIndex + 1
                    else:
                        # 寄收到的数据长度大于或等于最大数据缓存长度,丢弃最前一个数据新数据添加到数据列尾
                        self.dataX[:-1] = self.dataX[1:]
                        self.dataY[:-1] = self.dataY[1:]
                        self.dataZ[:-1] = self.dataZ[1:]
                        self.dataH[:-1] = self.dataH[1:]

                        self.dataX[self.dataIndex - 1] = float(data[0])
                        self.dataY[self.dataIndex - 1] = float(data[1])
                        self.dataZ[self.dataIndex - 1] = float(data[2])
                        self.dataH[self.dataIndex - 1] = float(data[3])

                    # 更新波形数据
                    self.canvasX.setData(self.dataX)
                    self.canvasY.setData(self.dataY)
                    self.canvasZ.setData(self.dataZ)
                    self.canvasH.setData(self.dataH)

                    # self.canvasX.setPos(self.PosX, 0)
                    # self.canvasY.setPos(self.PosX, 0)
                    # self.canvasZ.setPos(self.PosX, 0)
            except:
                pass
        pass

    def SendPortData(self):
        pass


if __name__ == "__main__":
    app = QApplication(sys.argv)
    win = AppMainWindow()
    win.show()
    sys.exit(app.exec_())


 748
748


 被折叠的 条评论
为什么被折叠?
被折叠的 条评论
为什么被折叠?
 到【灌水乐园】发言


