


之所以选择JFreeChart,因为他 开源的,免费。并且它的功能不少,饼图、柱状图(普 通柱状图以及堆栈柱状图)、线图、区域图、分布图、混合图、甘特图以及一些仪表盘等等,甚至还有3D图形,基本能满足一般的报表图形要求。
JFreeChart(http://www.jfree.org/)支持 Application/Applet/Servlet/Jsp,有两种生成图表方式,一是利用java app本身的容器生产图表,另一种则是在web的服务端生成图片发送给浏览器端。
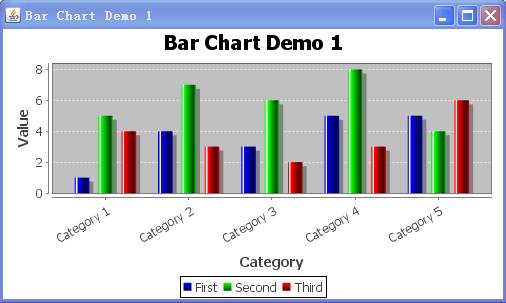
第一种方式的demo,载入jar包后可以执行。
BarChartDemo1 demo = new BarChartDemo1("Bar Chart Demo 1");
//创建名为"Bar Chart Demo 1"的图形
//该类继承于JFreeChart jar 的ApplicationFrame
CategoryDataset dataset = createDataset();
//显示图像的数据集
JFreeChart chart = createChart(dataset);
//创建图形
JFreeChart chart = ChartFactory.createBarChart(
"Bar Chart Demo 1", // chart title
"Category", // domain axis label
"Value", // range axis label
dataset, // data
PlotOrientation.VERTICAL, // orientation
true, // include legend
true, // tooltips?
false // URLs?
);
//createBarChart创建的是Bar图
ChartPanel chartPanel = new ChartPanel(chart);
//Constructs a panel that displays the specified chart
chartPanel.setFillZoomRectangle(true);
//A flag that controls how the zoom rectangle is drawn.
chartPanel.setMouseWheelEnabled(true);
//Enables or disables mouse wheel support for the panel.
chartPanel.setPreferredSize(new Dimension(500, 270));
//设置图形大小
setContentPane(chartPanel);
//把图形加入rootPane中
main:
demo.pack();
//绘图
RefineryUtilities.centerFrameOnScreen(demo);
//把图形加入Frame中
demo.setVisible(true);
//显示
/* ===========================================================
* JFreeChart : a free chart library for the Java(tm) platform
* ===========================================================
*
* (C) Copyright 2000-2009, by Object Refinery Limited and Contributors.
*
* Project Info: http://www.jfree.org/jfreechart/index.html
*
* This library is free software; you can redistribute it and/or modify it
* under the terms of the GNU Lesser General Public License as published by
* the Free Software Foundation; either version 2.1 of the License, or
* (at your option) any later version.
*
* This library is distributed in the hope that it will be useful, but
* WITHOUT ANY WARRANTY; without even the implied warranty of MERCHANTABILITY
* or FITNESS FOR A PARTICULAR PURPOSE. See the GNU Lesser General Public
* License for more details.
*
* You should have received a copy of the GNU Lesser General Public
* License along with this library; if not, write to the Free Software
* Foundation, Inc., 51 Franklin Street, Fifth Floor, Boston, MA 02110-1301,
* USA.
*
* [Java is a trademark or registered trademark of Sun Microsystems, Inc.
* in the United States and other countries.]
*
* ------------------
* BarChartDemo1.java
* ------------------
* (C) Copyright 2003-2009, by Object Refinery Limited and Contributors.
*
* Original Author: David Gilbert (for Object Refinery Limited);
* Contributor(s): ;
*
* Changes
* -------
* 09-Mar-2005 : Version 1 (DG);
*
*/
import java.awt.Color;
import java.awt.Dimension;
import java.awt.GradientPaint;
import org.jfree.chart.ChartFactory;
import org.jfree.chart.ChartPanel;
import org.jfree.chart.JFreeChart;
import org.jfree.chart.axis.CategoryAxis;
import org.jfree.chart.axis.CategoryLabelPositions;
import org.jfree.chart.axis.NumberAxis;
import org.jfree.chart.plot.CategoryPlot;
import org.jfree.chart.plot.PlotOrientation;
import org.jfree.chart.renderer.category.BarRenderer;
import org.jfree.data.category.CategoryDataset;
import org.jfree.data.category.DefaultCategoryDataset;
import org.jfree.ui.ApplicationFrame;
import org.jfree.ui.RefineryUtilities;
/**
* A simple demonstration application showing how to create a bar chart.
*/
public class BarChartDemo1 extends ApplicationFrame {
/**
* Creates a new demo instance.
*
* @param title the frame title.
*/
public BarChartDemo1(String title) {
super(title);
CategoryDataset dataset = createDataset();
JFreeChart chart = createChart(dataset);
ChartPanel chartPanel = new ChartPanel(chart);
chartPanel.setFillZoomRectangle(true);
chartPanel.setMouseWheelEnabled(true);
chartPanel.setPreferredSize(new Dimension(500, 270));
setContentPane(chartPanel);
}
/**
* Returns a sample dataset.
*
* @return The dataset.
*/
private static CategoryDataset createDataset() {
// row keys...
String series1 = "First";
String series2 = "Second";
String series3 = "Third";
// column keys...
String category1 = "Category 1";
String category2 = "Category 2";
String category3 = "Category 3";
String category4 = "Category 4";
String category5 = "Category 5";
// create the dataset...
DefaultCategoryDataset dataset = new DefaultCategoryDataset();
dataset.addValue(1.0, series1, category1);
dataset.addValue(4.0, series1, category2);
dataset.addValue(3.0, series1, category3);
dataset.addValue(5.0, series1, category4);
dataset.addValue(5.0, series1, category5);
dataset.addValue(5.0, series2, category1);
dataset.addValue(7.0, series2, category2);
dataset.addValue(6.0, series2, category3);
dataset.addValue(8.0, series2, category4);
dataset.addValue(4.0, series2, category5);
dataset.addValue(4.0, series3, category1);
dataset.addValue(3.0, series3, category2);
dataset.addValue(2.0, series3, category3);
dataset.addValue(3.0, series3, category4);
dataset.addValue(6.0, series3, category5);
return dataset;
}
/**
* Creates a sample chart.
*
* @param dataset the dataset.
*
* @return The chart.
*/
private static JFreeChart createChart(CategoryDataset dataset) {
// create the chart...
JFreeChart chart = ChartFactory.createBarChart(
"Bar Chart Demo 1", // chart title
"Category", // domain axis label
"Value", // range axis label
dataset, // data
PlotOrientation.VERTICAL, // orientation
true, // include legend
true, // tooltips?
false // URLs?
);
// NOW DO SOME OPTIONAL CUSTOMISATION OF THE CHART...
// set the background color for the chart...
chart.setBackgroundPaint(Color.white);
// get a reference to the plot for further customisation...
CategoryPlot plot = (CategoryPlot) chart.getPlot();
// ******************************************************************
// More than 150 demo applications are included with the JFreeChart
// Developer Guide...for more information, see:
//
// > http://www.object-refinery.com/jfreechart/guide.html
//
// ******************************************************************
// set the range axis to display integers only...
NumberAxis rangeAxis = (NumberAxis) plot.getRangeAxis();
rangeAxis.setStandardTickUnits(NumberAxis.createIntegerTickUnits());
// disable bar outlines...
BarRenderer renderer = (BarRenderer) plot.getRenderer();
renderer.setDrawBarOutline(false);
// set up gradient paints for series...
GradientPaint gp0 = new GradientPaint(0.0f, 0.0f, Color.blue,
0.0f, 0.0f, new Color(0, 0, 64));
GradientPaint gp1 = new GradientPaint(0.0f, 0.0f, Color.green,
0.0f, 0.0f, new Color(0, 64, 0));
GradientPaint gp2 = new GradientPaint(0.0f, 0.0f, Color.red,
0.0f, 0.0f, new Color(64, 0, 0));
renderer.setSeriesPaint(0, gp0);
renderer.setSeriesPaint(1, gp1);
renderer.setSeriesPaint(2, gp2);
CategoryAxis domainAxis = plot.getDomainAxis();
domainAxis.setCategoryLabelPositions(
CategoryLabelPositions.createUpRotationLabelPositions(
Math.PI / 6.0));
// OPTIONAL CUSTOMISATION COMPLETED.
return chart;
}
/**
* Starting point for the demonstration application.
*
* @param args ignored.
*/
public static void main(String[] args) {
BarChartDemo1 demo = new BarChartDemo1("Bar Chart Demo 1");
demo.pack();
RefineryUtilities.centerFrameOnScreen(demo);
demo.setVisible(true);
}
}


 271
271


 被折叠的 条评论
为什么被折叠?
被折叠的 条评论
为什么被折叠?
 到【灌水乐园】发言


