


前提:服务器上已安装docker-compose,未安装的可以参考相关文章进行安装
主要步骤
1. 进入目标环境创建安装目录(具体可按照所在服务器安装目录风格选择对应文件夹)
cd /apps
mkdir {/prometheus+grafana,prometheus+grafana/prometheus,prometheus+grafana/grafana}
2. 创建prometheus配置文件
cd prometheus
vim prometheus.yml
# 可参考 https://prometheus.io/docs/prometheus/latest/getting_started
global:
  scrape_interval: 10s
  scrape_timeout: 10s
  evaluation_interval: 10m

scrape_configs:
  # prometheus
  - job_name: prometheus
    static_configs:
      - targets: ['localhost:9090'] ## 修改成服务器ip即可
        labels:
          instance: prometheus
3. 创建docker-compose文件
cd ..
vim docker-compose-prometheus-grafana.yml
version: 3

# 服务
services:
  # prometheus
  prometheus:
    image: prom/prometheus:latest
    container_name: prometheus
    restart: unless-stopped
    volumes:
      - ./prometheus/prometheus.yml:/etc/prometheus/prometheus.yml
    command: "--config.file=/etc/prometheus/prometheus.yml --storage.tsdb.path=/prometheus"
    ports:
      - "9090:9090"
    networks:
      prometheus:
        ipv4_address: 172.22.0.11

  # 监控告警WEB UI 配合prometheus使用
  # https://grafana.com/docs/grafana/latest/installation/docker
  grafana:
    image: grafana/grafana:latest
    container_name: prometheus-grafana
    restart: unless-stopped
    ports:
      - "3000:3000"
    volumes:
      - "./grafana/grafana.ini:/etc/grafana/grafana.ini" # 初始化配置(可设置一些告警邮箱等)
    environment:
      GF_EXPLORE_ENABLED: "true"
      # 初始账号密码:admin/admin
      GF_SECURITY_ADMIN_PASSWORD: "admin"
      GF_INSTALL_PLUGINS: "grafana-clock-panel,grafana-simple-json-datasource,alexanderzobnin-zabbix-app"
      # 持久化到mysql数据库
      GF_DATABASE_URL: "mysql://root:root@localhost:3306/grafana" # TODO 待修改处(只需创建目标数据库,grafana在启动时会自动初始化相关表)
    depends_on:
      - prometheus
    networks:
      prometheus:
        ipv4_address: 172.22.0.22

# 网桥
networks:
  prometheus:
    ipam:
      driver: default
      config:
        - subnet: "172.22.0.0/24"
4.启动docker-compose
docker-compose -f docker-compose-prometheus-grafana.yml up -d

5.检查启动容器启动状态
docker-compose -f docker-compose-prometheus-grafana.yml ps

6.浏览器进入grafana web界面: http://localhost:3000 (可切换成服务器ip) 账号密码为admin/admin
(一般初次启动会慢一些,需要等待一下,如果安装在内网环境,就需要本机能访问内网权限才能看,进入之后会提示改密码,修改自定义密码即可)

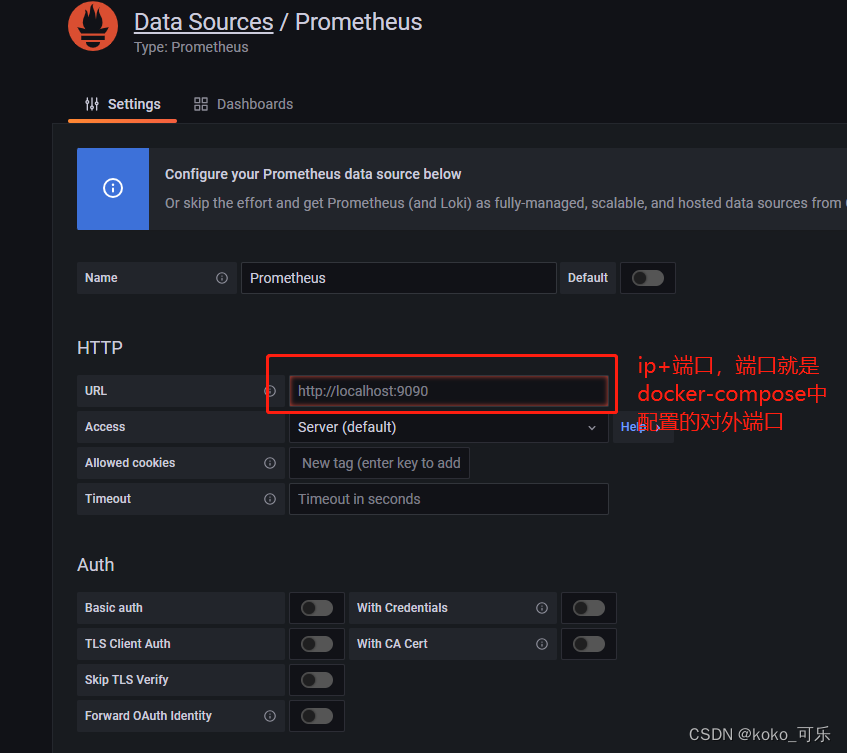
7.选择设置,进入后配置prometheus数据源

8.搜索prometheus数据源,并配置相关host等信息,点击保存,出现绿标代表连通访问prometheus了


 7325
7325


 被折叠的 条评论
为什么被折叠?
被折叠的 条评论
为什么被折叠?
 到【灌水乐园】发言


