


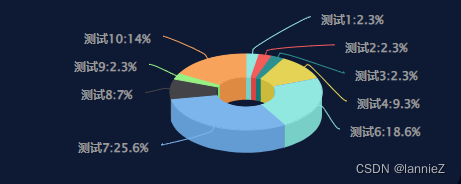
效果图:
1、通过npm下载
npm install highcharts --save
2、在main.js中引入
import highcharts from 'highcharts'
import highcharts3d from 'highcharts/highcharts-3d'
highcharts3d(highcharts)
3、使用
<div class="card">
    <div :id="id" :option="option"></div>
</div>
import HighCharts from "highcharts";
export default {
  data() {
    return {
		id: "test",
      option: {
        chart: {
          type: "pie", //饼图
          options3d: {
            enabled: true, //使用3d功能
            alpha: 60, //延y轴向内的倾斜角度
            beta: 0,
          },
          backgroundColor: 'rgba(0, 0, 0, 0)', // 不显示背景色
          width: 470,
          height: 200   //设置大小是为了饼图能在想要的区域中显示
        },
        title: {
          text: "", //图表的标题文字
        },
        subtitle: {
          text: "", //副标题文字
        },
        plotOptions: {
          pie: {
            allowPointSelect: true, //每个扇块能否选中
            cursor: "pointer", //鼠标指针
            innerSize: 60,
            depth: 35, //饼图的厚度
            dataLabels: {
              enabled: true, //是否显示饼图的线形tip
              distance: 20,//设置引导线的长度
              color: '#999',//全局设置字体颜色
              style: {
                textOutline: 'none',        //去掉文字白边
                fontSize: '12'
              },
              formatter: function() {
                return (
                  this.point.name + this.y + '%'
                )
              }
            },
          },
        },
        credits: {
          enabled: false    //禁用版权url    此处不设置
        },
        series: [
          {
            type: "pie",
            name: "", //统一的前置词,非必须
            data: [
              { name: '测试1:', y: 2.3, color: 'rgb(145, 232, 225)' },
              { name: '测试2:', y: 2.3, color: 'rgb(244, 91, 91)' },
              { name: '测试3:', y: 2.3, color: 'rgb(43, 144, 143)' },
              { name: '测试4:', y: 9.3, color: 'rgb(228, 211, 84)' },
              { name: '测试5:', y: 0.0, color: 'rgb(128, 133, 233)' },
              { name: '测试6:', y: 18.6, color: 'rgb(145, 232, 225)' },
              { name: '测试7:', y: 25.6, color: 'rgb(124, 181, 236)' },
              { name: '测试8:', y: 7.0, color: 'rgb(67, 67, 72)' },
              { name: '测试9:', y: 2.3, color: 'rgb(151, 241, 130)' },
              { name: '测试10:', y: 14, color: 'rgb(247, 163, 92)' }
            ],
          },
        ]
      },
	},
	mounted() {
		highcharts.chart(this.id, this.option)
	}
  }
}
.card {
   width: 100%;
   height: 200px;
}


 208
208


 被折叠的 条评论
为什么被折叠?
被折叠的 条评论
为什么被折叠?
 到【灌水乐园】发言


