


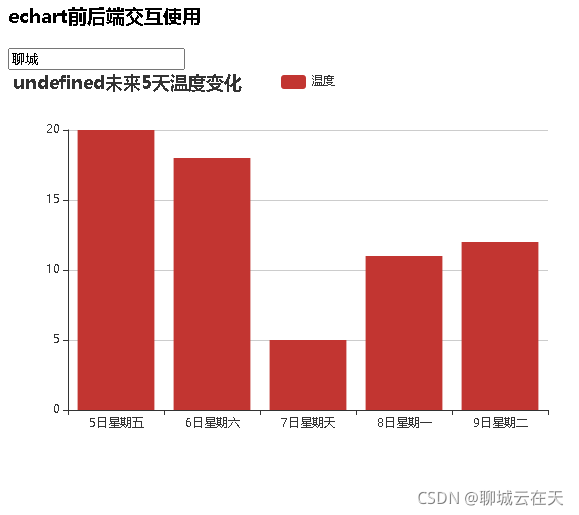
使用vue+echarts显示天气预报最高温度案例
天气预报接口:http://wthrcdn.etouch.cn/weather_mini?city=聊城
{“data”:{“yesterday”:{“date”:“4日星期四”,“high”:“高温 20℃”,“fx”:“南风”,“low”:“低温 12℃”,“fl”:"<![CDATA[3级]]>",“type”:“霾”},“city”:“聊城”,“forecast”:[{“date”:“5日星期五”,“high”:“高温 20℃”,“fengli”:"<![CDATA[2级]]>",“low”:“低温 6℃”,“fengxiang”:“东南风”,“type”:“霾”},{“date”:“6日星期六”,“high”:“高温 18℃”,“fengli”:"<![CDATA[2级]]>",“low”:“低温 2℃”,“fengxiang”:“南风”,“type”:“中雨”},{“date”:“7日星期天”,“high”:“高温 5℃”,“fengli”:"<![CDATA[4级]]>",“low”:“低温 0℃”,“fengxiang”:“北风”,“type”:“小雪”},{“date”:“8日星期一”,“high”:“高温 11℃”,“fengli”:"<![CDATA[2级]]>",“low”:“低温 0℃”,“fengxiang”:“西风”,“type”:“晴”},{“date”:“9日星期二”,“high”:“高温 12℃”,“fengli”:"<![CDATA[2级]]>",“low”:“低温 1℃”,“fengxiang”:“西北风”,“type”:“晴”}],“ganmao”:“感冒易发期,外出请适当调整衣物,注意补充水分。”,“wendu”:“20”},“status”:1000,“desc”:“OK”}
使用vue+echars显示未来5天最高温度
<html lang="en">
<head>
    <meta charset="UTF-8">
    <meta http-equiv="X-UA-Compatible" content="IE=edge">
    <meta name="viewport" content="width=device-width, initial-scale=1.0">
    <title>Document</title>
    <script src="../js/vue.js"></script>
    <script src="../js/echarts.js"></script>
    <script src="../js/axios.js"></script>
</head>
<body>
    <div id="app">
        <h3>echart前后端交互使用</h3>
        <input type="text" v-model="city" v-on:keyup.enter="initChart">

        <div id="main" style="width: 600px;height:400px;"></div>
    </div>
    <script>
        let vm= new Vue({
             el:"#app",
             data:{
                 city:"聊城",
                 labList:[],
                 viewList:[],
                 test:this.city,
                 option:{
                        title: {
                            text: ''
                        },
                        tooltip: {},
                        legend: {
                            data:['温度']
                        },
                        xAxis: {
                            data: []
                        },
                        yAxis: {},
                        series: [{
                            name: '温度',
                            type: 'bar',
                            data: []
                        }]
                    }

             },
             mounted() {
                this.initChart();
             },
             methods: {

                 initChart(){
                    var myChart = echarts.init(document.getElementById('main'));
                    this.option.title.text=this.city+"未来5天的温度变化"
                    axios.get("http://wthrcdn.etouch.cn/weather_mini?city="+this.city)
                            .then((res)=>{
                                console.log('访问后台');
                                // console.log(res.data);
                                //得到未来5天的温度
                                this.labList=res.data.data.forecast;
                                this.option.xAxis.data=[]
                                this.option.series[0].data=[]
                                //遍历未来5天的温度
                                this.labList.forEach(element => {
                                    //把非数字内容去掉,只保留数字
                                    highnum=element.high.replace(/[^0-9]/ig,"")
                                    //获取日期
                                    mydate=element.date
                                    //把日期赋值给xAxis中的data数组
                                    this.option.xAxis.data.push(mydate)
                                    //把温度值赋值给series中的data数组
                                    this.option.series[0].data.push(highnum)

                                    // console.log(highnum)

                                });
                                 // 使用刚指定的配置项和数据显示图表。
                                 myChart.setOption(this.option);

                            }
                            );


            },

             },
         })

      </script>
</body>
</html>


 317
317

 被折叠的 条评论
为什么被折叠?
被折叠的 条评论
为什么被折叠?
 到【灌水乐园】发言


