


一: ANR怎么去分析?
1).ANR出现的原因
a. 主线程频繁进行耗时的IO操作:如数据库读写
b. 多线程操作的死锁,主线程被block;
c. 主线程被Binder 对端block;
d. System Server中WatchDog出现ANR;
e. service binder的连接达到上线无法和和System Server通信
f. 系统资源已耗尽(管道、CPU、IO)
2). 分析步骤
1. 定位发生 ANR 时间点
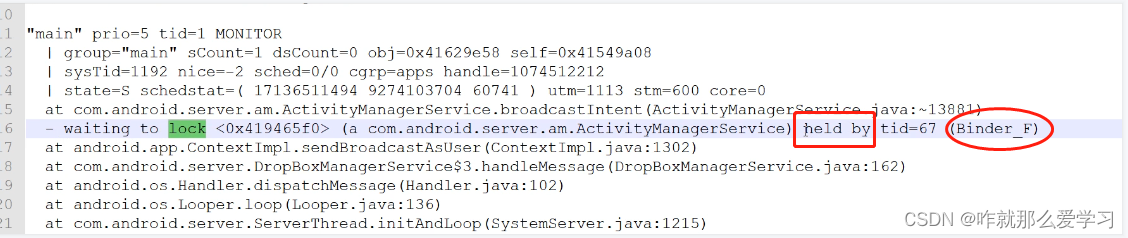
2. 查看 trace 信息 (eventlog搜 am_anr; applog 搜 ANR in; 锁 held by)
3. 分析是否有耗时的 message,binder 调用,锁的竞争, CPU 资源的抢占
4. 结合具体的业务场景的上下文来分析
3). 结合案例分析
1)看 ANR 类型,确认分析范围
先找 ANR 原因,主要是看 Reason 这一行,对于不同的 ANR 类型,Reason 的内容会有所区别。比如
Input dispatching timed out 表示 ANR 是 Input 派发超时导致,
executing service com.xx.xxx 表示是 Service 创建超时导致,
通过 Reason 这一行可以定位到 ANR 类型,进而判定超时阈值是多少,比如本次 ANR 是 Input 导致,Input 超时时间是 5s,这个可以进一步帮我们缩小问题分析的时间范围。
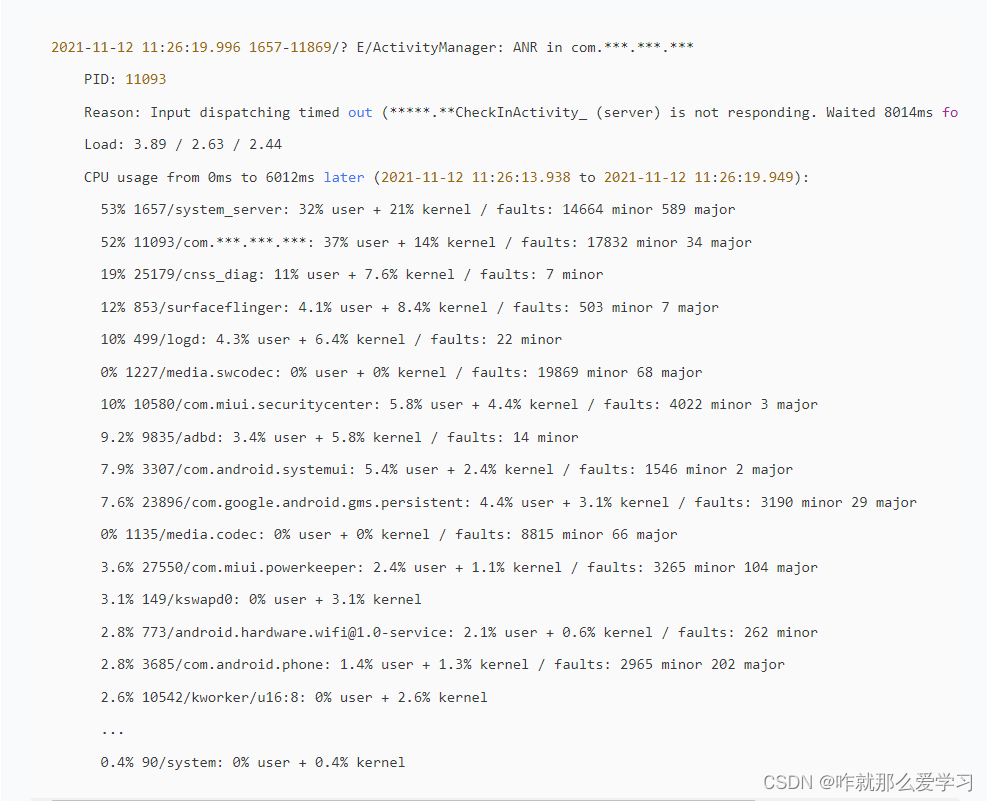
2)看 CPU LOAD Average 数据
Load: 3.89 2.63 2.44
表示过去 1、5、15 分钟内的,正在使用或者等待使用 CPU(处于 Run queue 或 Ready queue)的进程数的平均值。
在一般 Linux 标准下,单核 CPU 通常以 70 分位数为分水岭,也即 <0.7
为理想负载,多核 CPU 则需乘以对应核心数,但现代 Android 设备一般对多进程都有智能调度策略,例如自动冻结后台进程,或者对后台进程只定时分配少量 CPU 时间等,此时高 Load 也未必代表设备遇到性能瓶颈,某些设备其 Load average 经常维持在 40+,但依然响应流畅,CPU 使用率也不高,基于此,我们无法单纯为 Load average 定义一个绝对的判断公式。
在分析 ANR 问题时,更多是看该值有无明显劣化的趋势,比如本次 System.log 设备使用的是一颗 8 核心 CPU,4 大核 4 小核,整体看 CPU load 并无明显异常,有轻微加重趋势,但不算严重。
3)看进程 CPU 占用率
CPU usage from 0ms to 6012ms later,
这里的 later 表示采集的 CPU 占用率数据为 ANR 发生后的数据,
除了 later还可能有 before 的字样,代表数据在 ANR 发生前采集。
注意:系统并不能保证采集 CPU 使用率的具体时间,我们查看此类日志也要区别来看,比如如果 CPU 数据为 ANR 后采集,那么 system_server的 CPU 使用率高是正常的,因为 system_server
此时需要做 dump 操作。
日志中会按照 CPU 使用率从高到低将进程信息打印出来,包括 CPU 使用率、进程号、进程名、user 和 kernel CPU 占比、页错误数。
kernel 若 CPU 占比较高,说明应用侧应该发生了大量的系统调用。一般来说,发生系统调用的多数场景都是文件 IO 操作。
从日志看,本次 ANR 发生时,11093应用进程 CPU 占比 52%,较其他进程高出不少,ANR 发生瓶颈应该与系统其他进程无关,但 user 与 kernal 占比无明显异常,主进程应该没有 IO 异常。
4)看 App 进程页错误数量
进程的 minor 和 major 代表次要页错误和主要页错误,分别表示内存与缓存的命中情况。页错误过高说明内存频繁换页,会导致分配内存与 GC 速度显著变慢。
5)看 kswapd0 进程
kswapd0 是管理虚拟内存的进程。当设备 RAM 空间被耗尽时,kswapd0
会负责将 App 进程的部分虚拟内存写入 swap 交换区,当该进程占用率很高时,往往反映设备处于低内存状态。
整体而言,通过上述 SystemLog,可以大概看出设备 ANR 发生前后的一段时间的基本状况:CPU 负载无加重趋势,kswapd0 进程只有 3.1%,无低内存场景,应用进程 52%,相比设备其他进程而言,CPU 占用率较高,但无明显 IO 异常。
此时,需要进一步借助 Looper 监控看板工具(别人写的工具),查看本次 ANR 上报的 Looper 数据。
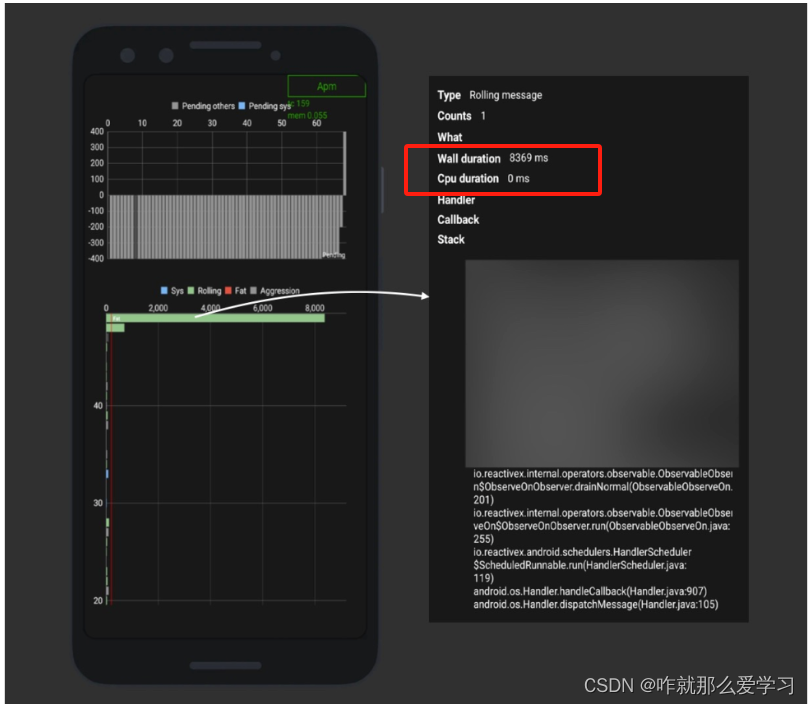
当 ANR 发生时,当前正在调度的消息耗时超过了 8s;继续看其 Wall 和 CPU Duration,可以看到 WallDuration 是 8369ms,但是 CPU 时间是 0,说明主线程在此时没有拿到时间片,可能处于阻塞状态。有可能是主线程 IO 了,或者在等待锁。
进一步通过堆栈定位到对应的业务逻辑,发现确实有死锁产生。
通过 Looper 看板工具,可以发现本次 ANR 的根源消息就是当前正在调度的信息严重耗时,解决掉该 bug 也就解决了这个 ANR。
二:ANR 的案例
1. Input dispatching timed out
``````
07-20 15:36:36.472  1000  1520  1597 I am_anr  : [0,1480,com.xxxx.moblie,952680005,Input dispatching timed out (AppWindowToken{da8f666 token=Token{5501f51 ActivityRecord{15c5c78 u0 com.xxxx.moblie/.ui.MainActivity t3862}}}, Waiting because no window has focus but there is a focused application that may eventually add a window when it finishes starting up.)]
```

从上面的log我们可以看出: 应用`com.xxxx.moblie` 在`07-20 15:36:36.472`时间,发生了一次`KeyDispatchTimeout`类型的ANR,它的进程号是`1480`. 把关键的信息整理一下:
**ANR时间**:07-20 15:36:36.472
**进程pid**:1480
**进程名**:com.xxxx.moblie
**ANR类型**:KeyDispatchTimeout

我们已经知道了发生`KeyDispatchTimeout`的ANR是因为 `input事件在5秒内没有处理完成`。那么在这个时间`07-20 15:36:36.472` 的前5秒,也就是(`15:36:30 ~15:36:31`)时间段左右程序到底做了什么事情?这个简单,因为我们已经知道pid了,再搜索一下`pid = 1480`的日志.这些日志表示该进程所运行的轨迹,关键的日志如下:

```text
07-20 15:36:29.749 10102  1480  1737 D moblie-Application: [Thread:17329] receive an intent from server, action=com.ttt.push.RECEIVE_MESSAGE
07-20 15:36:30.136 10102  1480  1737 D moblie-Application: receiving an empty message, drop
07-20 15:36:35.791 10102  1480  1766 I Adreno  : QUALCOMM build                   : 9c9b012, I92eb381bc9
07-20 15:36:35.791 10102  1480  1766 I Adreno  : Build Date                       : 12/31/17
07-20 15:36:35.791 10102  1480  1766 I Adreno  : OpenGL ES Shader Compiler Version: EV031.22.00.01
07-20 15:36:35.791 10102  1480  1766 I Adreno  : Local Branch                     :
07-20 15:36:35.791 10102  1480  1766 I Adreno  : Remote Branch                    : refs/tags/AU_LINUX_ANDROID_LA.UM.6.4.R1.08.00.00.309.049
07-20 15:36:35.791 10102  1480  1766 I Adreno  : Remote Branch                    : NONE
07-20 15:36:35.791 10102  1480  1766 I Adreno  : Reconstruct Branch               : NOTHING
07-20 15:36:35.826 10102  1480  1766 I vndksupport: sphal namespace is not configured for this process. Loading /vendor/lib64/hw/gralloc.msm8998.so from the current namespace instead.
07-20 15:36:36.682 10102  1480  1480 W ViewRootImpl[MainActivity]: Cancelling event due to no window focus: KeyEvent { action=ACTION_UP, keyCode=KEYCODE_PERIOD, scanCode=0, metaState=0, flags=0x28, repeatCount=0, eventTime=16099429, downTime=16099429, deviceId=-1, source=0x101 }
```

从上面我们可以知道,在时间 07-20 15:36:29.749 程序收到了一个action消息。

```text
07-20 15:36:29.749 10102  1480  1737 D moblie-Application: [Thread:17329] receive an intent from server, action=com.ttt.push.RECEIVE_MESSAGE。
```

原来是应用`com.xxxx.moblie` 收到了一个推送消息(`com.ttt.push.RECEIVE_MESSAGE`)导致了阻塞,我们再串联一下目前所获取到的信息:在时间`07-20 15:36:29.749` 应用`com.xxxx.moblie` 收到了一下推送信息`action=com.ttt.push.RECEIVE_MESSAGE`发生阻塞,5秒后发生了`KeyDispatchTimeout的ANR`。

虽然知道了是怎么开始的,但是具体原因还没有找到,是不是当时CPU很紧张、各路APP再抢占资源? 我们再看看CPU的信息,。搜索关键字关键字: `ANR IN`
```text
07-20 15:36:58.711  1000  1520  1597 E ActivityManager: ANR in com.xxxx.moblie (com.xxxx.moblie/.ui.MainActivity) (进程名)
07-20 15:36:58.711  1000  1520  1597 E ActivityManager: PID: 1480 (进程pid)
07-20 15:36:58.711  1000  1520  1597 E ActivityManager: Reason: Input dispatching timed out (AppWindowToken{da8f666 token=Token{5501f51 ActivityRecord{15c5c78 u0 com.xxxx.moblie/.ui.MainActivity t3862}}}, Waiting because no window has focus but there is a focused application that may eventually add a window when it finishes starting up.)
07-20 15:36:58.711  1000  1520  1597 E ActivityManager: Load: 0.0 / 0.0 / 0.0 (Load表明是1分钟,5分钟,15分钟CPU的负载)
07-20 15:36:58.711  1000  1520  1597 E ActivityManager: CPU usage from 20ms to 20286ms later (2018-07-20 15:36:36.170 to 2018-07-20 15:36:56.436):
07-20 15:36:58.711  1000  1520  1597 E ActivityManager:   42% 6774/pressure: 41% user + 1.4% kernel / faults: 168 minor
07-20 15:36:58.711  1000  1520  1597 E ActivityManager:   34% 142/kswapd0: 0% user + 34% kernel
07-20 15:36:58.711  1000  1520  1597 E ActivityManager:   31% 1520/system_server: 13% user + 18% kernel / faults: 58724 minor 1585 major
07-20 15:36:58.711  1000  1520  1597 E ActivityManager:   13% 29901/com.ss.android.article.news: 7.7% user + 6% kernel / faults: 56007 minor 2446 major
07-20 15:36:58.711  1000  1520  1597 E ActivityManager:   13% 32638/com.android.quicksearchbox: 9.4% user + 3.8% kernel / faults: 48999 minor 1540 major
07-20 15:36:58.711  1000  1520  1597 E ActivityManager:   11% (CPU的使用率)1480/com.xxxx.moblie: 5.2%(用户态的使用率) user + (内核态的使用率) 6.3% kernel / faults: 76401 minor 2422 major
07-20 15:36:58.711  1000  1520  1597 E ActivityManager:   8.2% 21000/kworker/u16:12: 0% user + 8.2% kernel
07-20 15:36:58.711  1000  1520  1597 E ActivityManager:   0.8% 724/mtd: 0% user + 0.8% kernel / faults: 1561 minor 9 major
07-20 15:36:58.711  1000  1520  1597 E ActivityManager:   8% 29704/kworker/u16:8: 0% user + 8% kernel
07-20 15:36:58.711  1000  1520  1597 E ActivityManager:   7.9% 24391/kworker/u16:18: 0% user + 7.9% kernel
07-20 15:36:58.711  1000  1520  1597 E ActivityManager:   7.1% 30656/kworker/u16:14: 0% user + 7.1% kernel
07-20 15:36:58.711  1000  1520  1597 E ActivityManager:   7.1% 9998/kworker/u16:4: 0% user + 7.1% kernel
```

我已经在log 中标志了相关的含义。`com.xxxx.moblie` 占用了11%的CPU,其实这并不算多。现在的手机基本都是多核CPU。假如你的CPU是4核,那么上限是400%,以此类推。

既然不是CPU负载的原因,那么到底是什么原因呢? 这时就要看我们的终极大杀器——`traces.txt`。
traces.txt 日志分析


当APP不响应、响应慢了、或者WatchDog的监视没有得到回应时,系统就会dump出一个`traces.txt`文件,存放在文件目录:`/data/anr/traces.txt`,通过traces文件,我们可以拿到线程名、堆栈信息、线程当前状态、binder call等信息。
通过adb命令拿到该文件:`adb pull /data/anr/traces.txt`
trace: Cmd line:com.xxxx.moblie

```text
"main" prio=5 tid=1 Runnable
  | group="main" sCount=0 dsCount=0 obj=0x73bcc7d0 self=0x7f20814c00
  | sysTid=20176 nice=-10 cgrp=default sched=0/0 handle=0x7f251349b0
  | state=R schedstat=( 0 0 0 ) utm=12 stm=3 core=5 HZ=100
  | stack=0x7fdb75e000-0x7fdb760000 stackSize=8MB
  | held mutexes= "mutator lock"(shared held)
  // java 堆栈调用信息,可以查看调用的关系,定位到具体位置
  at ttt.push.InterceptorProxy.addMiuiApplication(InterceptorProxy.java:77)
  at ttt.push.InterceptorProxy.create(InterceptorProxy.java:59)
  at android.app.Activity.onCreate(Activity.java:1041)
  at miui.app.Activity.onCreate(SourceFile:47)
  at com.xxxx.moblie.ui.b.onCreate(SourceFile:172)
  at com.xxxx.moblie.ui.MainActivity.onCreate(SourceFile:68)
  at android.app.Activity.performCreate(Activity.java:7050)
  at android.app.Instrumentation.callActivityOnCreate(Instrumentation.java:1214)
  at android.app.ActivityThread.performLaunchActivity(ActivityThread.java:2807)
  at android.app.ActivityThread.handleLaunchActivity(ActivityThread.java:2929)
  at android.app.ActivityThread.-wrap11(ActivityThread.java:-1)
  at android.app.ActivityThread$H.handleMessage(ActivityThread.java:1618)
  at android.os.Handler.dispatchMessage(Handler.java:105)
  at android.os.Looper.loop(Looper.java:171)
  at android.app.ActivityThread.main(ActivityThread.java:6699)
  at java.lang.reflect.Method.invoke(Native method)
  at com.android.internal.os.Zygote$MethodAndArgsCaller.run(Zygote.java:246)
  at com.android.internal.os.ZygoteInit.main(ZygoteInit.java:783)
```

我详细解析一下`traces.txt`里面的一些字段,看看它到底能给我们提供什么信息.
**main**:main标识是主线程,如果是线程,那么命名成“Thread-X”的格式,x表示线程id,逐步递增。
**prio**:线程优先级,默认是5
**tid**:tid不是线程的id,是线程唯一标识ID
**group**:是线程组名称
**sCount**:该线程被挂起的次数
**dsCount**:是线程被调试器挂起的次数
**obj**:对象地址
**self**:该线程Native的地址
**sysTid**:是线程号(主线程的线程号和进程号相同)
**nice**:是线程的调度优先级
**sched**:分别标志了线程的调度策略和优先级
**cgrp**:调度归属组
**handle**:线程处理函数的地址。
**state**:是调度状态
**schedstat**:从 `/proc/[pid]/task/[tid]/schedstat`读出,三个值分别表示线程在cpu上执行的时间、线程的等待时间和线程执行的时间片长度,不支持这项信息的三个值都是0;
**utm**:是线程用户态下使用的时间值(单位是jiffies)
**stm**:是内核态下的调度时间值
**core**:是最后执行这个线程的cpu核的序号。

Java的堆栈信息是我们最关心的,它能够定位到具体位置。从上面的traces,我们可以判断`ttt.push.InterceptorProxy.addMiuiApplication(InterceptorProxy.java:77) 导致了`com.xxxx.moblie`发生了ANR。这时候可以对着源码查看,找到出问题,并且解决它。

总结一下这分析流程:首先我们搜索`am_anr`,找到出现ANR的时间点、进程PID、ANR类型、然后再找搜索`PID`,找前5秒左右的日志。过滤ANR IN 查看CPU信息,接着查看`traces.txt`,找到java的堆栈信息定位代码位置,最后查看源码,分析与解决问题。这个过程基本能找到发生ANR的来龙去脉。
2. 主线程被其他线程lock, 导致死锁
```
waiting on <0x1cd570> (a android.os.MessageQueue)
DALVIK THREADS:
"main" prio=5 tid=3 TIMED_WAIT
  | group="main" sCount=1 dsCount=0 s=0 obj=0x400143a8
  | sysTid=691 nice=0 sched=0/0 handle=-1091117924
  at java.lang.Object.wait(Native Method)
  - waiting on <0x1cd570> (a android.os.MessageQueue)
  at java.lang.Object.wait(Object.java:195)
  at android.os.MessageQueue.next(MessageQueue.java:144)
  at android.os.Looper.loop(Looper.java:110)
  at android.app.ActivityThread.main(ActivityThread.java:3742)
  at java.lang.reflect.Method.invokeNative(Native Method)
  at java.lang.reflect.Method.invoke(Method.java:515)
  at com.android.internal.os.ZygoteInit$MethodAndArgsCaller.run(ZygoteInit.java:739)
  at com.android.internal.os.ZygoteInit.main(ZygoteInit.java:497)
  at dalvik.system.NativeStart.main(Native Method)

"Binder Thread #3" prio=5 tid=15 NATIVE
  | group="main" sCount=1 dsCount=0 s=0 obj=0x434e7758
  | sysTid=734 nice=0 sched=0/0 handle=1733632
  at dalvik.system.NativeStart.run(Native Method)

"Binder Thread #2" prio=5 tid=13 NATIVE
  | group="main" sCount=1 dsCount=0 s=0 obj=0x1cd570
  | sysTid=696 nice=0 sched=0/0 handle=1369840
  at dalvik.system.NativeStart.run(Native Method)

"Binder Thread #1" prio=5 tid=11 NATIVE
  | group="main" sCount=1 dsCount=0 s=0 obj=0x433aca10
  | sysTid=695 nice=0 sched=0/0 handle=1367448
  at dalvik.system.NativeStart.run(Native Method)

----- end 691 -----
```
3. 主线程做耗时操作, 比如数据库读写 database
```text
"main" prio=5 tid=1 Native
held mutexes=
kernel: (couldn't read /proc/self/task/11003/stack)
native: #00 pc 000492a4 /system/lib/libc.so (nanosleep+12)
native: #01 pc 0002dc21 /system/lib/libc.so (usleep+52)
native: #02 pc 00009cab /system/lib/libsqlite.so (???)
native: #03 pc 00011119 /system/lib/libsqlite.so (???)
native: #04 pc 00016455 /system/lib/libsqlite.so (???)
native: #16 pc 0000fa29 /system/lib/libsqlite.so (???)
native: #17 pc 0000fad7 /system/lib/libsqlite.so (sqlite3_prepare16_v2+14)
native: #18 pc 0007f671 /system/lib/libandroid_runtime.so (???)
native: #19 pc 002b4721 /system/framework/arm/boot-framework.oat (Java_android_database_sqlite_SQLiteConnection_nativePrepareStatement__JLjava_lang_String_2+116)
at android.database.sqlite.SQLiteConnection.setWalModeFromConfiguration(SQLiteConnection.java:294)
at android.database.sqlite.SQLiteConnection.open(SQLiteConnection.java:215)
at android.database.sqlite.SQLiteConnection.open(SQLiteConnection.java:193)
at android.database.sqlite.SQLiteConnectionPool.openConnectionLocked(SQLiteConnectionPool.java:463)
at android.database.sqlite.SQLiteConnectionPool.open(SQLiteConnectionPool.java:185)
at android.database.sqlite.SQLiteConnectionPool.open(SQLiteConnectionPool.java:177)
at android.database.sqlite.SQLiteDatabase.openInner(SQLiteDatabase.java:808)
locked <0x0db193bf> (a java.lang.Object)
at android.database.sqlite.SQLiteDatabase.open(SQLiteDatabase.java:793)
at android.database.sqlite.SQLiteDatabase.openDatabase(SQLiteDatabase.java:696)
at android.app.ContextImpl.openOrCreateDatabase(ContextImpl.java:690)
at android.content.ContextWrapper.openOrCreateDatabase(ContextWrapper.java:299)
at android.database.sqlite.SQLiteOpenHelper.getDatabaseLocked(SQLiteOpenHelper.java:223)
at android.database.sqlite.SQLiteOpenHelper.getWritableDatabase(SQLiteOpenHelper.java:163)
locked <0x045a4a8c> (a com.xxxx.video.common.data.DataBaseHelper)
at com.xxxx.video.common.data.DataBaseORM.<init>(DataBaseORM.java:46)
at com.xxxx.video.common.data.DataBaseORM.getInstance(DataBaseORM.java:53)
locked <0x017095d5> (a java.lang.Class<com.xxxx.video.common.data.DataBaseORM>)
4. binder 数据量过大
```text
07-21 04:43:21.573  1000  1488 12756 E Binder  : Unreasonably large binder reply buffer: on android.content.pm.BaseParceledListSlice$1@770c74f calling 1 size 388568 (data: 1, 32, 7274595)
07-21 04:43:21.573  1000  1488 12756 E Binder  : android.util.Log$TerribleFailure: Unreasonably large binder reply buffer: on android.content.pm.BaseParceledListSlice$1@770c74f calling 1 size 388568 (data: 1, 32, 7274595)
07-21 04:43:21.607  1000  1488  2951 E Binder  : Unreasonably large binder reply buffer: on android.content.pm.BaseParceledListSlice$1@770c74f calling 1 size 211848 (data: 1, 23, 7274595)
07-21 04:43:21.607  1000  1488  2951 E Binder  : android.util.Log$TerribleFailure: Unreasonably large binder reply buffer: on android.content.pm.BaseParceledListSlice$1@770c74f calling 1 size 211848 (data: 1, 23, 7274595)
07-21 04:43:21.662  1000  1488  6258 E Binder  : Unreasonably large binder reply buffer: on android.content.pm.BaseParceledListSlice$1@770c74f calling 1 size 259300 (data: 1, 33, 7274595)
```
5. binder 通信失败
```text
07-21 06:04:35.580 <6>[32837.690321] binder: 1698:2362 transaction failed 29189/-3, size 100-0 line 3042
07-21 06:04:35.594 <6>[32837.704042] binder: 1765:4071 transaction failed 29189/-3, size 76-0 line 3042
07-21 06:04:35.899 <6>[32838.009132] binder: 1765:4067 transaction failed 29189/-3, size 224-8 line 3042
07-21 06:04:36.018 <6>[32838.128903] binder: 1765:2397 transaction failed 29189/-22, size 348-0 line 2916
```


 6053
6053


 被折叠的 条评论
为什么被折叠?
被折叠的 条评论
为什么被折叠?
 到【灌水乐园】发言


