


目录
脚本的形式
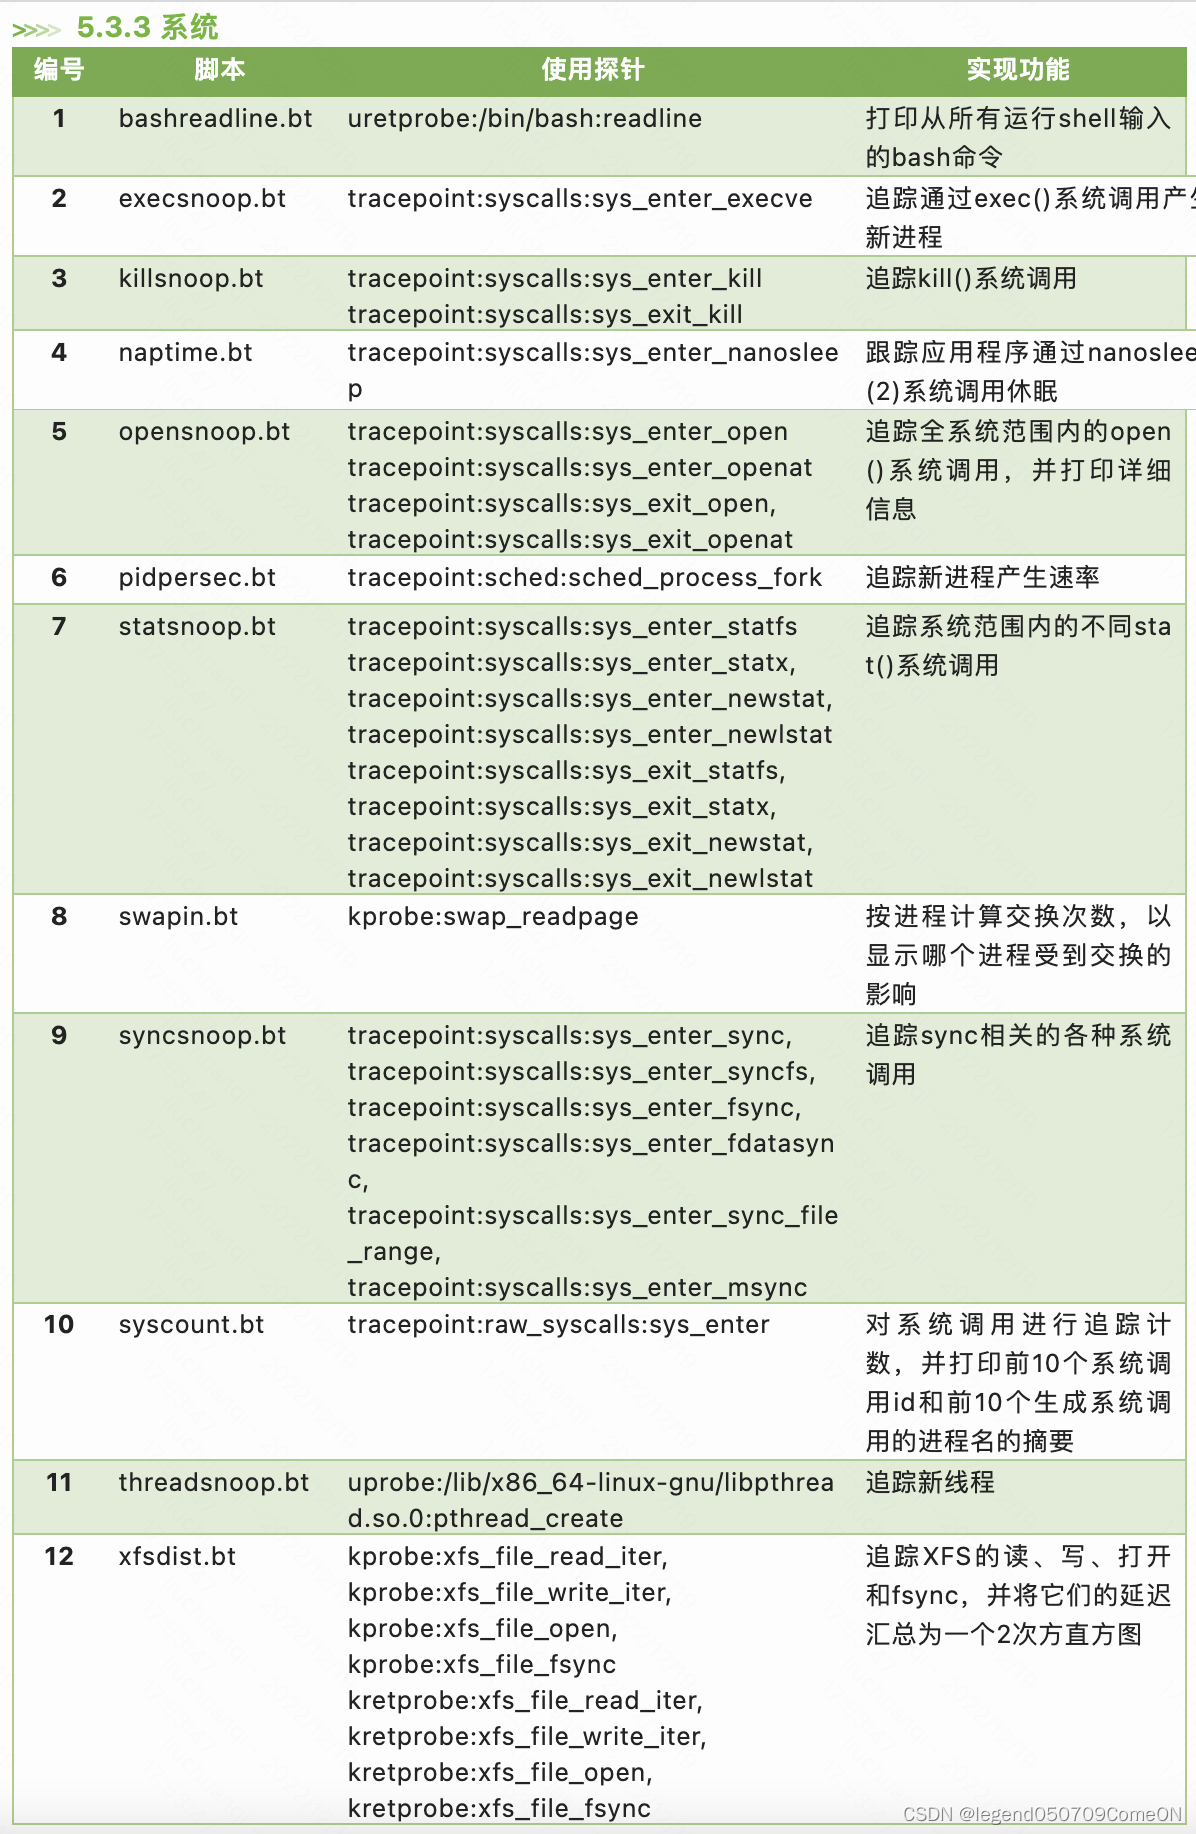
主要分为几类:
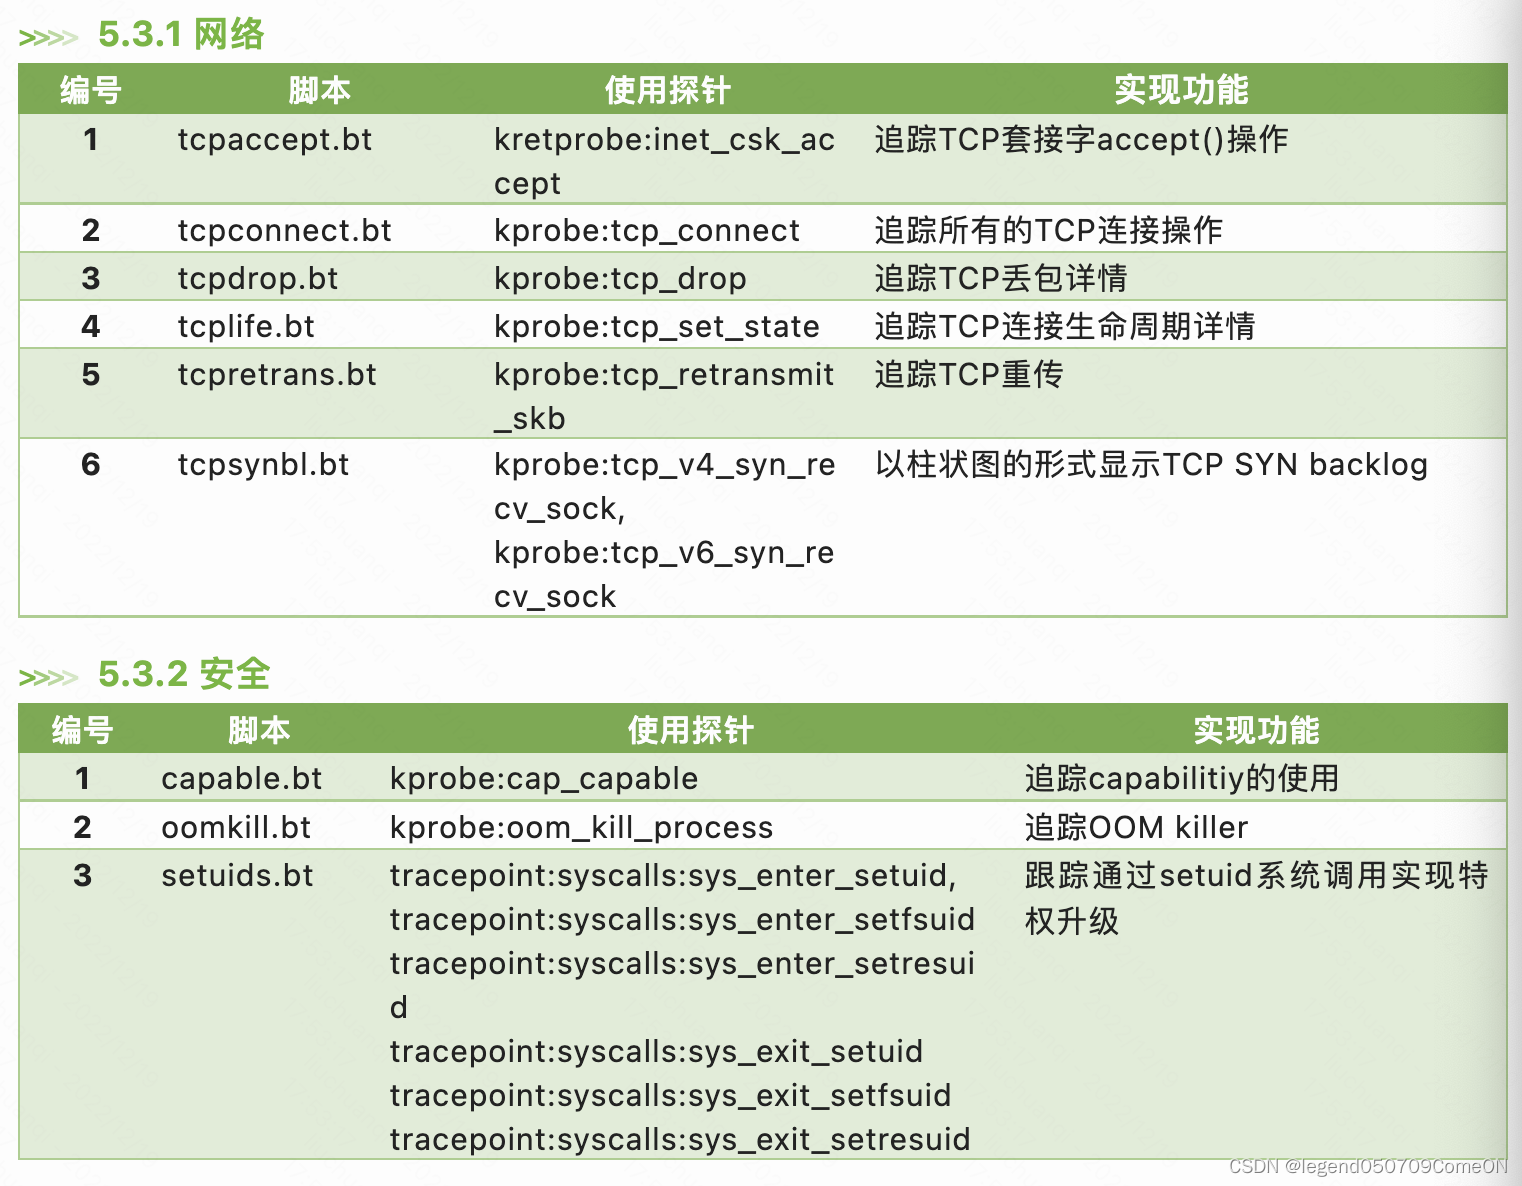
 ## TCP连接追踪
#!/usr/bin/env bpftrace
/*
 * tcpconnect.bt  Trace TCP connect()s.
 *                For Linux, uses bpftrace and eBPF.
 *
 * USAGE: tcpconnect.bt
 *
 * This is a bpftrace version of the bcc tool of the same name.
 * It is limited to ipv4 addresses.
 *
 * All connection attempts are traced, even if they ultimately fail.
 *
 * This uses dynamic tracing of kernel functions, and will need to be updated
 * to match kernel changes.
 *
 * Copyright (c) 2018 Dale Hamel.
 * Licensed under the Apache License, Version 2.0 (the "License")
 *
 * 23-Nov-2018	Dale Hamel	created this.
 */

#ifndef BPFTRACE_HAVE_BTF
#include <linux/socket.h>
#include <net/sock.h>
#else
#include <sys/socket.h>
#endif

BEGIN
{
  printf("Tracing tcp connections. Hit Ctrl-C to end.\n");
  printf("%-8s %-8s %-16s ", "TIME", "PID", "COMM");
  printf("%-39s %-6s %-39s %-6s\n", "SADDR", "SPORT", "DADDR", "DPORT");
}

kprobe:tcp_connect
{
  $sk = ((struct sock *) arg0);
  $inet_family = $sk->__sk_common.skc_family;

  if ($inet_family == AF_INET || $inet_family == AF_INET6) {
    if ($inet_family == AF_INET) {
      $daddr = ntop($sk->__sk_common.skc_daddr);
      $saddr = ntop($sk->__sk_common.skc_rcv_saddr);
    } else {
      $daddr = ntop($sk->__sk_common.skc_v6_daddr.in6_u.u6_addr8);
      $saddr = ntop($sk->__sk_common.skc_v6_rcv_saddr.in6_u.u6_addr8);
    }
    $lport = $sk->__sk_common.skc_num;
    $dport = $sk->__sk_common.skc_dport;

    // Destination port is big endian, it must be flipped
    $dport = bswap($dport);

    time("%H:%M:%S ");
    printf("%-8d %-16s ", pid, comm);
    printf("%-39s %-6d %-39s %-6d\n", $saddr, $lport, $daddr, $dport);
  }
}
# ./tcpconnect.bt
TIME     PID      COMM             SADDR          SPORT  DADDR          DPORT
00:36:45 1798396  agent            127.0.0.1      5001   10.229.20.82   56114
00:36:45 1798396  curl             127.0.0.1      10255  10.229.20.82   56606
00:36:45 3949059  nginx            127.0.0.1      8000   127.0.0.1      37780
tcp重传
#!/usr/bin/env bpftrace
/*
 * tcpretrans.bt Trace or count TCP retransmits
 *               For Linux, uses bpftrace and eBPF.
 *
 * USAGE: tcpretrans.bt
 *
 * This is a bpftrace version of the bcc tool of the same name.
 * It is limited to ipv4 addresses, and doesn't support tracking TLPs.
 *
 * This uses dynamic tracing of kernel functions, and will need to be updated
 * to match kernel changes.
 *
 * Copyright (c) 2018 Dale Hamel.
 * Licensed under the Apache License, Version 2.0 (the "License")
 *
 * 23-Nov-2018  Dale Hamel      created this.
 */

#ifndef BPFTRACE_HAVE_BTF
#include <linux/socket.h>
#include <net/sock.h>
#else
#include <sys/socket.h>
#endif

BEGIN
{
	printf("Tracing tcp retransmits. Hit Ctrl-C to end.\n");
	printf("%-8s %-8s %20s %21s %6s\n", "TIME", "PID", "LADDR:LPORT",
	    "RADDR:RPORT", "STATE");

	// See include/net/tcp_states.h:
	@tcp_states[1] = "ESTABLISHED";
	@tcp_states[2] = "SYN_SENT";
	@tcp_states[3] = "SYN_RECV";
	@tcp_states[4] = "FIN_WAIT1";
	@tcp_states[5] = "FIN_WAIT2";
	@tcp_states[6] = "TIME_WAIT";
	@tcp_states[7] = "CLOSE";
	@tcp_states[8] = "CLOSE_WAIT";
	@tcp_states[9] = "LAST_ACK";
	@tcp_states[10] = "LISTEN";
	@tcp_states[11] = "CLOSING";
	@tcp_states[12] = "NEW_SYN_RECV";
}

kprobe:tcp_retransmit_skb
{
	$sk = (struct sock *)arg0;
	$inet_family = $sk->__sk_common.skc_family;

	if ($inet_family == AF_INET || $inet_family == AF_INET6) {
		// initialize variable type:
		$daddr = ntop(0);
		$saddr = ntop(0);
		if ($inet_family == AF_INET) {
			$daddr = ntop($sk->__sk_common.skc_daddr);
			$saddr = ntop($sk->__sk_common.skc_rcv_saddr);
		} else {
			$daddr = ntop(
			    $sk->__sk_common.skc_v6_daddr.in6_u.u6_addr8);
			$saddr = ntop(
			    $sk->__sk_common.skc_v6_rcv_saddr.in6_u.u6_addr8);
		}
		$lport = $sk->__sk_common.skc_num;
		$dport = $sk->__sk_common.skc_dport;

		// Destination port is big endian, it must be flipped
		$dport = bswap($dport);

		$state = $sk->__sk_common.skc_state;
		$statestr = @tcp_states[$state];

		time("%H:%M:%S ");
		printf("%-8d %14s:%-6d %14s:%-6d %6s\n", pid, $saddr, $lport,
		    $daddr, $dport, $statestr);
	}
}

END
{
	clear(@tcp_states);
}
# bpftrace tcpretrans.bt
Attaching 3 probes...
Tracing tcp retransmits. Hit Ctrl-C to end.
TIME     PID               LADDR:LPORT           RADDR:RPORT  STATE
19:26:30 0            192.21.2.1:58324    10.44.79.156:47394  SYN_SENT
19:26:30 0            192.21.2.1:42474    10.44.79.157:47394  SYN_SENT
19:26:30 0            192.21.2.1:46554        10.0.0.1:20992  SYN_SENT
19:26:30 0            192.21.2.1:54118        10.0.0.1:20736  SYN_SENT
19:26:30 0            192.21.2.1:48272         1.1.1.1:256    SYN_SENT
19:26:30 0            192.21.2.1:56962         1.1.1.2:256    SYN_SENT
19:26:30 0            192.21.2.1:49672        10.0.0.0:20480  SYN_SENT
19:26:32 0            192.21.2.1:58324    10.44.79.156:47394  SYN_SENT
tcp accept
#!/usr/bin/env bpftrace
/*
 * tcpaccept.bt Trace TCP accept()s
 *              For Linux, uses bpftrace and eBPF.
 *
 * USAGE: tcpaccept.bt
 *
 * This is a bpftrace version of the bcc tool of the same name.
 *
 * This uses dynamic tracing of the kernel inet_csk_accept() socket function
 * (from tcp_prot.accept), and will need to be modified to match kernel changes.
 * Copyright (c) 2018 Dale Hamel.
 * Licensed under the Apache License, Version 2.0 (the "License")
 * 23-Nov-2018	Dale Hamel	created this.
 */

#ifndef BPFTRACE_HAVE_BTF
#include <linux/socket.h>
#include <net/sock.h>
#else
#include <sys/socket.h>
#endif

BEGIN
{
	printf("Tracing TCP accepts. Hit Ctrl-C to end.\n");
	printf("%-8s %-6s %-14s ", "TIME", "PID", "COMM");
	printf("%-39s %-5s %-39s %-5s %s\n", "RADDR", "RPORT", "LADDR",
	    "LPORT", "BL");
}

kretprobe:inet_csk_accept
{
	$sk = (struct sock *)retval;
	$inet_family = $sk->__sk_common.skc_family;

	if ($inet_family == AF_INET || $inet_family == AF_INET6) {
		// initialize variable type:
		$daddr = ntop(0);
		$saddr = ntop(0);
		if ($inet_family == AF_INET) {
			$daddr = ntop($sk->__sk_common.skc_daddr);
			$saddr = ntop($sk->__sk_common.skc_rcv_saddr);
		} else {
			$daddr = ntop(
			    $sk->__sk_common.skc_v6_daddr.in6_u.u6_addr8);
			$saddr = ntop(
			    $sk->__sk_common.skc_v6_rcv_saddr.in6_u.u6_addr8);
		}
		$lport = $sk->__sk_common.skc_num;
		$dport = $sk->__sk_common.skc_dport;
		$qlen  = $sk->sk_ack_backlog;
		$qmax  = $sk->sk_max_ack_backlog;

		// Destination port is big endian, it must be flipped
		$dport = bswap($dport);

		time("%H:%M:%S ");
		printf("%-6d %-14s ", pid, comm);
		printf("%-39s %-5d %-39s %-5d ", $daddr, $dport, $saddr,
		    $lport);
		printf("%d/%d\n", $qlen, $qmax);
	}
}
# bpftrace tcpaccept.bt
Attaching 2 probes...
Tracing TCP accepts. Hit Ctrl-C to end.
TIME     PID    COMM           RADDR                                   RPORT LADDR                                   LPORT BL
19:20:22 9217   falcon-agent   127.0.0.1                               64687 127.0.0.1                               1999  0/65535
19:20:23 16268  nioEventLoopGro ::ffff:127.0.0.1                        14495 ::ffff:127.0.0.1                        6604  0/128
19:20:23 3582   revelationd    127.0.0.1                               54462 127.0.0.1                               6904  0/65535
19:20:24 16268  nioEventLoopGro ::ffff:127.0.0.1                        19103 ::ffff:127.0.0.1                        6604  0/128
19:20:26 16268  nioEventLoopGro ::ffff:127.0.0.1                        20639 ::ffff:127.0.0.1                        6604  0/128
19:20:29 16268  nioEventLoopGro ::ffff:127.0.0.1                        29343 ::ffff:127.0.0.1                        6604  0/128
tcp life
#!/usr/bin/env bpftrace
/*
 * tcplife - Trace TCP session lifespans with connection details.
 *
 * See BPF Performance Tools, Chapter 10, for an explanation of this tool.
 *
 * Copyright (c) 2019 Brendan Gregg.
 * Licensed under the Apache License, Version 2.0 (the "License").
 * This was originally created for the BPF Performance Tools book
 * published by Addison Wesley. ISBN-13: 9780136554820
 * When copying or porting, include this comment.
 *
 * 17-Apr-2019  Brendan Gregg   Created this.
 */

#ifndef BPFTRACE_HAVE_BTF
#include <net/tcp_states.h>
#include <net/sock.h>
#include <linux/socket.h>
#include <linux/tcp.h>
#else
#include <sys/socket.h>
#endif

BEGIN
{
	printf("%-5s %-10s %-15s %-5s %-15s %-5s ", "PID", "COMM",
	    "LADDR", "LPORT", "RADDR", "RPORT");
	printf("%5s %5s %s\n", "TX_KB", "RX_KB", "MS");
}

kprobe:tcp_set_state
{
	$sk = (struct sock *)arg0;
	$newstate = arg1;

	/*
	 * This tool includes PID and comm context. From TCP this is best
	 * effort, and may be wrong in some situations. It does this:
	 * - record timestamp on any state < TCP_FIN_WAIT1
	 *	note some state transitions may not be present via this kprobe
	 * - cache task context on:
	 *	TCP_SYN_SENT: tracing from client
	 *	TCP_LAST_ACK: client-closed from server
	 * - do output on TCP_CLOSE:
	 *	fetch task context if cached, or use current task
	 */

	// record first timestamp seen for this socket
	if ($newstate < TCP_FIN_WAIT1 && @birth[$sk] == 0) {
		@birth[$sk] = nsecs;
	}

	// record PID & comm on SYN_SENT
	if ($newstate == TCP_SYN_SENT || $newstate == TCP_LAST_ACK) {
		@skpid[$sk] = pid;
		@skcomm[$sk] = comm;
	}

	// session ended: calculate lifespan and print
	if ($newstate == TCP_CLOSE && @birth[$sk]) {
		$delta_ms = (nsecs - @birth[$sk]) / 1e6;
		$lport = $sk->__sk_common.skc_num;
		$dport = $sk->__sk_common.skc_dport;
		$dport = bswap($dport);
		$tp = (struct tcp_sock *)$sk;
		$pid = @skpid[$sk];
		$comm = @skcomm[$sk];
		if ($comm == "") {
			// not cached, use current task
			$pid = pid;
			$comm = comm;
		}

		$family = $sk->__sk_common.skc_family;
		$saddr = ntop(0);
		$daddr = ntop(0);
		if ($family == AF_INET) {
			$saddr = ntop(AF_INET, $sk->__sk_common.skc_rcv_saddr);
			$daddr = ntop(AF_INET, $sk->__sk_common.skc_daddr);
		} else {
			// AF_INET6
			$saddr = ntop(AF_INET6,
			    $sk->__sk_common.skc_v6_rcv_saddr.in6_u.u6_addr8);
			$daddr = ntop(AF_INET6,
			    $sk->__sk_common.skc_v6_daddr.in6_u.u6_addr8);
		}
		printf("%-5d %-10.10s %-15s %-5d %-15s %-6d ", $pid,
		    $comm, $saddr, $lport, $daddr, $dport);
		printf("%5d %5d %d\n", $tp->bytes_acked / 1024,
		    $tp->bytes_received / 1024, $delta_ms);

		delete(@birth[$sk]);
		delete(@skpid[$sk]);
		delete(@skcomm[$sk]);
	}
}

END
{
	clear(@birth); clear(@skpid); clear(@skcomm);
}
# bpftrace tcplist.bt
Attaching 3 probes...
PID   COMM       LADDR           LPORT RADDR           RPORT TX_KB RX_KB MS
9181  go_keepali 192.21.2.1      45950 192.21.6.2      20480      0     0 2
16268 AgentLogge ::ffff:10.44.79.153 44480 ::ffff:10.22.87.141 52761      0     0 4
16268 AgentLogge ::ffff:10.44.79.153 44482 ::ffff:10.22.87.141 52761      0     0 4
16268 AgentLogge ::ffff:10.44.79.153 44484 ::ffff:10.22.87.141 52761      0     0 4
16268 AgentLogge ::ffff:10.44.79.153 44486 ::ffff:10.22.87.141 52761      0     0 4
9181  go_keepali 192.21.2.1      53632 192.21.6.3      20480      0     0 4
9217  falcon-age 127.0.0.1       47530 127.0.0.1       25104      0     0 0
9181  go_keepali 192.21.2.1      36818 192.21.9.3      20480      0     0 1
9181  go_keepali 192.21.2.1      54766 192.21.9.2      20480      0     0 1
9181  go_keepali 192.21.2.1      45704 192.21.6.4      20480      0     0 1
21656 30_dpvs_fn 127.0.0.1       48796 127.0.0.1       2842       0    14 5
9181  go_keepali ::ffff:127.0.0.1 6667  ::ffff:127.0.0.1 40126     14     0 5
16268 AgentLogge ::ffff:10.44.79.153 44502 ::ffff:10.22.87.141 52761      0     0 4
16268 AgentLogge ::ffff:10.44.79.153 44504 ::ffff:10.22.87.141 52761      0     0 4
16268 AgentLogge ::ffff:10.44.79.153 44506 ::ffff:10.22.87.141 52761      0     0 4
16268 AgentLogge ::ffff:10.44.79.153 44508 ::ffff:10.22.87.141 52761      0     0 4
16268 AgentLogge ::ffff:10.44.79.153 44510 ::ffff:10.22.87.141 52761      0     0 4
tcp 丢包
#!/usr/bin/env bpftrace
/*
 * tcpdrop.bt   Trace TCP kernel-dropped packets/segments.
 *              For Linux, uses bpftrace and eBPF.
 *
 * USAGE: tcpdrop.bt
 *
 * This is a bpftrace version of the bcc tool of the same name.
 * It is limited to ipv4 addresses, and cannot show tcp flags.
 *
 * This provides information such as packet details, socket state, and kernel
 * stack trace for packets/segments that were dropped via kfree_skb.
 *
 * For Linux 5.17+ (see tools/old for script for lower versions).
 *
 * Copyright (c) 2018 Dale Hamel.
 * Licensed under the Apache License, Version 2.0 (the "License")
 *
 * 23-Nov-2018	Dale Hamel	created this.
 * 01-Oct-2022	Rong Tao	use tracepoint:skb:kfree_skb
 */

#ifndef BPFTRACE_HAVE_BTF
#include <linux/socket.h>
#include <net/sock.h>
#else
#include <sys/socket.h>
#endif

BEGIN
{
  printf("Tracing tcp drops. Hit Ctrl-C to end.\n");
  printf("%-8s %-8s %-16s %-21s %-21s %-8s\n", "TIME", "PID", "COMM", "SADDR:SPORT", "DADDR:DPORT", "STATE");

  // See https://github.com/torvalds/linux/blob/master/include/net/tcp_states.h
  @tcp_states[1] = "ESTABLISHED";
  @tcp_states[2] = "SYN_SENT";
  @tcp_states[3] = "SYN_RECV";
  @tcp_states[4] = "FIN_WAIT1";
  @tcp_states[5] = "FIN_WAIT2";
  @tcp_states[6] = "TIME_WAIT";
  @tcp_states[7] = "CLOSE";
  @tcp_states[8] = "CLOSE_WAIT";
  @tcp_states[9] = "LAST_ACK";
  @tcp_states[10] = "LISTEN";
  @tcp_states[11] = "CLOSING";
  @tcp_states[12] = "NEW_SYN_RECV";
}

tracepoint:skb:kfree_skb
{
  $reason = args->reason;
  $skb = (struct sk_buff *)args->skbaddr;
  $sk = ((struct sock *) $skb->sk);
  $inet_family = $sk->__sk_common.skc_family;

  if ($reason > SKB_DROP_REASON_NOT_SPECIFIED &&
      ($inet_family == AF_INET || $inet_family == AF_INET6)) {
    if ($inet_family == AF_INET) {
      $daddr = ntop($sk->__sk_common.skc_daddr);
      $saddr = ntop($sk->__sk_common.skc_rcv_saddr);
    } else {
      $daddr = ntop($sk->__sk_common.skc_v6_daddr.in6_u.u6_addr8);
      $saddr = ntop($sk->__sk_common.skc_v6_rcv_saddr.in6_u.u6_addr8);
    }
    $lport = $sk->__sk_common.skc_num;
    $dport = $sk->__sk_common.skc_dport;

    // Destination port is big endian, it must be flipped
    $dport = bswap($dport);

    $state = $sk->__sk_common.skc_state;
    $statestr = @tcp_states[$state];

    time("%H:%M:%S ");
    printf("%-8d %-16s ", pid, comm);
    printf("%39s:%-6d %39s:%-6d %-10s\n", $saddr, $lport, $daddr, $dport, $statestr);
    printf("%s\n", kstack);
  }
}

END
{
  clear(@tcp_states);
}
tcpdrop prints details of TCP packets or segments that were dropped by the
kernel, including the kernel stack trace that led to the drop:

# ./tcpdrop.bt
TIME     PID      COMM             SADDR:SPORT           DADDR:DPORT           STATE
00:39:21 0        swapper/2         10.231.244.31:3306     10.229.20.82:50552  ESTABLISHE
	tcp_drop+0x1
	tcp_v4_do_rcv+0x135
	tcp_v4_rcv+0x9c7
	ip_local_deliver_finish+0x62
	ip_local_deliver+0x6f
	ip_rcv_finish+0x129
	ip_rcv+0x28f
	__netif_receive_skb_core+0x432
	__netif_receive_skb+0x18
	netif_receive_skb_internal+0x37
	napi_gro_receive+0xc5
	ena_clean_rx_irq+0x3c3
	ena_io_poll+0x33f
	net_rx_action+0x140
	__softirqentry_text_start+0xdf
	irq_exit+0xb6
	do_IRQ+0x82
	ret_from_intr+0x0
	native_safe_halt+0x6
	default_idle+0x20
	arch_cpu_idle+0x15
	default_idle_call+0x23
	do_idle+0x17f
	cpu_startup_entry+0x73
	rest_init+0xae
	start_kernel+0x4dc
	x86_64_start_reservations+0x24
	x86_64_start_kernel+0x74
	secondary_startup_64+0xa5
[...]

The last column shows the state of the TCP session.

This tool is useful for debugging high rates of drops, which can cause the
remote end to do timer-based retransmits, hurting performance.

USAGE:

# ./tcpdrop.bt
tcp syn backlog
#!/usr/bin/env bpftrace
/*
 * tcpsynbl - Show TCP SYN backlog as a histogram.
 *
 * See BPF Performance Tools, Chapter 10, for an explanation of this tool.
 *
 * Copyright (c) 2019 Brendan Gregg.
 * Licensed under the Apache License, Version 2.0 (the "License").
 * This was originally created for the BPF Performance Tools book
 * published by Addison Wesley. ISBN-13: 9780136554820
 * When copying or porting, include this comment.
 *
 * 19-Apr-2019  Brendan Gregg   Created this.
 */

#ifndef BPFTRACE_HAVE_BTF
#include <net/sock.h>
#endif

BEGIN
{
	printf("Tracing SYN backlog size. Ctrl-C to end.\n");
}

kprobe:tcp_v4_syn_recv_sock,
kprobe:tcp_v6_syn_recv_sock
{
	$sock = (struct sock *)arg0;
	@backlog[$sock->sk_max_ack_backlog & 0xffffffff] =
	    hist($sock->sk_ack_backlog);
	if ($sock->sk_ack_backlog > $sock->sk_max_ack_backlog) {
		time("%H:%M:%S dropping a SYN.\n");
	}
}

END
{
	printf("\n@backlog[backlog limit]: histogram of backlog size\n");
}
# ./tcpsynbl.bt
Attaching 4 probes...
Tracing SYN backlog size. Ctrl-C to end.
^C
@backlog[backlog limit]: histogram of backlog size


@backlog[500]:
[0]                 2266 |@@@@@@@@@@@@@@@@@@@@@@@@@@@@@@@@@@@@@@@@@@@@@@@@@@@@|
[1]                    3 |                                                    |
[2, 4)                 1 |                                                    |
单个命令行的形式
查看哪些命令打开的哪些文件
$ bpftrace -e 'tracepoint:syscalls:sys_enter_openat { printf("%s %s\n", comm, str(args->filename)); }'
Attaching 1 probe...
snmp-pass /proc/cpuinfo
snmp-pass /proc/stat
snmpd /proc/net/dev
snmpd /proc/net/if_inet6
$ bpftrace -vl tracepoint:syscalls:sys_enter_openat
tracepoint:syscalls:sys_enter_openat
    int __syscall_nr;
    int dfd;
    const char * filename;
    int flags;
    umode_t mode;
统计每个进程发起系统用的次数:
$ bpftrace -e 'tracepoint:raw_syscalls:sys_enter { @[comm] = count(); }'
Attaching 1 probe...
^C

@[bpftrace]: 6
@[systemd]: 24
@[snmp-pass]: 96
@[sshd]: 125
@[comm] 定义了以进程名为 key 的 map,count() 返回每个进程上的系统调用次数。
统计某个进程read的读取字节数
统计进程 18644 每次 read() 调用读取的字节数,并用直方图的方式展示字节数分布情况:
$ bpftrace -e 'tracepoint:syscalls:sys_exit_read /pid == 18644/ { @bytes = hist(args->ret); }'
Attaching 1 probe...
^C

@bytes:
[0, 1]                12 |@@@@@@@@@@@@@@@@@@@@                                |
[2, 4)                18 |@@@@@@@@@@@@@@@@@@@@@@@@@@@@@@@                     |
[4, 8)                 0 |                                                    |
[8, 16)                0 |                                                    |
[16, 32)               0 |                                                    |
[32, 64)              30 |@@@@@@@@@@@@@@@@@@@@@@@@@@@@@@@@@@@@@@@@@@@@@@@@@@@@|
[64, 128)             19 |@@@@@@@@@@@@@@@@@@@@@@@@@@@@@@@@                    |
[128, 256)             1 |@
sys_exit_read,read() 调用结束时触发,只有结束时才知道读取了多少字节。
内核函数 vfs_read() 的执行时间
执行时间,也就是 vfs_read() 退出时的时间减去进入 vfs_read() 的时间。
首先通过 kprobe:vfs_read { @start[tid] = nsecs; },将每个线程调用 vfs_read() 的时间保留到变量 @start[tid];
然后通过 kretprobe:vfs_read /@start[tid]/ { },采集 vfs_read() 退出的时间,并用 @start[tid] 过滤;
最后 @ns[comm] = hist(nsecs - @start[tid]); delete(@start[tid]);,用退出时间减去开始时间得到数值绘制直方图,并删除变量 @start[tid]。
$ bpftrace -e 'kprobe:vfs_read { @start[tid] = nsecs; } kretprobe:vfs_read /@start[tid]/ \
              { @ns[comm] = hist(nsecs - @start[tid]); delete(@start[tid]); }'
Attaching 2 probes...

[...]
@ns[snmp-pass]:
[0, 1]                 0 |                                                    |
[2, 4)                 0 |                                                    |
[4, 8)                 0 |                                                    |
[8, 16)                0 |                                                    |
[16, 32)               0 |                                                    |
[32, 64)               0 |                                                    |
[64, 128)              0 |                                                    |
[128, 256)             0 |                                                    |
[256, 512)            27 |@@@@@@@@@                                           |
[512, 1k)            125 |@@@@@@@@@@@@@@@@@@@@@@@@@@@@@@@@@@@@@@@@@@@@@       |
[1k, 2k)              22 |@@@@@@@                                             |
[2k, 4k)               1 |                                                    |
[4k, 8k)              10 |@@@                                                 |
[8k, 16k)              1 |                                                    |
[16k, 32k)             3 |@                                                   |
[32k, 64k)           144 |@@@@@@@@@@@@@@@@@@@@@@@@@@@@@@@@@@@@@@@@@@@@@@@@@@@@|
[64k, 128k)            7 |@@                                                  |
[128k, 256k)          28 |@@@@@@@@@@                                          |
[256k, 512k)           2 |                                                    |
[512k, 1M)             3 |@                                                   |
[1M, 2M)               1 |                                                    |
调用栈分析
以 99hz 的频率采集内核调用栈,kstack 是当前的内核调用栈:
bpftrace -e 'profile:hz:99 /pid == 189/ { @[ustack] = count(); }'

$ bpftrace -e 'profile:hz:99 { @[kstack] = count(); }'
Attaching 1 probe...
^C

[...]
@[
filemap_map_pages+181
__handle_mm_fault+2905
handle_mm_fault+250
__do_page_fault+599
async_page_fault+69
]: 12
[...]
@[
cpuidle_enter_state+164
do_idle+390
cpu_startup_entry+111
start_secondary+423
secondary_startup_64+165
]: 22122
采集上下文切换(off-CPU)时的内核调用栈
$ bpftrace -e 'tracepoint:sched:sched_switch { @[kstack] = count(); }'
^C
[...]

@[
__schedule+697
__schedule+697
schedule+50
schedule_timeout+365
xfsaild+274
kthread+248
ret_from_fork+53
]: 73
@[
__schedule+697
__schedule+697
schedule_idle+40
do_idle+356
cpu_startup_entry+111
start_secondary+423
secondary_startup_64+165
]: 305
进行发送页错误的次数
bpftrace -e 'software:faults:1 { @[comm] = count(); }'
发生一定次数的cache miss的进程
bpftrace -e 'hardware:cache-misses:1000000 { @[comm, pid] = count(); }'
usdt的例子
查看库函数的时延
#!/usr/bin/env bpftrace
/*
 * gethostlatency	Trace getaddrinfo/gethostbyname[2] calls.
 *			For Linux, uses bpftrace and eBPF.
 *
 * This can be useful for identifying DNS latency, by identifying which
 * remote host name lookups were slow, and by how much.
 *
 * This uses dynamic tracing of user-level functions and registers, and may
 # need modifications to match your software and processor architecture.
 *
 * USAGE: gethostlatency.bt
 *
 * This is a bpftrace version of the bcc tool of the same name.
 *
 * Copyright 2018 Netflix, Inc.
 * Licensed under the Apache License, Version 2.0 (the "License")
 *
 * 08-Sep-2018	Brendan Gregg	Created this.
 */

BEGIN
{
	printf("Tracing getaddr/gethost calls... Hit Ctrl-C to end.\n");
	printf("%-9s %-6s %-16s %6s %s\n", "TIME", "PID", "COMM", "LATms",
	    "HOST");
}

uprobe:libc:getaddrinfo,
uprobe:libc:gethostbyname,
uprobe:libc:gethostbyname2
{
	@start[tid] = nsecs;
	@name[tid] = arg0;
}

uretprobe:libc:getaddrinfo,
uretprobe:libc:gethostbyname,
uretprobe:libc:gethostbyname2
/@start[tid]/
{
	$latms = (nsecs - @start[tid]) / 1e6;
	time("%H:%M:%S  ");
	printf("%-6d %-16s %6d %s\n", pid, comm, $latms, str(@name[tid]));
	delete(@start[tid]);
	delete(@name[tid]);
}
This traces host name lookup calls (getaddrinfo(), gethostbyname(), and
gethostbyname2()), and shows the PID and command performing the lookup, the
latency (duration) of the call in milliseconds, and the host string:

# ./gethostlatency.bt
Attaching 7 probes...
Tracing getaddr/gethost calls... Hit Ctrl-C to end.
TIME      PID    COMM              LATms HOST
02:52:05  19105  curl                 81 www.netflix.com
02:52:12  19111  curl                 17 www.netflix.com
02:52:19  19116  curl                  9 www.facebook.com
02:52:23  19118  curl                  3 www.facebook.com

In this example, the first call to lookup "www.netflix.com" took 81 ms, and
the second took 17 ms (sounds like some caching).


There is another version of this tool in bcc: https://github.com/iovisor/bcc
The bcc version provides options to customize the output.
参考
https://github.com/iovisor/bpftrace/blob/master/docs/tutorial_one_liners_chinese.md

https://github.com/iovisor/bpftrace/blob/v0.9.3/docs/tutorial_one_liners.md

https://github.com/iovisor/bpftrace/tree/master/tools


 579
579


 被折叠的 条评论
为什么被折叠?
被折叠的 条评论
为什么被折叠?
 到【灌水乐园】发言


