


目录
一。乘客生还率
import pandas as pd
import numpy as np
from matplotlib import pyplot as plt
from matplotlib import font_manager
# import matplotlib
my_font=font_manager.FontProperties(fname="/System/Library/Fonts/PingFang.ttc")#终端输入fc-list :lang=zh查找中文字体;
# plt.rcParams["font.family"] = "YaHei"
# plt.rcParams['font.sans-serif']=['SimHei']
df=pd.read_csv("./train.csv")
print(df.head())
print(df.info())
print(df.describe())
"""
删除缺失行:dropna()
填充缺失行:fillna()
"""
age_mean=df["Age"].mean()
df["Age"]=df["Age"].fillna(age_mean)
def sex_value(a):
if a=="male":
return 1
else:
return 0
df["Sex"]=df["Sex"].apply(sex_value) #将性别数值化
# print(df["Sex"])
# df["Sex"]=df["Sex"].map({"male":1,"female":0}) #使用map方法进行映射处理将性别数值化;如果没有映射上,返回nan;
# print(df["Sex"])
# survives_passenger_df=df[df["Survived"]==1]
# survives_passenger_df.head()
# df_sexl=df["Sex"][df["Survived"]==1]
# df_sex0=df["Sex"][df["Survived"]==0]
# print(df_sexl)
# print(df_sex0)
# plt.hist([df_sexl,df_sex0],label=["rescued","not rescued"])#横坐标代表取值,纵坐标代表频数;0代表女性,1代表男性;
# plt.xticks([-1,0,1,2],[-1,"F","M",2])
# plt.legend()
# plt.title("Sex_Survived")
# plt.savefig("./Sex_Survived.jpg")
# plt.show()
# df_Agel=df["Age"][df["Survived"]==1]
# df_Age0=df["Age"][df["Survived"]==0]
# # print(df_Agel)
# # print(df_Age0)
# plt.hist([df_Agel,df_Age0],label=["rescued","not rescued"],stacked=True)#横坐标代表取值,纵坐标代表频数;0代表女性,1代表男性;
# plt.legend()
# plt.title("Age_Survived")
# plt.savefig("./Age_Survived.jpg")
# plt.show()
def age_duan(age):
if age<=18:
return 1
elif age<=40:
return 2
else:
return 3
df["Age"]=df["Age"].apply(age_duan)
# df_Agel=df["Age"][df["Survived"]==1]
# df_Age0=df["Age"][df["Survived"]==0]
# print(df_Agel)
# print(df_Age0)
# plt.hist([df_Agel,df_Age0],label=["rescued","not rescued"],stacked=True)#横坐标代表取值,纵坐标代表频数;0代表女性,1代表男性;
# plt.legend()
# plt.title("Age_Survived")
# plt.xticks([-1,1,2,3,5],["","child","youth","elderly",""])
# plt.savefig("./Age_Survived_three.jpg")
# plt.show()
# print(df.groupby(["Sex","Pclass"]).count()["PassengerId"])
# print(df.groupby(["Sex","Pclass"])["Sex"].count()) #Sex和Pclass分组后,每组中此Pclass有多少条数据,其实计算的也就是该组数据条数。但是不能放到count()之后,之后Sex就变成了索引
# def passenger_survived_ratio(data,clos):
# passenger_group=data.groupby(clos)[clos[0]].count()
# survived_info=data[data["Survived"]==1]
# survived_group=survived_info.groupby(clos)[clos[0]].count()
# return survived_group/passenger_group
# def print_bar(data,title):
# plt.figure(figsize=(20, 8), dpi=80)
# bar=data.plot.bar()
# plt.title(title,fontproperties=my_font)
# for p in bar.patches:
# bar.text(p.get_x() * 1.005, p.get_height() * 1.005,"%.2f%%" % (p.get_height() * 100)) # "%.2f%%"用两个百分号包裹起来,里面写格式(浮点型保留两位小数)
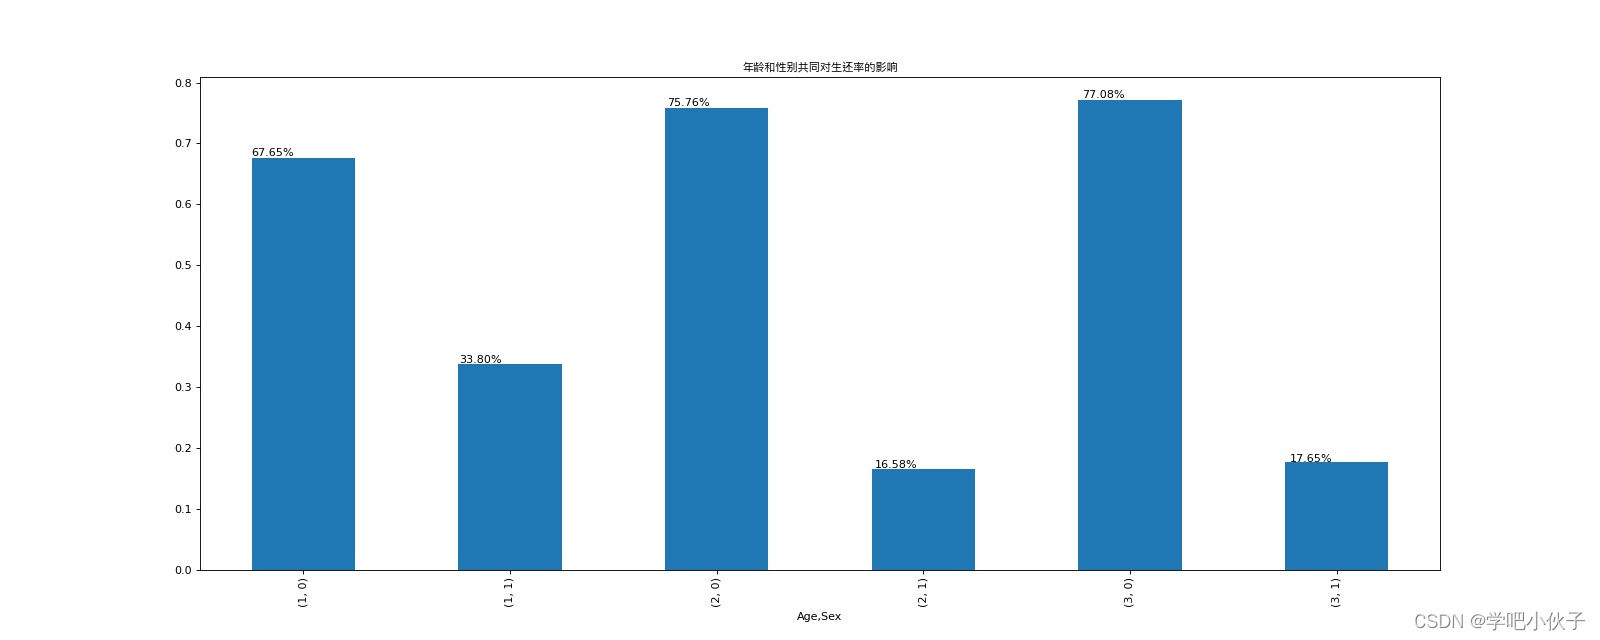
# print_bar(passenger_survived_ratio(df,["Age","Sex"]),"年龄和性别共同对生还率的影响")
# plt.savefig("./年龄和性别共同对生还率的影响.jpg")
# plt.show()
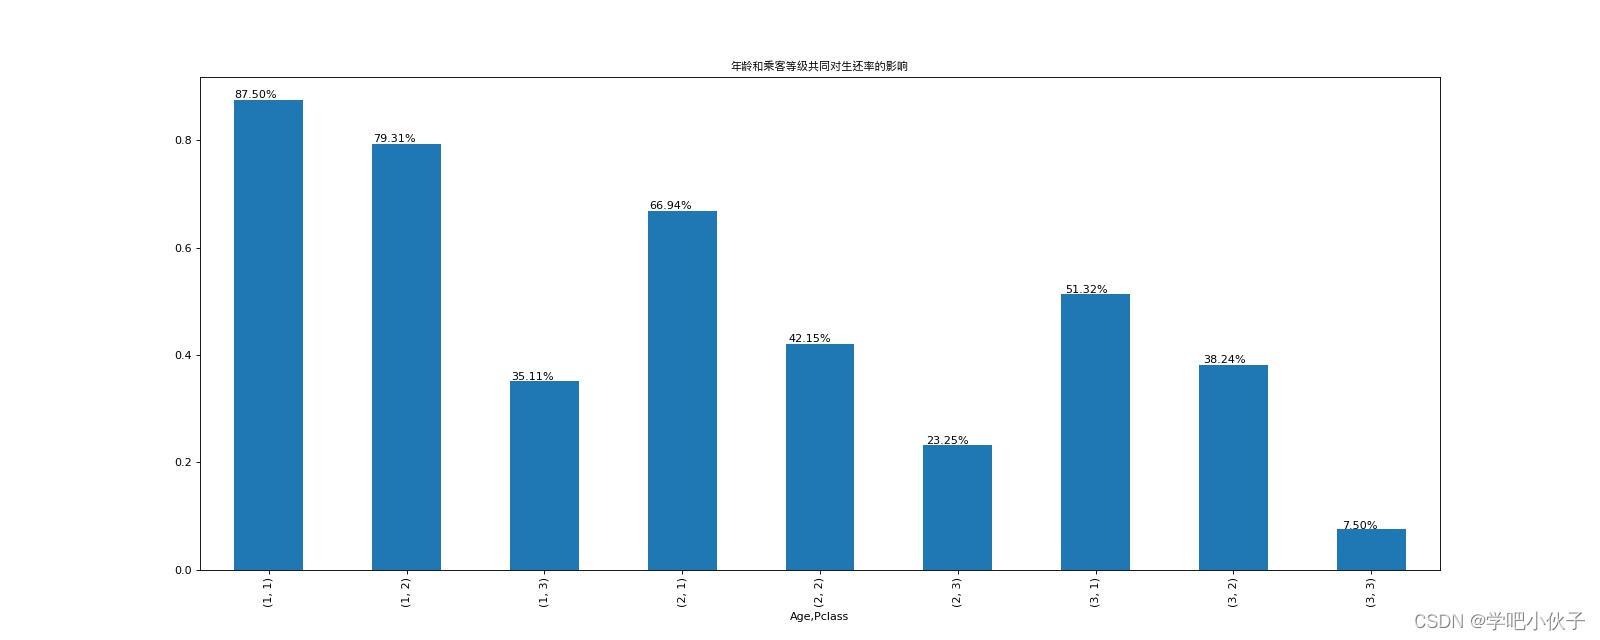
# print_bar(passenger_survived_ratio(df,["Age","Pclass"]),"年龄和乘客等级共同对生还率的影响")
# plt.savefig("./年龄和乘客等级共同对生还率的影响.jpg")
# plt.show()
group_all=df.groupby(["Sex","Pclass"])["Sex"].count()#所有人在Sex和Pclass索引下的人数。
survives_passenger_df=df[df["Survived"]==1]
survives_passenger_group=survives_passenger_df.groupby(["Sex","Pclass"])["Sex"].count()#幸存下来的人在Sex和Pclass索引下的人数。
survives_passenger_radio=survives_passenger_group/group_all
# print(survives_passenger_radio)
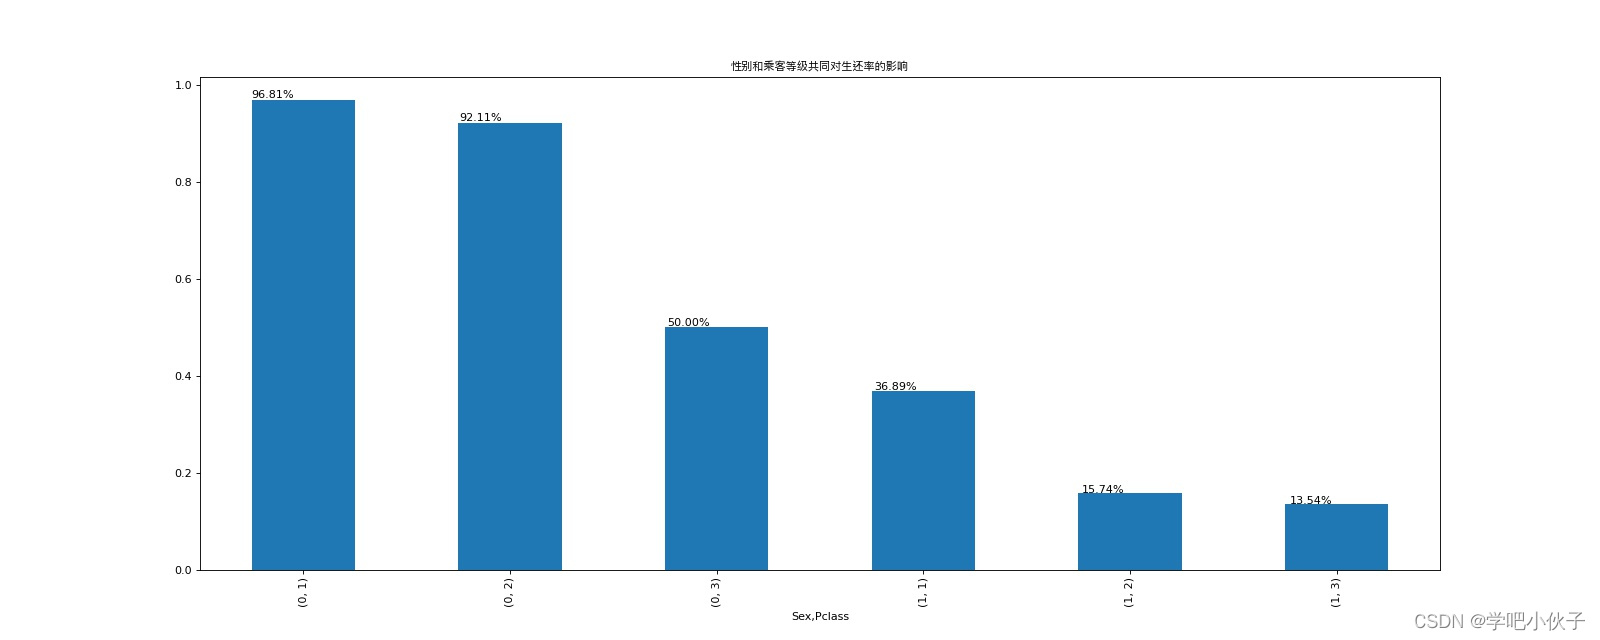
plt.figure(figsize=(20,8),dpi=80)
# bar=survives_passenger_radio.plot.bar(title="性别和乘客等级共同对生还率的影响")
bar=survives_passenger_radio.plot.bar()
plt.title("性别和乘客等级共同对生还率的影响",fontproperties=my_font)
# plt.title("性别和乘客等级共同对生还率的影响")
for p in bar.patches:
bar.text(p.get_x()*1.005,p.get_height()*1.005,"%.2f%%"%(p.get_height()*100)) #"%.2f%%"用两个百分号包裹起来,里面写格式(浮点型保留两位小数)
plt.savefig("./性别和乘客等级共同对生还率的影响.jpg")
plt.show()
/Users/lichengxiang/opt/anaconda3/bin/python /Users/lichengxiang/Desktop/python/数据分析/数据分析项目合集/乘客生还率.py
   PassengerId  Survived  Pclass  ...     Fare Cabin  Embarked
0            1         0       3  ...   7.2500   NaN         S
1            2         1       1  ...  71.2833   C85         C
2            3         1       3  ...   7.9250   NaN         S
3            4         1       1  ...  53.1000  C123         S
4            5         0       3  ...   8.0500   NaN         S

[5 rows x 12 columns]
<class 'pandas.core.frame.DataFrame'>
RangeIndex: 891 entries, 0 to 890
Data columns (total 12 columns):
 #   Column       Non-Null Count  Dtype
---  ------       --------------  -----
 0   PassengerId  891 non-null    int64
 1   Survived     891 non-null    int64
 2   Pclass       891 non-null    int64
 3   Name         891 non-null    object
 4   Sex          891 non-null    object
 5   Age          714 non-null    float64
 6   SibSp        891 non-null    int64
 7   Parch        891 non-null    int64
 8   Ticket       891 non-null    object
 9   Fare         891 non-null    float64
 10  Cabin        204 non-null    object
 11  Embarked     889 non-null    object
dtypes: float64(2), int64(5), object(5)
memory usage: 83.7+ KB
None
       PassengerId    Survived      Pclass  ...       SibSp       Parch        Fare
count   891.000000  891.000000  891.000000  ...  891.000000  891.000000  891.000000
mean    446.000000    0.383838    2.308642  ...    0.523008    0.381594   32.204208
std     257.353842    0.486592    0.836071  ...    1.102743    0.806057   49.693429
min       1.000000    0.000000    1.000000  ...    0.000000    0.000000    0.000000
25%     223.500000    0.000000    2.000000  ...    0.000000    0.000000    7.910400
50%     446.000000    0.000000    3.000000  ...    0.000000    0.000000   14.454200
75%     668.500000    1.000000    3.000000  ...    1.000000    0.000000   31.000000
max     891.000000    1.000000    3.000000  ...    8.000000    6.000000  512.329200

[8 rows x 7 columns]

进程已结束,退出代码0
二。欧洲杯案例
import pandas as pd
import os
# print(os.path.join(os.getcwd(),"Euro2012_stats.csv"))
euro12=pd.read_csv("./Euro2012_stats.csv")  #  "./"为相对路径,相对于程序所在的地方
print(euro12.info())
# print(euro12.head())
# print(euro12["Goals"])
# print(euro12.Goals) #这种取法,列名必须符合变量的命名规范

print(euro12.shape[0])
print(len(euro12))
print(len(euro12.index))
print(len(euro12.columns))
print(euro12.columns)

print(euro12[["Team","Yellow Cards","Red Cards"]])
discipline=euro12[["Team","Yellow Cards","Red Cards"]]
print("*"*100)
print(discipline.sort_values(["Red Cards","Yellow Cards"],ascending=False)) #降序,先以"Red Cards"排序,再以"Yellow Cards"排序
print("*"*100)
print(discipline.sort_values(["Red Cards","Yellow Cards"],ascending=[False,True])) #先以"Red Cards"降序排序,再以"Yellow Cards"升序排序
print(round(discipline["Yellow Cards"].mean(),2))
print(euro12.loc[euro12.Goals>6]) #加loc和不加loc效果一样
print(euro12[euro12["Team"].str.startswith("G")])
print(euro12[euro12.Team.str.startswith("G")])
print(euro12.iloc[:,:7])
print(euro12.iloc[:,:-3])
print(euro12[euro12["Team"].isin(["England","Italy","Russia"])][["Team","Shooting Accuracy"]])
print(euro12.loc[euro12["Team"].isin(["England","Italy","Russia"]),["Team","Shooting Accuracy"]])  #左边或右边有逗号时,表示为一个整体用"[]";左边或右边没有逗号时,表示是一个整体要用"[[]]";isin()接受一个列表,判断该列中元素是否在列表中,返回bool类型的series;此行操作必须添加loc,因为括号内传入了两个参数,第一个参数筛选行,第二个参数筛选列
print(euro12[["Team","Shooting Accuracy"]])
/Users/lichengxiang/opt/anaconda3/bin/python /Users/lichengxiang/Desktop/python/数据分析/数据分析项目合集/欧洲杯案例.py
<class 'pandas.core.frame.DataFrame'>
RangeIndex: 16 entries, 0 to 15
Data columns (total 35 columns):
# Column Non-Null Count Dtype
--- ------ -------------- -----
0 Team 16 non-null object
1 Goals 16 non-null int64
2 Shots on target 16 non-null int64
3 Shots off target 16 non-null int64
4 Shooting Accuracy 16 non-null object
5 % Goals-to-shots 16 non-null object
6 Total shots (inc. Blocked) 16 non-null int64
7 Hit Woodwork 16 non-null int64
8 Penalty goals 16 non-null int64
9 Penalties not scored 16 non-null int64
10 Headed goals 16 non-null int64
11 Passes 16 non-null int64
12 Passes completed 16 non-null int64
13 Passing Accuracy 16 non-null object
14 Touches 16 non-null int64
15 Crosses 16 non-null int64
16 Dribbles 16 non-null int64
17 Corners Taken 16 non-null int64
18 Tackles 16 non-null int64
19 Clearances 16 non-null int64
20 Interceptions 16 non-null int64
21 Clearances off line 15 non-null float64
22 Clean Sheets 16 non-null int64
23 Blocks 16 non-null int64
24 Goals conceded 16 non-null int64
25 Saves made 16 non-null int64
26 Saves-to-shots ratio 16 non-null object
27 Fouls Won 16 non-null int64
28 Fouls Conceded 16 non-null int64
29 Offsides 16 non-null int64
30 Yellow Cards 16 non-null int64
31 Red Cards 16 non-null int64
32 Subs on 16 non-null int64
33 Subs off 16 non-null int64
34 Players Used 16 non-null int64
dtypes: float64(1), int64(29), object(5)
memory usage: 4.5+ KB
None
16
16
16
35
Index(['Team', 'Goals', 'Shots on target', 'Shots off target',
'Shooting Accuracy', '% Goals-to-shots', 'Total shots (inc. Blocked)',
'Hit Woodwork', 'Penalty goals', 'Penalties not scored', 'Headed goals',
'Passes', 'Passes completed', 'Passing Accuracy', 'Touches', 'Crosses',
'Dribbles', 'Corners Taken', 'Tackles', 'Clearances', 'Interceptions',
'Clearances off line', 'Clean Sheets', 'Blocks', 'Goals conceded',
'Saves made', 'Saves-to-shots ratio', 'Fouls Won', 'Fouls Conceded',
'Offsides', 'Yellow Cards', 'Red Cards', 'Subs on', 'Subs off',
'Players Used'],
dtype='object')
Team Yellow Cards Red Cards
0 Croatia 9 0
1 Czech Republic 7 0
2 Denmark 4 0
3 England 5 0
4 France 6 0
5 Germany 4 0
6 Greece 9 1
7 Italy 16 0
8 Netherlands 5 0
9 Poland 7 1
10 Portugal 12 0
11 Republic of Ireland 6 1
12 Russia 6 0
13 Spain 11 0
14 Sweden 7 0
15 Ukraine 5 0
****************************************************************************************************
Team Yellow Cards Red Cards
6 Greece 9 1
9 Poland 7 1
11 Republic of Ireland 6 1
7 Italy 16 0
10 Portugal 12 0
13 Spain 11 0
0 Croatia 9 0
1 Czech Republic 7 0
14 Sweden 7 0
4 France 6 0
12 Russia 6 0
3 England 5 0
8 Netherlands 5 0
15 Ukraine 5 0
2 Denmark 4 0
5 Germany 4 0
****************************************************************************************************
Team Yellow Cards Red Cards
11 Republic of Ireland 6 1
9 Poland 7 1
6 Greece 9 1
2 Denmark 4 0
5 Germany 4 0
3 England 5 0
8 Netherlands 5 0
15 Ukraine 5 0
4 France 6 0
12 Russia 6 0
1 Czech Republic 7 0
14 Sweden 7 0
0 Croatia 9 0
13 Spain 11 0
10 Portugal 12 0
7 Italy 16 0
7.44
Team Goals Shots on target ... Subs on Subs off Players Used
5 Germany 10 32 ... 15 15 17
13 Spain 12 42 ... 17 17 18
[2 rows x 35 columns]
Team Goals Shots on target ... Subs on Subs off Players Used
5 Germany 10 32 ... 15 15 17
6 Greece 5 8 ... 12 12 20
[2 rows x 35 columns]
Team Goals Shots on target ... Subs on Subs off Players Used
5 Germany 10 32 ... 15 15 17
6 Greece 5 8 ... 12 12 20
[2 rows x 35 columns]
Team Goals ... % Goals-to-shots Total shots (inc. Blocked)
0 Croatia 4 ... 16.0% 32
1 Czech Republic 4 ... 12.9% 39
2 Denmark 4 ... 20.0% 27
3 England 5 ... 17.2% 40
4 France 3 ... 6.5% 65
5 Germany 10 ... 15.6% 80
6 Greece 5 ... 19.2% 32
7 Italy 6 ... 7.5% 110
8 Netherlands 2 ... 4.1% 60
9 Poland 2 ... 5.2% 48
10 Portugal 6 ... 9.3% 82
11 Republic of Ireland 1 ... 5.2% 28
12 Russia 5 ... 12.5% 59
13 Spain 12 ... 16.0% 100
14 Sweden 5 ... 13.8% 39
15 Ukraine 2 ... 6.0% 38
[16 rows x 7 columns]
Team Goals ... Yellow Cards Red Cards
0 Croatia 4 ... 9 0
1 Czech Republic 4 ... 7 0
2 Denmark 4 ... 4 0
3 England 5 ... 5 0
4 France 3 ... 6 0
5 Germany 10 ... 4 0
6 Greece 5 ... 9 1
7 Italy 6 ... 16 0
8 Netherlands 2 ... 5 0
9 Poland 2 ... 7 1
10 Portugal 6 ... 12 0
11 Republic of Ireland 1 ... 6 1
12 Russia 5 ... 6 0
13 Spain 12 ... 11 0
14 Sweden 5 ... 7 0
15 Ukraine 2 ... 5 0
[16 rows x 32 columns]
Team Shooting Accuracy
3 England 50.0%
7 Italy 43.0%
12 Russia 22.5%
Team Shooting Accuracy
3 England 50.0%
7 Italy 43.0%
12 Russia 22.5%
Team Shooting Accuracy
0 Croatia 51.9%
1 Czech Republic 41.9%
2 Denmark 50.0%
3 England 50.0%
4 France 37.9%
5 Germany 47.8%
6 Greece 30.7%
7 Italy 43.0%
8 Netherlands 25.0%
9 Poland 39.4%
10 Portugal 34.3%
11 Republic of Ireland 36.8%
12 Russia 22.5%
13 Spain 55.9%
14 Sweden 47.2%
15 Ukraine 21.2%
进程已结束,退出代码0
三。股票数据预处理
import tushare as ts
import pandas as pd
from pandas import DataFrame,Series
import numpy as np
# df=ts.get_k_data(code="600519",start="2000-01-01")#获取数据
# print(df)
# df.to_csv("./maotai.csv")#写入到本地
df=pd.read_csv("./maotai.csv")
print(df.head())
df.drop(labels="Unnamed: 0",axis=1,inplace=True)#axis=0:数据在纵向发生变化; axis=1:数据在横向发生变化。
print(df.head())

print("*"*100)
print(df.info())
print("*"*100)
df["date"]=pd.to_datetime(df["date"])
print("*"*100)
print(df.info())
print("*"*100)

df.set_index("date",inplace=True)
print(df.head())

print("*"*100)
print((df["open"]-df["close"])/df["open"]>0.03)#将bool值作为行索引,则可以取出True对应的行数据
print(df.loc[(df["open"]-df["close"])/df["open"]>0.03].index)
# print(df[(df["open"]-df["close"])/df["open"]>0.03].index)

print(df["close"].shift(1))
print(df[(df["open"]-df["close"].shift(1))/df["close"].shift(1)<-0.02].index)

new_df=df["2010-01":"2020-02"]
print(new_df)
print(new_df.resample("M").first())
df_monthly=new_df.resample("M").first() #每月第一个交易日对应的行数据;resample重采样,改变频率
cost=df_monthly["open"].sum()*100  #买股票花的钱
print(cost)
print(new_df.resample("A").last())
df_yearly=new_df.resample("A").last()[:-1]  #将2020年最后一行切出去
recieve=df_yearly["open"].sum()*1200  #卖出股票到手的钱
print(recieve)
last_money=new_df["close"][-1]*200 #使用昨天的收盘价作为剩余股票的单价
print(recieve+last_money-cost)
/Users/lichengxiang/opt/anaconda3/bin/python /Users/lichengxiang/Desktop/python/数据分析/数据分析项目合集/股票数据预处理.py
   Unnamed: 0        date     open  ...      low     volume    code
0           0  2001-08-27 -136.838  ... -137.035  406318.00  600519
1           1  2001-08-28 -136.781  ... -136.826  129647.79  600519
2           2  2001-08-29 -136.546  ... -136.650   53252.75  600519
3           3  2001-08-30 -136.629  ... -136.662   48013.06  600519
4           4  2001-08-31 -136.525  ... -136.567   23231.48  600519

[5 rows x 8 columns]
         date     open    close     high      low     volume    code
0  2001-08-27 -136.838 -136.715 -136.451 -137.035  406318.00  600519
1  2001-08-28 -136.781 -136.560 -136.543 -136.826  129647.79  600519
2  2001-08-29 -136.546 -136.617 -136.543 -136.650   53252.75  600519
3  2001-08-30 -136.629 -136.531 -136.483 -136.662   48013.06  600519
4  2001-08-31 -136.525 -136.542 -136.470 -136.567   23231.48  600519
****************************************************************************************************
<class 'pandas.core.frame.DataFrame'>
RangeIndex: 5121 entries, 0 to 5120
Data columns (total 7 columns):
 #   Column  Non-Null Count  Dtype
---  ------  --------------  -----
 0   date    5121 non-null   object
 1   open    5121 non-null   float64
 2   close   5121 non-null   float64
 3   high    5121 non-null   float64
 4   low     5121 non-null   float64
 5   volume  5121 non-null   float64
 6   code    5121 non-null   int64
dtypes: float64(5), int64(1), object(1)
memory usage: 280.2+ KB
None
****************************************************************************************************
****************************************************************************************************
<class 'pandas.core.frame.DataFrame'>
RangeIndex: 5121 entries, 0 to 5120
Data columns (total 7 columns):
 #   Column  Non-Null Count  Dtype
---  ------  --------------  -----
 0   date    5121 non-null   datetime64[ns]
 1   open    5121 non-null   float64
 2   close   5121 non-null   float64
 3   high    5121 non-null   float64
 4   low     5121 non-null   float64
 5   volume  5121 non-null   float64
 6   code    5121 non-null   int64
dtypes: datetime64[ns](1), float64(5), int64(1)
memory usage: 280.2 KB
None
****************************************************************************************************
               open    close     high      low     volume    code
date
2001-08-27 -136.838 -136.715 -136.451 -137.035  406318.00  600519
2001-08-28 -136.781 -136.560 -136.543 -136.826  129647.79  600519
2001-08-29 -136.546 -136.617 -136.543 -136.650   53252.75  600519
2001-08-30 -136.629 -136.531 -136.483 -136.662   48013.06  600519
2001-08-31 -136.525 -136.542 -136.470 -136.567   23231.48  600519
****************************************************************************************************
date
2001-08-27    False
2001-08-28    False
2001-08-29    False
2001-08-30    False
2001-08-31    False
              ...
2023-01-16    False
2023-01-17    False
2023-01-18    False
2023-01-19    False
2023-01-20    False
Length: 5121, dtype: bool
DatetimeIndex(['2006-12-11', '2006-12-14', '2006-12-18', '2007-01-09',
               '2007-01-11', '2007-01-12', '2007-01-18', '2007-01-19',
               '2007-01-22', '2007-01-24',
               ...
               '2021-08-26', '2021-10-18', '2021-12-29', '2022-01-13',
               '2022-01-28', '2022-03-07', '2022-10-10', '2022-10-19',
               '2022-10-24', '2022-10-27'],
              dtype='datetime64[ns]', name='date', length=835, freq=None)
date
2001-08-27         NaN
2001-08-28    -136.715
2001-08-29    -136.560
2001-08-30    -136.617
2001-08-31    -136.531
                ...
2023-01-16    1887.000
2023-01-17    1912.900
2023-01-18    1908.000
2023-01-19    1893.000
2023-01-20    1880.210
Name: close, Length: 5121, dtype: float64
DatetimeIndex(['2006-05-25', '2006-05-30', '2007-01-04', '2007-03-01',
               '2007-06-01', '2007-06-12', '2007-08-09', '2007-08-17',
               '2007-08-20', '2007-09-03',
               ...
               '2021-03-04', '2021-04-28', '2021-08-20', '2021-11-01',
               '2022-03-14', '2022-03-15', '2022-03-28', '2022-10-13',
               '2022-10-24', '2022-11-28'],
              dtype='datetime64[ns]', name='date', length=493, freq=None)
                open     close      high       low    volume    code
date
2010-01-04    -7.991    -9.539    -7.991   -10.012  44304.88  600519
2010-01-05    -8.750    -9.914    -8.367   -10.245  31513.18  600519
2010-01-06   -10.252   -11.928    -9.869   -12.266  39889.03  600519
2010-01-07   -11.928   -14.212   -11.605   -15.594  48825.55  600519
2010-01-08   -14.001   -15.504   -14.001   -16.932  36702.09  600519
...              ...       ...       ...       ...       ...     ...
2020-02-24  1025.597  1007.277  1030.097  1005.597  38650.00  600519
2020-02-25   998.097   994.907  1002.187   987.977  38385.00  600519
2020-02-26   982.097   993.797  1004.097   975.097  43560.00  600519
2020-02-27   996.097  1007.487  1015.087   996.097  34498.00  600519
2020-02-28   990.397   977.097  1002.097   970.067  49946.00  600519

[2461 rows x 6 columns]
                open     close      high       low     volume    code
date
2010-01-31    -7.991    -9.539    -7.991   -10.012   44304.88  600519
2010-02-28   -10.335   -10.327    -9.809   -11.740   29655.94  600519
2010-03-31   -12.161   -12.318   -11.409   -12.506   21734.74  600519
2010-04-30   -17.923   -16.962   -16.631   -17.938   23980.83  600519
2010-05-31   -41.056   -40.568   -39.877   -41.883   23975.16  600519
...              ...       ...       ...       ...        ...     ...
2019-10-31  1073.097  1087.197  1100.097  1072.107   31045.00  600519
2019-11-30  1101.097  1105.097  1112.047  1092.597   22811.00  600519
2019-12-31  1038.297  1053.097  1060.117  1038.297   30784.00  600519
2020-01-31  1048.097  1050.097  1065.157  1036.097  148099.00  600519
2020-02-29   905.097   924.017   930.777   900.097  123442.00  600519

[122 rows x 6 columns]
2713577.6
                open     close      high       low   volume    code
date
2010-12-31     0.262     1.855     2.125    -0.301  46084.0  600519
2011-12-31    24.657    25.153    26.459    22.426  29460.0  600519
2012-12-31    44.994    41.449    46.226    39.242  51914.0  600519
2013-12-31   -23.511   -19.891   -19.122   -24.750  57546.0  600519
2014-12-31    46.352    50.007    50.352    45.807  46269.0  600519
2015-12-31    99.821    99.791   101.101    99.421  19673.0  600519
2016-12-31   214.382   221.922   223.062   214.382  34687.0  600519
2017-12-31   612.559   592.049   621.059   586.159  76038.0  600519
2018-12-31   468.858   495.568   501.958   465.558  63678.0  600519
2019-12-31  1103.097  1103.097  1108.097  1096.607  22588.0  600519
2020-12-31   990.397   977.097  1002.097   970.067  49946.0  600519
3109765.2
591607.0

进程已结束,退出代码0
四。酒类消费数据统计
import pandas as pd
drinks=pd.read_csv("./drinks.csv")
# print(drinks.info())

print(drinks.groupby(by="continent").mean()["beer_servings"]) #series类型,因为取出了一列,由dataframe变为series
print(type(drinks.groupby("continent").mean()["beer_servings"]))
print(drinks.groupby("continent").mean()["beer_servings"].sort_values(ascending=False))

print("*"*100)

print(drinks[["continent","beer_servings"]].groupby("continent").mean()) #dataframe类型,而不是series类型
print(type(drinks[["continent","beer_servings"]].groupby("continent").mean()))
print(drinks[["continent","beer_servings"]].groupby("continent").mean().sort_values("beer_servings",ascending=False))#False为降序
print(drinks[["continent","beer_servings"]].groupby("continent").mean().sort_values("beer_servings",ascending=False).iloc[0])#取第0行
print(drinks[["continent","beer_servings"]].groupby("continent").mean().sort_values("beer_servings",ascending=False)["beer_servings"])  #"[]"中直接写值,可以取列;"[]"中写切片,例如"[:1]"可以操作行下标
print(drinks.groupby("continent").wine_servings.describe())
print(drinks.groupby("continent")["spirit_servings"].agg(["mean","min","max"]))
/Users/lichengxiang/opt/anaconda3/bin/python /Users/lichengxiang/Desktop/python/数据分析/数据分析项目合集/酒类消费数据统计.py
continent
AF 61.471698
AS 37.045455
EU 193.777778
OC 89.687500
SA 175.083333
Name: beer_servings, dtype: float64
<class 'pandas.core.series.Series'>
continent
EU 193.777778
SA 175.083333
OC 89.687500
AF 61.471698
AS 37.045455
Name: beer_servings, dtype: float64
****************************************************************************************************
beer_servings
continent
AF 61.471698
AS 37.045455
EU 193.777778
OC 89.687500
SA 175.083333
<class 'pandas.core.frame.DataFrame'>
beer_servings
continent
EU 193.777778
SA 175.083333
OC 89.687500
AF 61.471698
AS 37.045455
beer_servings 193.777778
Name: EU, dtype: float64
continent
EU 193.777778
SA 175.083333
OC 89.687500
AF 61.471698
AS 37.045455
Name: beer_servings, dtype: float64
count mean std min 25% 50% 75% max
continent
AF 53.0 16.264151 38.846419 0.0 1.0 2.0 13.00 233.0
AS 44.0 9.068182 21.667034 0.0 0.0 1.0 8.00 123.0
EU 45.0 142.222222 97.421738 0.0 59.0 128.0 195.00 370.0
OC 16.0 35.625000 64.555790 0.0 1.0 8.5 23.25 212.0
SA 12.0 62.416667 88.620189 1.0 3.0 12.0 98.50 221.0
mean min max
continent
AF 16.339623 0 152
AS 60.840909 0 326
EU 132.555556 0 373
OC 58.437500 0 254
SA 114.750000 25 302
进程已结束,退出代码0
五。城市数据练习(用法总结)
import pandas as pd
import numpy as np
from matplotlib import pyplot as plt
from matplotlib import font_manager
# import matplotlib
my_font=font_manager.FontProperties(fname="/System/Library/Fonts/PingFang.ttc")#终端输入fc-list :lang=zh查找中文字体;
# plt.rcParams["font.family"] = "YaHei"
# plt.rcParams['font.sans-serif']=['SimHei']
df=pd.read_csv("./2015年国内主要城市年度数据.csv")
print('--' * 20, '\n【1】数据集基本情况探索')
print('\n>>>样本形状:\n', df.shape) # 样本形状、样本数、特征数探索
print('\n>>>样本索引、列名探索:\n', df.index,"\n",df.columns)  # 样本索引、索引转换成列表、列名探索
print('\n>>>某列类型、全部样本类型探索:\n', df['年份'].dtypes, '\n', df.dtypes)  # 某列类型、全部样本类型探索
print('\n>>>')
print(df.info())
print('--' * 20)
# 探索某列、全部样本非 NA 值的数量
print(df['年份'].count(), '\n', df.count())
print('--' * 20)
# 探索某列的值,也可以探索全部样本的值
print(df['年份'].values)
print('--' * 20)
# value_counts探索某列中各元素值出现的次数(只能探索某列的)
# count 计算每列或每行的非NA单元格。
print(df['第一产业增加值'].value_counts().head())
# print(df['第一产业增加值'].value_counts())
print(df['年份'].value_counts().head())

# unique()函数用于获取Series对象的唯一值。唯一性按出现顺序返回。基于哈希表的唯一,因此不排序
print("唯一值:\n",df['国内生产总值'].unique())
# nunique唯一值得数量
print("\n唯一值的数量:\n",df['国内生产总值'].nunique())

print("唯一值:\n",df['年份'].unique())
# nunique唯一值得数量
print("\n唯一值的数量:\n",df['年份'].nunique())

## 探索每一列缺失值数量
print("探索每一列缺失值数量:\n",df.isnull().sum())
# print("探索每一列缺失值数量:\n",df.isnull())
# 不是缺失值数量
print("\n不是缺失值数量:\n",df.notnull().sum())

# 某列取值、多列取值
print('取出一列:\n', df['年份'].head(),"类型:",type(df['年份']))
#取出多列:
print('\n取出多列:\n', df[['地区', '年份']].head(), "类型:", type(df[['地区', '年份']]))

# 探索某列、全部样本的方差
print('年末总人口方差:\n', df['年末总人口'].var())
print('\n总体数据方差:\n', df.var(), )

# 每一列求和
print('每一列求和:\n', df.sum())
# 某列逐行累加(可以全部样本每一列都累加)
print(df['地区'].cumsum().head())
print(df.cumsum().head())

# 最大最小值
print('最大值>>>\n', df.max().head())
print('\n最小值>>>\n', df.min().head())

# 返回 '国内生产总值' 列最大、最小值所对应的索引号
print('\n>>>','\n', df['国内生产总值'].idxmax(), '\n', df['国内生产总值'].idxmin())

print('\n>>>', df.mean(), df.median())  # 平均值、中位数

# 汇总统计信息,是上面方法的统一
print('\n>>>', df.describe().T)  #".T"是转置
print('\n>>>', df.describe())

print(df.iteritems())
for (columnName, columnData) in df.iteritems():
    print('Colunm Name : ', columnName)
    print('Column Contents : ', columnData.values)
    # print('Column Contents : ',"\n", columnData)
    print("===============")

# replace允许或不允许对同一行进行多次采样,默认就是False
data = df.sample(n=5, replace=False)  # 不放回随机抽样 5 个数据
print(data)


def fun(x):
    x = int(x)
    return x
data1 = df['国内生产总值'].apply(fun)
print(data1.head())

data2 = df['地区'].apply(lambda x: x + 'QQ')
print(data2.head())

data3 = df.iloc[:, :].apply(np.sum)
# data3 = df.apply(np.sum)
print(data3.head())

df1 = pd.read_csv('./2015年国内主要城市年度数据.csv')
df2 = pd.read_csv('./2016年国内主要城市年度数据.csv')
df3 = pd.read_csv('./2017年国内主要城市年度数据.csv')
#通常用来连接DataFrame对象。默认情况下是对两个DataFrame对象进行纵向连接,
# 当然通过设置参数,也可以通过它实现DataFrame对象的横向连接
df_1 = pd.concat(objs=[df1, df2, df3],axis=0)  # 合并数据,以行的维度合并,axis=0代表从上往下走
print(df_1.sample(n=7, replace=False))  # 随机不放回抽样 7 个数据

 # 以指定值合并,在本案例中不适用
# df_2 = pd.merge(left=df1, right=df2, on='地区', how='outer')
df_2 = df1.merge(df2, on='地区', how='outer')
print(df_2)

# 设置索引时的情况
d = df_1.set_index('年份')
print(d.iloc[: , :4].head())

# 注意在取消索引操作时,inplace=True 设置为 True,以便后面可以查看到取消后的情况
d.reset_index(inplace=True)
print(d.iloc[: , :4].head())  # 取消索引时的情况

df_1.set_index(keys=['地区', '年份'], inplace=True)  # 设置多级索引,覆盖原数据
print(df_1.iloc[: , :4].head())
df_1.reset_index(inplace=True)
print(df_1.iloc[: , :4].head())

data = df_1.sample(n=5, replace=False)  # 通过随机不放回抽样 5 个数据
# 通过索引排列,升序排列、不覆盖原数据、如有缺失值则放在前面
print(data.sort_index(ascending=True, na_position='first'))

print(df_1.sort_values(by=['地区', '年份'], ascending=[True, False], inplace=False, na_position='first').head(7))

print('\n>>>', df_1['地区'].unique())  # 唯一值元素
print('\n>>>\n', df_1.nunique())  # 唯一值数量

# 查找重复值
print(df_1)
print('>>>\n', df_1.duplicated(subset=['年份'], keep='first'))

# 删除重复值
print('>>>\n', df_1.drop_duplicates(subset=['年份'], keep='first', inplace=False).iloc[:, :4])

# 查找重复索引
print('\n>>>', df_1.index.duplicated())

# '地区'作为索引分组,'年份'与分组列'地区'聚合
# 第一种方法
print(df_1.groupby(by=['地区'], as_index=True).agg({'年份': ['max', 'min', 'median']}).head())
# print(df_1.groupby(by=['地区'], as_index=True).agg({'国内生产总值': ['max', 'min', 'median']}).head())
# print(df_1.groupby(by=['地区'], as_index=True).agg(['max', 'min', 'median']).head())
print(df_1.groupby(by=['地区'], as_index=False).agg({'年份': ['max', 'min', 'median']}).head())
# 第二种方法,两种方法是等效的
print("*"*100)
print(df_1.groupby(by=['地区'], as_index=True).年份.agg(['max', 'min', 'median']).head())
print("*"*100)
print(df_1.groupby(by=['地区'], as_index=True).agg({'年份': "min", '国内生产总值': 'describe'}).head())
# 返回所有列中的最大值
print(df_1.groupby(by=['地区'], as_index=True).max().head())

# 查看所有数据的缺失情况
print(df_1.isnull().sum())
print(df_1.shape[0])
print("*"*100)
print(df_1.dropna().isnull().sum())#此时已经删除了有空值的行
print(df_1.dropna().shape[0])#此时已经删除了有空值的行

print('\n>>>\n', df1.fillna(method='ffill').head())  # 使用缺失值的前一个值填充(前向填充)
print('>>>\n', df1.fillna(method='bfill').head())  # 使用缺失值的后一个值填充(后向填充)
''' 平均值填充(所有列填充) '''
print('>>>\n', df_1.fillna(value=df_1.mean()).head())

print('>>>\n', df_1.loc[:, '年份'].head())
print('>>>\n', df_1.loc[[0, 4, 7], ['年份', '国内生产总值']].head())
print('>>>\n', df_1.iloc[:3, :3])
print('>>>\n', df_1.iloc[[1, 34, 56], [2, 4, 8]])

df_1 = df_1.set_index(["地区","年份"])
# 国内生产总值大于15678的数据
print(df_1[df_1['国内生产总值'] > 15678].head())
# 选择任一值大于1000的列
print(df_1.loc[:, (df_1>10000).any()])
# 选择所有值大于1000的列
print(df_1.loc[:, (df_1>1000).all()]  )
print(df_1.loc[:, df_1.isnull().any()])  # 选择含 NaN值的列
print(df_1.loc[:, df_1.notnull().all()])  # 选择不含NaN值的列
print("*"*100)
# 选择指定的列,类似于 df[['某列', '某列']]
print(df_1.filter(items=['国内生产总值', '普通高等学校在校学生数']))  # 选择指定的列
print(df_1.filter(like='产业', axis=1))  # 选择含有 "产业" 的列
/Users/lichengxiang/opt/anaconda3/bin/python /Users/lichengxiang/Desktop/python/数据分析/数据分析项目合集/城市数据练习.py
----------------------------------------
【1】数据集基本情况探索
>>>样本形状:
(36, 13)
>>>样本索引、列名探索:
RangeIndex(start=0, stop=36, step=1)
Index(['地区', '年份', '国内生产总值', '第一产业增加值', '第二产业增加值', '第三产业增加值', '社会商品零售总额',
'货物进出口总额', '年末总人口', '在岗职工平均工资', '普通高等学校在校学生数', '医院、卫生院数', '房地产开发投资额'],
dtype='object')
>>>某列类型、全部样本类型探索:
int64
地区 object
年份 int64
国内生产总值 float64
第一产业增加值 float64
第二产业增加值 float64
第三产业增加值 float64
社会商品零售总额 float64
货物进出口总额 float64
年末总人口 float64
在岗职工平均工资 int64
普通高等学校在校学生数 float64
医院、卫生院数 int64
房地产开发投资额 float64
dtype: object
>>>
<class 'pandas.core.frame.DataFrame'>
RangeIndex: 36 entries, 0 to 35
Data columns (total 13 columns):
# Column Non-Null Count Dtype
--- ------ -------------- -----
0 地区 36 non-null object
1 年份 36 non-null int64
2 国内生产总值 36 non-null float64
3 第一产业增加值 36 non-null float64
4 第二产业增加值 36 non-null float64
5 第三产业增加值 36 non-null float64
6 社会商品零售总额 36 non-null float64
7 货物进出口总额 36 non-null float64
8 年末总人口 36 non-null float64
9 在岗职工平均工资 36 non-null int64
10 普通高等学校在校学生数 36 non-null float64
11 医院、卫生院数 36 non-null int64
12 房地产开发投资额 35 non-null float64
dtypes: float64(9), int64(3), object(1)
memory usage: 3.8+ KB
None
----------------------------------------
36
地区 36
年份 36
国内生产总值 36
第一产业增加值 36
第二产业增加值 36
第三产业增加值 36
社会商品零售总额 36
货物进出口总额 36
年末总人口 36
在岗职工平均工资 36
普通高等学校在校学生数 36
医院、卫生院数 36
房地产开发投资额 35
dtype: int64
----------------------------------------
[2015 2015 2015 2015 2015 2015 2015 2015 2015 2015 2015 2015 2015 2015
2015 2015 2015 2015 2015 2015 2015 2015 2015 2015 2015 2015 2015 2015
2015 2015 2015 2015 2015 2015 2015 2015]
----------------------------------------
373.15 1
140.21 1
208.82 1
343.24 1
494.44 1
Name: 第一产业增加值, dtype: int64
2015 36
Name: 年份, dtype: int64
唯一值:
[23014.59 16538.19 5440.6 2735.34 3090.52 7272.31 7731.64 5530.03
5751.21 25123.45 9720.77 10050.21 8003.61 5660.27 5618.08 3466.03
4000.01 6100.23 9300.07 7311.52 10905.6 8510.13 18100.41 17502.86
3410.09 1161.96 15717.27 10801.16 2891.16 3968.01 376.73 5801.2
2095.99 1131.62 1493.86 2631.64]
唯一值的数量:
36
唯一值:
[2015]
唯一值的数量:
1
探索每一列缺失值数量:
地区 0
年份 0
国内生产总值 0
第一产业增加值 0
第二产业增加值 0
第三产业增加值 0
社会商品零售总额 0
货物进出口总额 0
年末总人口 0
在岗职工平均工资 0
普通高等学校在校学生数 0
医院、卫生院数 0
房地产开发投资额 1
dtype: int64
不是缺失值数量:
地区 36
年份 36
国内生产总值 36
第一产业增加值 36
第二产业增加值 36
第三产业增加值 36
社会商品零售总额 36
货物进出口总额 36
年末总人口 36
在岗职工平均工资 36
普通高等学校在校学生数 36
医院、卫生院数 36
房地产开发投资额 35
dtype: int64
取出一列:
0 2015
1 2015
2 2015
3 2015
4 2015
Name: 年份, dtype: int64 类型: <class 'pandas.core.series.Series'>
取出多列:
地区 年份
0 北京 2015
1 天津 2015
2 石家庄 2015
3 太原 2015
4 呼和浩特 2015 类型: <class 'pandas.core.frame.DataFrame'>
年末总人口方差:
318748.3752992857
总体数据方差:
年份 0.000000e+00
国内生产总值 3.755039e+07
第一产业增加值 4.886273e+04
第二产业增加值 4.679340e+06
第三产业增加值 1.782541e+07
社会商品零售总额 6.078666e+06
货物进出口总额 1.225179e+10
年末总人口 3.187484e+05
在岗职工平均工资 2.280371e+08
普通高等学校在校学生数 6.957614e+02
医院、卫生院数 7.417014e+04
房地产开发投资额 9.851708e+05
dtype: float64
每一列求和:
地区 北京天津石家庄太原呼和浩特沈阳大连长春哈尔滨上海南京杭州宁波合肥福州厦门南昌济南青岛郑州武汉...
年份 72540
国内生产总值 277958.37
第一产业增加值 9067.73
第二产业增加值 110481.67
第三产业增加值 158408.95
社会商品零售总额 121050.5
货物进出口总额 2316005.47
年末总人口 25808.31
在岗职工平均工资 2510833
普通高等学校在校学生数 1647.01
医院、卫生院数 12260
房地产开发投资额 48094.66
dtype: object
0 北京
1 北京天津
2 北京天津石家庄
3 北京天津石家庄太原
4 北京天津石家庄太原呼和浩特
Name: 地区, dtype: object
地区 年份 国内生产总值 ... 普通高等学校在校学生数 医院、卫生院数 房地产开发投资额
0 北京 2015 23014.59 ... 60.36 701 4177.05
1 北京天津 4030 39552.78 ... 111.65 1362 6048.60
2 北京天津石家庄 6045 44993.38 ... 153.63 1755 7013.73
3 北京天津石家庄太原 8060 47728.72 ... 195.77 2002 7611.56
4 北京天津石家庄太原呼和浩特 10075 50819.24 ... 219.29 2176 8120.61
[5 rows x 13 columns]
最大值>>>
地区 青岛
年份 2015
国内生产总值 25123.45
第一产业增加值 1150.15
第二产业增加值 7991.0
dtype: object
最小值>>>
地区 上海
年份 2015
国内生产总值 376.73
第一产业增加值 6.65
第二产业增加值 140.95
dtype: object
>>>
9
30
>>> 年份 2015.000000
国内生产总值 7721.065833
第一产业增加值 251.881389
第二产业增加值 3068.935278
第三产业增加值 4400.248611
社会商品零售总额 3362.513889
货物进出口总额 64333.485278
年末总人口 716.897500
在岗职工平均工资 69745.361111
普通高等学校在校学生数 45.750278
医院、卫生院数 340.555556
房地产开发投资额 1374.133143
dtype: float64 年份 2015.000
国内生产总值 5776.205
第一产业增加值 223.520
第二产业增加值 2611.690
第三产业增加值 3335.310
社会商品零售总额 3322.150
货物进出口总额 17209.320
年末总人口 679.360
在岗职工平均工资 65763.000
普通高等学校在校学生数 42.375
医院、卫生院数 276.500
房地产开发投资额 1122.350
dtype: float64
>>> count mean ... 75% max
年份 36.0 2015.000000 ... 2015.0000 2015.00
国内生产总值 36.0 7721.065833 ... 9803.1300 25123.45
第一产业增加值 36.0 251.881389 ... 347.3825 1150.15
第二产业增加值 36.0 3068.935278 ... 4157.0600 7991.00
第三产业增加值 36.0 4400.248611 ... 5566.0900 18331.74
社会商品零售总额 36.0 3362.513889 ... 4616.9500 10338.00
货物进出口总额 36.0 64333.485278 ... 67480.3775 449240.72
年末总人口 36.0 716.897500 ... 819.0625 3371.84
在岗职工平均工资 36.0 69745.361111 ... 70846.0000 114582.00
普通高等学校在校学生数 36.0 45.750278 ... 61.8625 104.32
医院、卫生院数 36.0 340.555556 ... 392.2500 1568.00
房地产开发投资额 35.0 1374.133143 ... 1846.2000 4177.05
[12 rows x 8 columns]
>>> 年份 国内生产总值 第一产业增加值 ... 普通高等学校在校学生数 医院、卫生院数 房地产开发投资额
count 36.0 36.000000 36.000000 ... 36.000000 36.000000 35.000000
mean 2015.0 7721.065833 251.881389 ... 45.750278 340.555556 1374.133143
std 0.0 6127.837200 221.049155 ... 26.377290 272.341954 992.557698
min 2015.0 376.730000 6.650000 ... 2.140000 58.000000 280.430000
25% 2015.0 3330.197500 97.020000 ... 27.630000 190.000000 595.905000
50% 2015.0 5776.205000 223.520000 ... 42.375000 276.500000 1122.350000
75% 2015.0 9803.130000 347.382500 ... 61.862500 392.250000 1846.200000
max 2015.0 25123.450000 1150.150000 ... 104.320000 1568.000000 4177.050000
[8 rows x 12 columns]
<generator object DataFrame.iteritems at 0x7faf6890beb0>
Colunm Name : 地区
Column Contents : ['北京' '天津' '石家庄' '太原' '呼和浩特' '沈阳' '大连' '长春' '哈尔滨' '上海' '南京' '杭州' '宁波' '合肥'
'福州' '厦门' '南昌' '济南' '青岛' '郑州' '武汉' '长沙' '广州' '深圳' '南宁' '海口' '重庆' '成都'
'贵阳' '昆明' '拉萨' '西安' '兰州' '西宁' '银川' '乌鲁木齐']
===============
Colunm Name : 年份
Column Contents : [2015 2015 2015 2015 2015 2015 2015 2015 2015 2015 2015 2015 2015 2015
2015 2015 2015 2015 2015 2015 2015 2015 2015 2015 2015 2015 2015 2015
2015 2015 2015 2015 2015 2015 2015 2015]
===============
Colunm Name : 国内生产总值
Column Contents : [23014.59 16538.19 5440.6 2735.34 3090.52 7272.31 7731.64 5530.03
5751.21 25123.45 9720.77 10050.21 8003.61 5660.27 5618.08 3466.03
4000.01 6100.23 9300.07 7311.52 10905.6 8510.13 18100.41 17502.86
3410.09 1161.96 15717.27 10801.16 2891.16 3968.01 376.73 5801.2
2095.99 1131.62 1493.86 2631.64]
===============
Colunm Name : 第一产业增加值
Column Contents : [ 140.21 208.82 494.44 37.4 126.23 341.43 453.25 343.24 672.52
109.82 232.39 287.95 284.68 263.43 434.69 23.93 171.26 305.39
363.98 150.92 359.81 341.78 226.84 6.65 370.35 57.09 1150.15
373.15 129.89 188.1 13.8 220.2 56.22 37.46 58.62 31.64]
===============
Colunm Name : 第二产业增加值
Column Contents : [4542.64 7704.22 2452.4 1020.18 867.08 3474.18 3348.74 2770.98 1862.78
7991. 3916.77 3909.01 4098.22 2977.27 2449.55 1511.28 2179.96 2307.
4026.46 3604.15 4981.54 4333.58 5726.08 7207.94 1345.66 223.67 7069.37
4723.49 1108.52 1586.38 140.95 2126.29 782.65 543.47 780.84 787.37]
===============
Colunm Name : 第三产业增加值
Column Contents : [18331.74 8625.15 2493.77 1677.77 2097.21 3456.69 3929.64 2415.81
3215.91 17022.63 5571.61 5853.25 3620.71 2419.57 2733.83 1930.82
1648.79 3487.84 4909.63 3556.45 5564.25 3834.77 12147.49 10288.28
1694.08 881.21 7497.75 5704.52 1652.75 2193.52 221.98 3454.71
1257.11 550.69 654.4 1812.62]
===============
Colunm Name : 社会商品零售总额
Column Contents : [10338. 5257.3 2693. 1540.8 1353.5 3883.2 3087.5 2409.3 3394.5
10131.5 4590.2 4697.2 3349.6 2183.7 3488.7 1168.4 1662.9 3410.3
3713.7 3294.7 5102.2 3690.6 7988. 5017.8 1786.7 595.5 6424.
4946.2 1060.2 1937. 205.8 3405.4 1152.1 461.9 477.6 1151.5]
===============
Colunm Name : 货物进出口总额
Column Contents : [319416.16 114282.8 12160.29 10677.38 2072.75 14080.8 56034.16
13999.86 4777.56 449240.72 53240.14 66566.36 100372.48 20337.84
33342.36 83290.67 11464.34 9114.24 70222.43 57026.34 28071.65
12949.62 133867.68 442458.63 5623.55 4341.3 74476.56 39531.52
9121.49 12364.43 640.55 25260. 5058.6 11410.38 3266.72
5843.11]
===============
Colunm Name : 年末总人口
Column Contents : [1345.2 1026.9 1028.84 367.39 238.58 730.41 593.56 753.83 961.37
1442.97 653.4 723.55 586.57 717.72 678.36 211.15 520.38 625.73
783. 810.49 829.27 680.36 854.19 354.99 740.23 164.8 3371.84
1228.05 391.79 555.57 53.03 815.66 321.9 201.17 179.23 266.83]
===============
Colunm Name : 在岗职工平均工资
Column Contents : [113073 81486 54441 60516 53698 61827 69390 62519 58405 109279
81075 77816 74989 65806 62478 66930 57730 68997 69465 52987
65720 67266 81171 81034 66749 57455 62091 69123 63949 62033
114582 63193 62201 58099 65643 67617]
===============
Colunm Name : 普通高等学校在校学生数
Column Contents : [ 60.36 51.29 41.98 42.14 23.52 40.4 29. 42.61 66.37 51.16
81.26 47.56 15.58 52.71 32.1 14.4 58.74 71.4 32.23 82.42
95.68 56.94 104.32 9.01 37.52 15.06 71.66 75.58 36.85 43.64
2.14 84.9 41.64 6.99 9.8 18.05]
===============
Colunm Name : 医院、卫生院数
Column Contents : [ 701 661 393 247 174 327 304 301 462 644 213 333 243 470
232 58 195 269 308 312 372 284 259 125 225 133 1568 768
260 392 78 395 164 123 92 175]
===============
Colunm Name : 房地产开发投资额
Column Contents : [4177.05 1871.55 965.13 597.83 509.05 1337.66 897.46 501.32 593.98
3468.94 1429.02 2472.6 1228.84 1259.14 1381.12 774.07 485.37 1014.4
1122.35 2000.2 2581.79 1006.84 2137.59 1331.03 657.19 456.39 3751.28
2435.25 1001.03 1451.31 nan 1820.85 320.56 280.43 409.17 366.87]
===============
地区 年份 国内生产总值 第一产业增加值 ... 在岗职工平均工资 普通高等学校在校学生数 医院、卫生院数 房地产开发投资额
30 拉萨 2015 376.73 13.80 ... 114582 2.14 78 NaN
35 乌鲁木齐 2015 2631.64 31.64 ... 67617 18.05 175 366.87
23 深圳 2015 17502.86 6.65 ... 81034 9.01 125 1331.03
7 长春 2015 5530.03 343.24 ... 62519 42.61 301 501.32
9 上海 2015 25123.45 109.82 ... 109279 51.16 644 3468.94
[5 rows x 13 columns]
0 23014
1 16538
2 5440
3 2735
4 3090
Name: 国内生产总值, dtype: int64
0 北京QQ
1 天津QQ
2 石家庄QQ
3 太原QQ
4 呼和浩特QQ
Name: 地区, dtype: object
地区 北京天津石家庄太原呼和浩特沈阳大连长春哈尔滨上海南京杭州宁波合肥福州厦门南昌济南青岛郑州武汉...
年份 72540
国内生产总值 277958.37
第一产业增加值 9067.73
第二产业增加值 110481.67
dtype: object
地区 年份 国内生产总值 第一产业增加值 ... 在岗职工平均工资 普通高等学校在校学生数 医院、卫生院数 房地产开发投资额
34 银川 2017 1803.26 61.37 ... 77206 10.1638 70 402.82
9 上海 2015 25123.45 109.82 ... 109279 51.1600 644 3468.94
24 南宁 2015 3410.09 370.35 ... 66749 37.5200 225 657.19
5 沈阳 2015 7272.31 341.43 ... 61827 40.4000 327 1337.66
9 上海 2016 28178.65 109.47 ... 120503 51.4683 656 3709.03
23 深圳 2017 22490.06 19.57 ... 100173 8.0613 135 2130.86
22 广州 2016 19547.44 239.28 ... 89096 105.7281 273 2540.85
[7 rows x 13 columns]
地区 年份_x 国内生产总值_x ... 普通高等学校在校学生数_y 医院、卫生院数_y 房地产开发投资额_y
0 北京 2015 23014.59 ... 59.9188 713 4000.57
1 天津 2015 16538.19 ... 51.3842 571 2300.01
2 石家庄 2015 5440.60 ... 44.1812 425 1015.77
3 太原 2015 2735.34 ... 43.2234 245 680.13
4 呼和浩特 2015 3090.52 ... 23.7734 185 520.52
5 沈阳 2015 7272.31 ... 40.3589 383 709.67
6 大连 2015 7731.64 ... 29.0217 315 535.17
7 长春 2015 5530.03 ... 43.4366 297 596.65
8 哈尔滨 2015 5751.21 ... 63.6240 471 526.13
9 上海 2015 25123.45 ... 51.4683 656 3709.03
10 南京 2015 9720.77 ... 82.7773 225 1845.60
11 杭州 2015 10050.21 ... 42.7978 365 2606.63
12 宁波 2015 8003.61 ... 15.5144 251 1270.33
13 合肥 2015 5660.27 ... 49.9515 462 1352.59
14 福州 2015 5618.08 ... 31.7477 230 1679.44
15 厦门 2015 3466.03 ... 14.2948 60 765.80
16 南昌 2015 4000.01 ... 61.1819 194 674.60
17 济南 2015 6100.23 ... 72.6301 270 1164.14
18 青岛 2015 9300.07 ... 34.0875 322 1369.14
19 郑州 2015 7311.52 ... 88.9329 317 2778.95
20 武汉 2015 10905.60 ... 94.8768 386 2517.44
21 长沙 2015 8510.13 ... 59.0020 286 1266.63
22 广州 2015 18100.41 ... 105.7281 273 2540.85
23 深圳 2015 17502.86 ... 9.1883 136 1756.52
24 南宁 2015 3410.09 ... 40.0531 228 854.00
25 海口 2015 1161.96 ... 13.2514 139 551.29
26 重庆 2015 15717.27 ... 73.2475 1606 3725.95
27 成都 2015 10801.16 ... 79.1593 866 2641.14
28 贵阳 2015 2891.16 ... 40.4401 258 923.26
29 昆明 2015 3968.01 ... 46.5464 414 1530.50
30 拉萨 2015 376.73 ... 3.7205 80 NaN
31 西安 2015 5801.20 ... 83.1569 392 1949.50
32 兰州 2015 2095.99 ... 42.4842 172 370.39
33 西宁 2015 1131.62 ... 7.1464 127 316.50
34 银川 2015 1493.86 ... 9.8912 104 474.94
35 乌鲁木齐 2015 2631.64 ... 17.3847 152 344.71
[36 rows x 25 columns]
地区 国内生产总值 第一产业增加值 第二产业增加值
年份
2015 北京 23014.59 140.21 4542.64
2015 天津 16538.19 208.82 7704.22
2015 石家庄 5440.60 494.44 2452.40
2015 太原 2735.34 37.40 1020.18
2015 呼和浩特 3090.52 126.23 867.08
年份 地区 国内生产总值 第一产业增加值
0 2015 北京 23014.59 140.21
1 2015 天津 16538.19 208.82
2 2015 石家庄 5440.60 494.44
3 2015 太原 2735.34 37.40
4 2015 呼和浩特 3090.52 126.23
国内生产总值 第一产业增加值 第二产业增加值 第三产业增加值
地区 年份
北京 2015 23014.59 140.21 4542.64 18331.74
天津 2015 16538.19 208.82 7704.22 8625.15
石家庄 2015 5440.60 494.44 2452.40 2493.77
太原 2015 2735.34 37.40 1020.18 1677.77
呼和浩特 2015 3090.52 126.23 867.08 2097.21
地区 年份 国内生产总值 第一产业增加值
0 北京 2015 23014.59 140.21
1 天津 2015 16538.19 208.82
2 石家庄 2015 5440.60 494.44
3 太原 2015 2735.34 37.40
4 呼和浩特 2015 3090.52 126.23
地区 年份 国内生产总值 第一产业增加值 ... 在岗职工平均工资 普通高等学校在校学生数 医院、卫生院数 房地产开发投资额
7 长春 2015 5530.03 343.24 ... 62519 42.6100 301 501.32
22 广州 2015 18100.41 226.84 ... 81171 104.3200 259 2137.59
33 西宁 2015 1131.62 37.46 ... 58099 6.9900 123 280.43
45 上海 2016 28178.65 109.47 ... 120503 51.4683 656 3709.03
96 南宁 2017 4118.83 404.18 ... 75481 42.5726 115 958.09
[5 rows x 13 columns]
地区 年份 国内生产总值 第一产业增加值 ... 在岗职工平均工资 普通高等学校在校学生数 医院、卫生院数 房地产开发投资额
81 上海 2017 30632.99 110.78 ... 130765 51.4917 363 3856.53
45 上海 2016 28178.65 109.47 ... 120503 51.4683 656 3709.03
9 上海 2015 25123.45 109.82 ... 109279 51.1600 644 3468.94
107 乌鲁木齐 2017 2743.82 29.62 ... 78072 19.3853 127 422.74
71 乌鲁木齐 2016 2458.98 28.14 ... 73254 17.3847 152 344.71
35 乌鲁木齐 2015 2631.64 31.64 ... 67617 18.0500 175 366.87
104 兰州 2017 2523.54 61.47 ... 75709 40.6279 127 418.26
[7 rows x 13 columns]
>>> ['北京' '天津' '石家庄' '太原' '呼和浩特' '沈阳' '大连' '长春' '哈尔滨' '上海' '南京' '杭州' '宁波' '合肥'
'福州' '厦门' '南昌' '济南' '青岛' '郑州' '武汉' '长沙' '广州' '深圳' '南宁' '海口' '重庆' '成都'
'贵阳' '昆明' '拉萨' '西安' '兰州' '西宁' '银川' '乌鲁木齐']
>>>
地区 36
年份 3
国内生产总值 108
第一产业增加值 108
第二产业增加值 108
第三产业增加值 108
社会商品零售总额 108
货物进出口总额 107
年末总人口 108
在岗职工平均工资 108
普通高等学校在校学生数 108
医院、卫生院数 96
房地产开发投资额 105
dtype: int64
地区 年份 国内生产总值 第一产业增加值 ... 在岗职工平均工资 普通高等学校在校学生数 医院、卫生院数 房地产开发投资额
0 北京 2015 23014.59 140.21 ... 113073 60.3600 701 4177.05
1 天津 2015 16538.19 208.82 ... 81486 51.2900 661 1871.55
2 石家庄 2015 5440.60 494.44 ... 54441 41.9800 393 965.13
3 太原 2015 2735.34 37.40 ... 60516 42.1400 247 597.83
4 呼和浩特 2015 3090.52 126.23 ... 53698 23.5200 174 509.05
.. ... ... ... ... ... ... ... ... ...
103 西安 2017 7469.85 281.12 ... 77774 72.6752 329 2234.84
104 兰州 2017 2523.54 61.47 ... 75709 40.6279 127 418.26
105 西宁 2017 1284.91 41.80 ... 73540 7.4222 73 351.33
106 银川 2017 1803.26 61.37 ... 77206 10.1638 70 402.82
107 乌鲁木齐 2017 2743.82 29.62 ... 78072 19.3853 127 422.74
[108 rows x 13 columns]
>>>
0 False
1 True
2 True
3 True
4 True
...
103 True
104 True
105 True
106 True
107 True
Length: 108, dtype: bool
>>>
地区 年份 国内生产总值 第一产业增加值
0 北京 2015 23014.59 140.21
36 北京 2016 25669.13 129.79
72 北京 2017 28014.94 120.42
>>> [False False False False False False False False False False False False
False False False False False False False False False False False False
False False False False False False False False False False False False
False False False False False False False False False False False False
False False False False False False False False False False False False
False False False False False False False False False False False False
False False False False False False False False False False False False
False False False False False False False False False False False False
False False False False False False False False False False False False]
年份
max min median
地区
上海 2017 2015 2016
乌鲁木齐 2017 2015 2016
兰州 2017 2015 2016
北京 2017 2015 2016
南京 2017 2015 2016
地区 年份
max min median
0 上海 2017 2015 2016
1 乌鲁木齐 2017 2015 2016
2 兰州 2017 2015 2016
3 北京 2017 2015 2016
4 南京 2017 2015 2016
****************************************************************************************************
max min median
地区
上海 2017 2015 2016
乌鲁木齐 2017 2015 2016
兰州 2017 2015 2016
北京 2017 2015 2016
南京 2017 2015 2016
****************************************************************************************************
年份 国内生产总值 ...
年份 count mean ... 50% 75% max
地区 ...
上海 2015 3.0 27978.363333 ... 28178.65 29405.820 30632.99
乌鲁木齐 2015 3.0 2611.480000 ... 2631.64 2687.730 2743.82
兰州 2015 3.0 2294.586667 ... 2264.23 2393.885 2523.54
北京 2015 3.0 25566.220000 ... 25669.13 26842.035 28014.94
南京 2015 3.0 10646.296667 ... 10503.02 11109.060 11715.10
[5 rows x 9 columns]
年份 国内生产总值 第一产业增加值 ... 普通高等学校在校学生数 医院、卫生院数 房地产开发投资额
地区 ...
上海 2017 30632.99 110.78 ... 51.4917 656 3856.53
乌鲁木齐 2017 2743.82 31.64 ... 19.3853 175 422.74
兰州 2017 2523.54 61.47 ... 42.4842 172 418.26
北京 2017 28014.94 140.21 ... 60.3600 713 4177.05
南京 2017 11715.10 263.01 ... 82.7773 225 2170.21
[5 rows x 12 columns]
地区 0
年份 0
国内生产总值 0
第一产业增加值 0
第二产业增加值 0
第三产业增加值 0
社会商品零售总额 0
货物进出口总额 0
年末总人口 0
在岗职工平均工资 0
普通高等学校在校学生数 0
医院、卫生院数 0
房地产开发投资额 3
dtype: int64
108
****************************************************************************************************
地区 0
年份 0
国内生产总值 0
第一产业增加值 0
第二产业增加值 0
第三产业增加值 0
社会商品零售总额 0
货物进出口总额 0
年末总人口 0
在岗职工平均工资 0
普通高等学校在校学生数 0
医院、卫生院数 0
房地产开发投资额 0
dtype: int64
105
>>>
地区 年份 国内生产总值 第一产业增加值 ... 在岗职工平均工资 普通高等学校在校学生数 医院、卫生院数 房地产开发投资额
0 北京 2015 23014.59 140.21 ... 113073 60.36 701 4177.05
1 天津 2015 16538.19 208.82 ... 81486 51.29 661 1871.55
2 石家庄 2015 5440.60 494.44 ... 54441 41.98 393 965.13
3 太原 2015 2735.34 37.40 ... 60516 42.14 247 597.83
4 呼和浩特 2015 3090.52 126.23 ... 53698 23.52 174 509.05
[5 rows x 13 columns]
>>>
0 2015
1 2015
2 2015
3 2015
4 2015
Name: 年份, dtype: int64
>>>
年份 国内生产总值
0 2015 23014.59
4 2015 3090.52
7 2015 5530.03
>>>
地区 年份 国内生产总值
0 北京 2015 23014.59
1 天津 2015 16538.19
2 石家庄 2015 5440.60
>>>
国内生产总值 第二产业增加值 年末总人口
1 16538.19 7704.22 1026.90
34 1493.86 780.84 179.23
56 11912.61 5227.05 833.85
国内生产总值 第一产业增加值 第二产业增加值 ... 普通高等学校在校学生数 医院、卫生院数 房地产开发投资额
地区 年份 ...
北京 2015 23014.59 140.21 4542.64 ... 60.36 701 4177.05
天津 2015 16538.19 208.82 7704.22 ... 51.29 661 1871.55
上海 2015 25123.45 109.82 7991.00 ... 51.16 644 3468.94
广州 2015 18100.41 226.84 5726.08 ... 104.32 259 2137.59
深圳 2015 17502.86 6.65 7207.94 ... 9.01 125 1331.03
[5 rows x 11 columns]
国内生产总值 第三产业增加值 社会商品零售总额 货物进出口总额 在岗职工平均工资
地区 年份
北京 2015 23014.59 18331.74 10338.0 319416.16 113073
天津 2015 16538.19 8625.15 5257.3 114282.80 81486
石家庄 2015 5440.60 2493.77 2693.0 12160.29 54441
太原 2015 2735.34 1677.77 1540.8 10677.38 60516
呼和浩特 2015 3090.52 2097.21 1353.5 2072.75 53698
... ... ... ... ... ...
西安 2017 7469.85 4592.65 4329.5 37699.78 77774
兰州 2017 2523.54 1580.34 1358.7 1853.01 75709
西宁 2017 1284.91 686.67 560.8 485.54 73540
银川 2017 1803.26 837.59 562.3 3979.85 77206
乌鲁木齐 2017 2743.82 1886.56 1317.1 6807.12 78072
[108 rows x 5 columns]
在岗职工平均工资
地区 年份
北京 2015 113073
天津 2015 81486
石家庄 2015 54441
太原 2015 60516
呼和浩特 2015 53698
... ...
西安 2017 77774
兰州 2017 75709
西宁 2017 73540
银川 2017 77206
乌鲁木齐 2017 78072
[108 rows x 1 columns]
房地产开发投资额
地区 年份
北京 2015 4177.05
天津 2015 1871.55
石家庄 2015 965.13
太原 2015 597.83
呼和浩特 2015 509.05
... ...
西安 2017 2234.84
兰州 2017 418.26
西宁 2017 351.33
银川 2017 402.82
乌鲁木齐 2017 422.74
[108 rows x 1 columns]
国内生产总值 第一产业增加值 第二产业增加值 ... 在岗职工平均工资 普通高等学校在校学生数 医院、卫生院数
地区 年份 ...
北京 2015 23014.59 140.21 4542.64 ... 113073 60.3600 701
天津 2015 16538.19 208.82 7704.22 ... 81486 51.2900 661
石家庄 2015 5440.60 494.44 2452.40 ... 54441 41.9800 393
太原 2015 2735.34 37.40 1020.18 ... 60516 42.1400 247
呼和浩特 2015 3090.52 126.23 867.08 ... 53698 23.5200 174
... ... ... ... ... ... ... ...
西安 2017 7469.85 281.12 2596.08 ... 77774 72.6752 329
兰州 2017 2523.54 61.47 881.74 ... 75709 40.6279 127
西宁 2017 1284.91 41.80 556.44 ... 73540 7.4222 73
银川 2017 1803.26 61.37 904.29 ... 77206 10.1638 70
乌鲁木齐 2017 2743.82 29.62 827.63 ... 78072 19.3853 127
[108 rows x 10 columns]
****************************************************************************************************
国内生产总值 普通高等学校在校学生数
地区 年份
北京 2015 23014.59 60.3600
天津 2015 16538.19 51.2900
石家庄 2015 5440.60 41.9800
太原 2015 2735.34 42.1400
呼和浩特 2015 3090.52 23.5200
... ... ...
西安 2017 7469.85 72.6752
兰州 2017 2523.54 40.6279
西宁 2017 1284.91 7.4222
银川 2017 1803.26 10.1638
乌鲁木齐 2017 2743.82 19.3853
[108 rows x 2 columns]
第一产业增加值 第二产业增加值 第三产业增加值
地区 年份
北京 2015 140.21 4542.64 18331.74
天津 2015 208.82 7704.22 8625.15
石家庄 2015 494.44 2452.40 2493.77
太原 2015 37.40 1020.18 1677.77
呼和浩特 2015 126.23 867.08 2097.21
... ... ... ...
西安 2017 281.12 2596.08 4592.65
兰州 2017 61.47 881.74 1580.34
西宁 2017 41.80 556.44 686.67
银川 2017 61.37 904.29 837.59
乌鲁木齐 2017 29.62 827.63 1886.56
[108 rows x 3 columns]
进程已结束,退出代码0


 367
367


 被折叠的 条评论
为什么被折叠?
被折叠的 条评论
为什么被折叠?
 到【灌水乐园】发言


