


目录
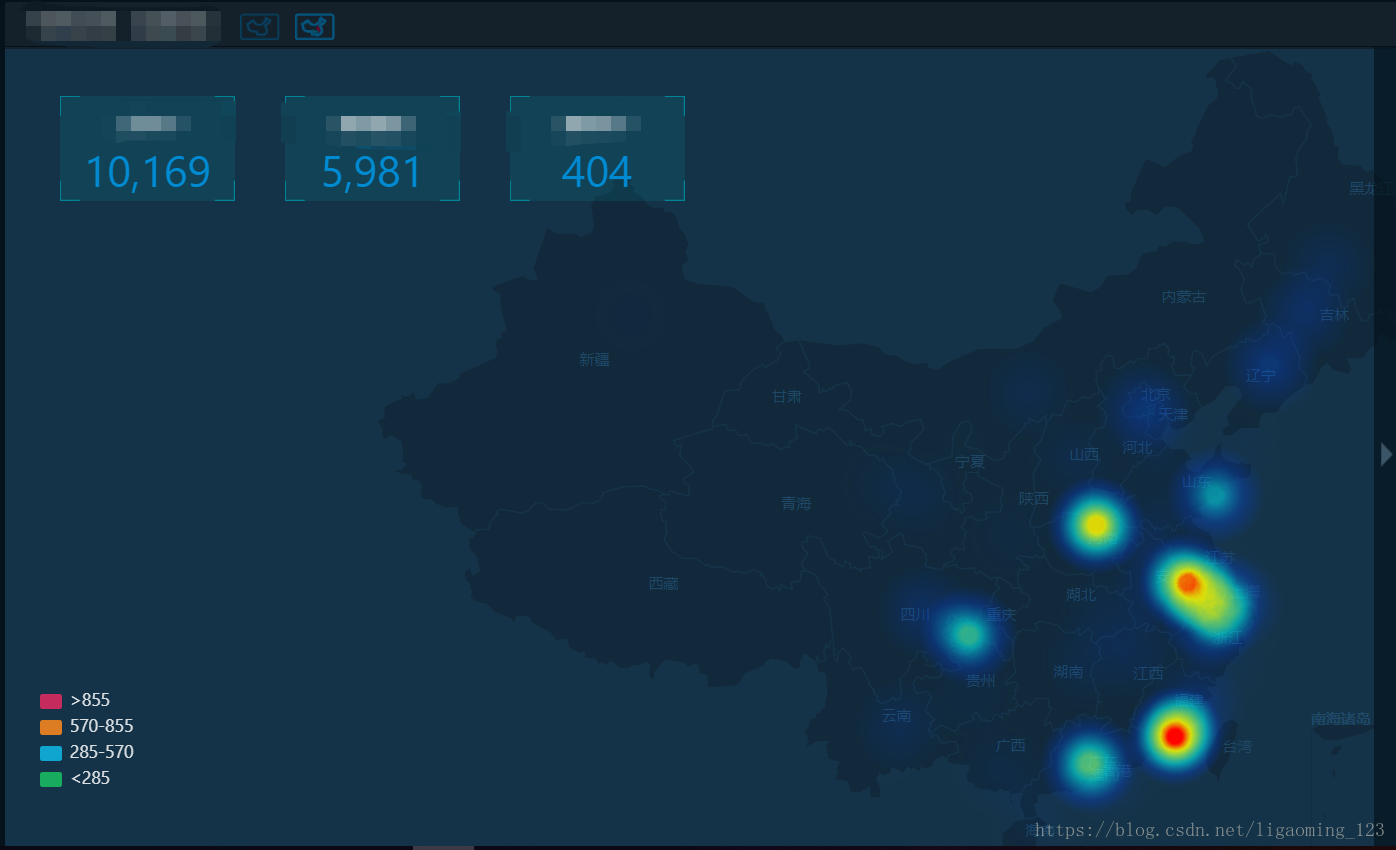
4、使用svg绘制的热力图效果不太好,因此通过引入heatmap.js进行绘制。
1、背景
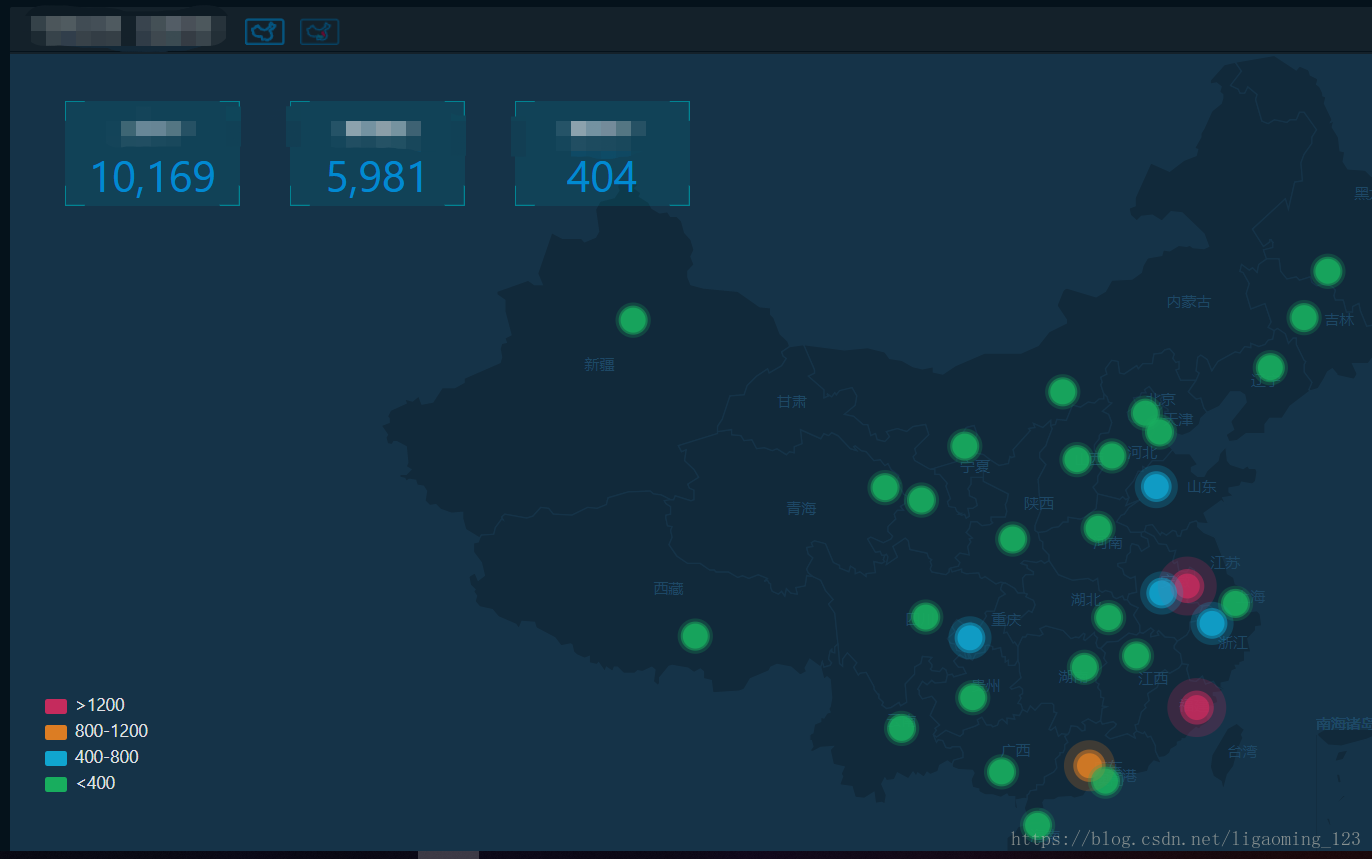
有个需求,希望在地图上展示数据的区域图和热力图。通过切换来改变展示形式。
angular: 6.1.0
d3: 5.0.0
heatmap: 2.0
2、思路
由于是使用d3绘制的地图,且请求的json数据量很大(包含中国省市区县),隐藏地图只绘制一次,其他的变化都是在地图上的数据层做绘制。把地图的svg元素和热力图的div元素通过定位,放在同一个位置上。
d3使用npm下载导入
heatmap.js是使用静态js导入
注:1)在angular.json中引入heatmap.js(下载路径见5、参考资料)
"scripts": [
              "./src/assets/js/heatmap.js"
            ]
2)import * as heatmap from 'assets/js/heatmap.js';
      <svg class="chart-cursor-d3" id="app-d3chart_{{type}}_{{id}}"
           [ngStyle]="{'height':height + 'px','background-color': itemGraph ? null : getColor('bg')}">
      </svg>
      <div id="app-d3chart_heatmap_{{id}}" [hidden]="chartType !== 'heat'"
           [ngStyle]="{'float': 'left','height':height + 'px', 'margin-top': -height  + 'px',
           'width': width + 'px','background-color': null">
      </div>
3、区域图直接在一个g元素上进行绘制。
  /**
   * @函数名称:drawBase
   * @param data  坐标数据集合
   * @作用:绘制已气泡展示的数据
   * @date 2018/7/9
   */
  private drawBase(data) {
    const me = this;
    me.initBaseDom();
    data = me.getBaseData(data);
    if (this.chartType === 'heat') {
      this.drawHeatMap(data);
      return;
    }
    const g = me.baseDom;
    const cbg = me.getColor('cbg');
    g
      .append('g')
      .selectAll('circle')
      .data(data)
      .enter()
      .append('circle')
      .attr('cx', function(d, i) {
        const x = d.location[0];
        return x;
      })
      .attr('cy', function(d, i) {
        const y = d.location[1];
        return y;
      })
      .attr('fill', function(d, i) {
        return me.getBaseColor(data[i]);
      }) // assets/img/charts/red.svg
      .attr('r', function(d, i) {
       return me.getBaseR(data[i]);
      })
      .attr('class', function (d) {
        const cl = me.getClassByLevel('base', d.cityLevel, true);
        return 'bubbledata ' + cl;
      })
      .attr('cursor', function(d, i) {
        return me.getCursorByState(d.state);
      })
      .attr('opacity', me.opacity)
      .on('mouseover', function(d, i) {
        me.tip.html(me.getBaseDataTip(d));
        me.tip.show();
      })
      .on('mouseout', function(d, i) {
        me.tip.hide();
      })
      .on('click', function(d, i) {
        me.showInterface(d, i);
      });
    // 绘制动画
    this.drawDynamicRipple(data);
  }
4、使用svg绘制的热力图效果不太好,因此通过引入heatmap.js进行绘制。
/**
   * 绘制热力图
   * @param data 数据集   数组  格式需要包含 坐标信息 {x,y}
   */
  drawHeatMap(data: any) {
    if (this.chartType !== 'heat') {
      return;
    }
    // 创建一个heatmap实例对象
// “h337” 是heatmap.js全局对象的名称.可以使用它来创建热点图实例
// 这里直接指定热点图渲染的div了.heatmap支持自定义的样式方案,
    const id = '#app-d3chart_heatmap_' + this.id;
    const shadColor = this.getColor('shadColor');
    const heatmapInstance = heatmap.h337.create({
      container: this.el.nativeElement.querySelector(id),
      radius: this.getBaseR(null),
      gradient: { // TODO 先用默认颜色
        // enter n keys between 0 and 1 here
        // for gradient color customization
        '0.25': 'rgb(0,72,255)',
        '0.55': 'rgb(0,255,255)',
        '0.85': 'rgb(255,255,0)',
        '1.0': 'rgb(255,0,0)'
      }
    });

    // 因为data是一组数据,web切图报价所以直接setData
    heatmapInstance.setData({
      max: this.legend.value.maxLevel,
      data: data
    }); // 数据绑定还可以使用
  }
5、参考资料
插件下载:http://www.yyyweb.com/demo/heatmap/heatmap.rar
官网:http://www.patrick-wied.at/static/heatmapjs/
api:http://www.patrick-wied.at/static/heatmapjs/docs.html
官网例子:http://www.patrick-wied.at/static/heatmapjs/examples.html


评论 8

 被折叠的 条评论
为什么被折叠?
被折叠的 条评论
为什么被折叠?
 到【灌水乐园】发言
查看更多评论
添加红包


