


这几天在网上找了一些关于3D图饼的文章,做了一个小例子,废话不多说,开始讲解代码
- 先生成一个图饼对象
//new出来一个图饼的对象, 参数简介1.所占的比例 2.颜色 3.是否分组(是否种其他的块是分开的) 4.文字介绍
        PieDataSerie pds = new PieDataSerie(chart_scale, chart_color, chart_group, chart_lable);
        //设置label的样式
        pds.valueFont = GraphicsProvider.getFont("Arial", ChartFont.PLAIN, 14);
        //设置label到中心的距离
        pds.textDistanceToCenter = 1.6;
- 生成一个标题对象
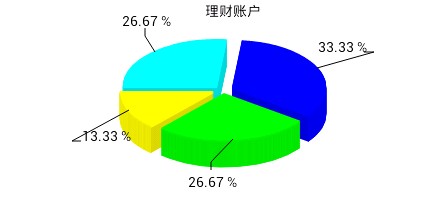
  //设置图饼的标题
        Title title = new Title("理财账户");
- 开始绘图
//开始绘图
        PiePlotter pp = new PiePlotter();
        //设置3D效果为true
        pp.effect3D = true;
        //设置边框
        pp.border = new LineStyle(1,GraphicsProvider.getColor(ChartColor.BLACK),LineStyle.LINE_NORMAL);
        //设置label的格式(#PERCENTAGE#,#VALUE#,#LABEL#)什么也不想显示的话直接“ ”里面有一个空格就可以了
        pp.labelFormat = "#PERCENTAGE#";
        //设置半径
        pp.radiusModifier = 3.2;
        //设置块与块之间的间隔
        pp.space = 10;
        //设置label到块之间的线的样式
        pp.labelLine = new LineStyle(1,GraphicsProvider.getColor(ChartColor.BLACK),LineStyle.LINE_NORMAL);
- 设置图饼旁边的文字解说的样式
 //生成一个对象
        Legend legend = new Legend();
        //因为我这里不需要解说,所以设置它为" ",中间有空格,没有空格的话,会出现多余的文字
        legend.legendLabel=" ";
//new一个图表对象,用来存放生成的图饼
        com.java4less.rchart.Chart chart = new com.java4less.rchart.Chart(title, pp, null, null);
        chart.layout = com.java4less.rchart.Chart.LAYOUT_LEGEND_TOP;
        chart.back = new FillStyle(GraphicsProvider.getColor(ChartColor.WHITE));
        chart.topMargin = 0.1;
        chart.bottomMargin = 0.4;
        chart.leftMargin =0.1;
        chart.legend = legend;
        chart.setHeight(200);
        chart.setWidth(width);
        chart.addSerie(pds);
LinearLayout l = (LinearLayout) this.findViewById(R.id.chart);
        ChartPanel chart = new ChartPanel(this);
        chart.setChart(getChart());
        l.addView(chart);
好了,就这样的成了。最后再来张图


 76
76


 被折叠的 条评论
为什么被折叠?
被折叠的 条评论
为什么被折叠?
 到【灌水乐园】发言


