


jstat
- jstat是java自带的工具,在bin目录下
用法
- 语法:
jstat -<option> [-t] [-h<lines>] <vmid> [<interval> [<count>]]
[kq@kyyj-2 bin]$ jstat -help
Usage: jstat -help|-options
       jstat -<option> [-t] [-h<lines>] <vmid> [<interval> [<count>]]

Definitions:
  <option>      An option reported by the -options option
  <vmid>        Virtual Machine Identifier. A vmid takes the following form:
                     <lvmid>[@<hostname>[:<port>]]
                Where <lvmid> is the local vm identifier for the target
                Java virtual machine, typically a process id; <hostname> is
                the name of the host running the target Java virtual machine;
                and <port> is the port number for the rmiregistry on the
                target host. See the jvmstat documentation for a more complete
                description of the Virtual Machine Identifier.
  <lines>       Number of samples between header lines.
  <interval>    Sampling interval. The following forms are allowed:
                    <n>["ms"|"s"]
                Where <n> is an integer and the suffix specifies the units as
                milliseconds("ms") or seconds("s"). The default units are "ms".
  <count>       Number of samples to take before terminating.
  -J<flag>      Pass <flag> directly to the runtime system.
- options 命令选项
- -t 在打印的列加上Timestamp列,用于显示系统运行的时间
- -h 可以在周期性数据数据的时候,可以在指定输出多少行以后输出一次表头
- vim Virtual Machine ID( 进程的 pid)
- interval 为刷新间隔时间 s 表示秒,ms 表示毫秒 (不带单位默认毫秒)
- count 表示刷新次数 (不带该参数一直循环执行)
- 例如:
# 每隔1秒执行一次  共执行20次
jstat -gcutil 10641 1000  20
options 选项:
-gc:显示垃圾回收统计信息
-class:显示类加载和卸载统计信息
-compiler:显示 JIT 编译器统计信息
-gcnew:显示新生代垃圾回收统计信息
-gcold:显示老年代垃圾回收统计信息
-gcutil:显示垃圾回收统计摘要信息。
-printcompilation:显示 JIT 编译方法列表
使用jstat工具分析gc频率
- 使用
ps -ef|grep port先查看下应用pid - 查到应用进程号为
16410 - 查询gc情况
# 每隔1秒执行一次 共执行20次
jstat -gcutil 10641 1000  20
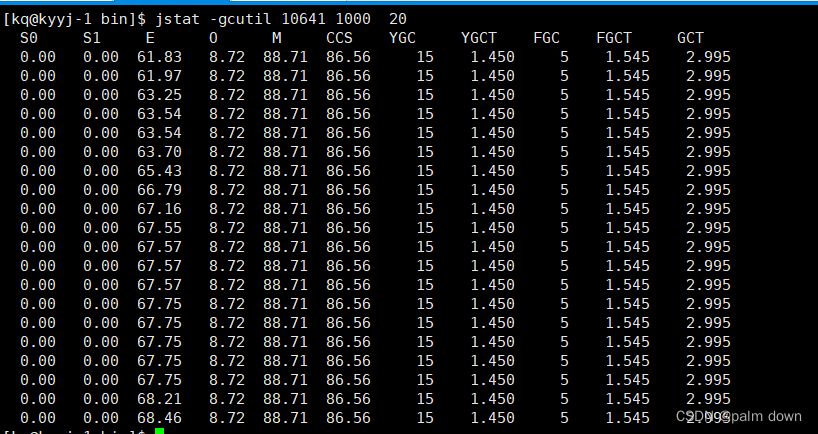
- 字段解释
S0:幸存1区当前使用比例
S1:幸存2区当前使用比例
E:伊甸园区使用比例
O:老年代使用比例
M:元数据区使用比例
CCS:压缩使用比例
YGC:年轻代垃圾回收次数 发生15次YGC 15次YGC共耗时1.45秒
YGCT:年轻代垃圾回收消耗时间(单位秒)
FGC:老年代垃圾回收次数 发生5次FGC
FGCT:老年代垃圾回收消耗时间(单位秒) 5次FCC共耗时1.545秒
GCT:垃圾回收消耗总时间(单位秒)  gc共耗时2.995秒
- 下面一直循环打印gc情况
jstat -gcutil 10641 1000
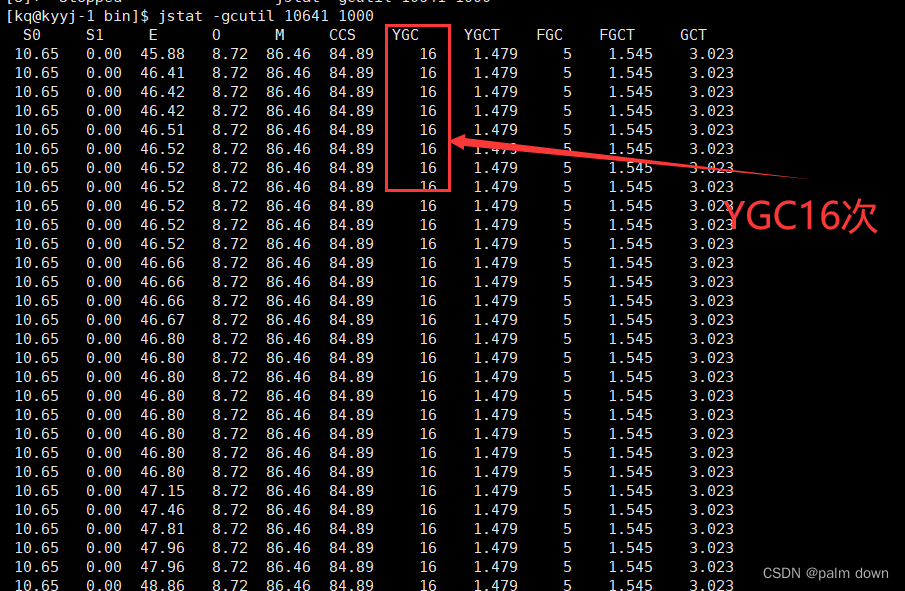
- 可以看到目前YGC 16次 FGC 5次
- 下面一直监控gc的变化
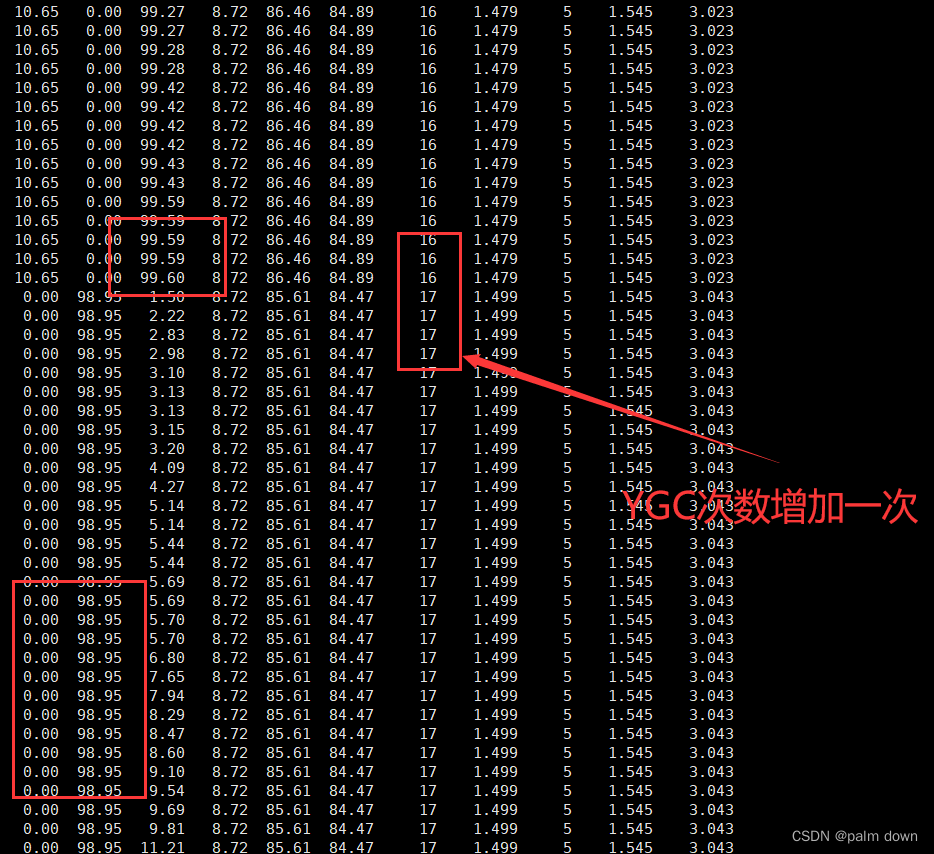
- 通过上图可以看出
- 伊甸园区满了之后触发YGC
- YGC触发之后,清理伊甸园区和S0,并把为清理的对象转移到S1区
- 继续监控gc情况
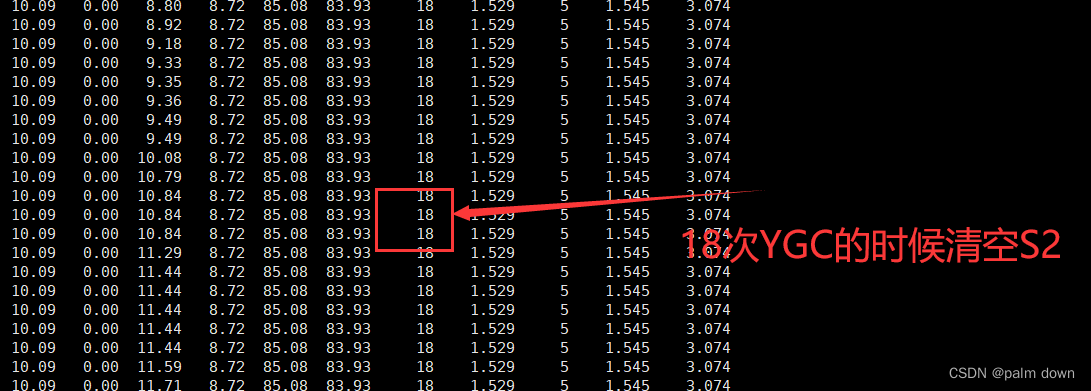
- 可以看到,YGC重复之前的动作,只不过是从S1转移到了S0
- 正常 S0和S1有一个是空的,如果两个都被占用可能存在内存泄漏
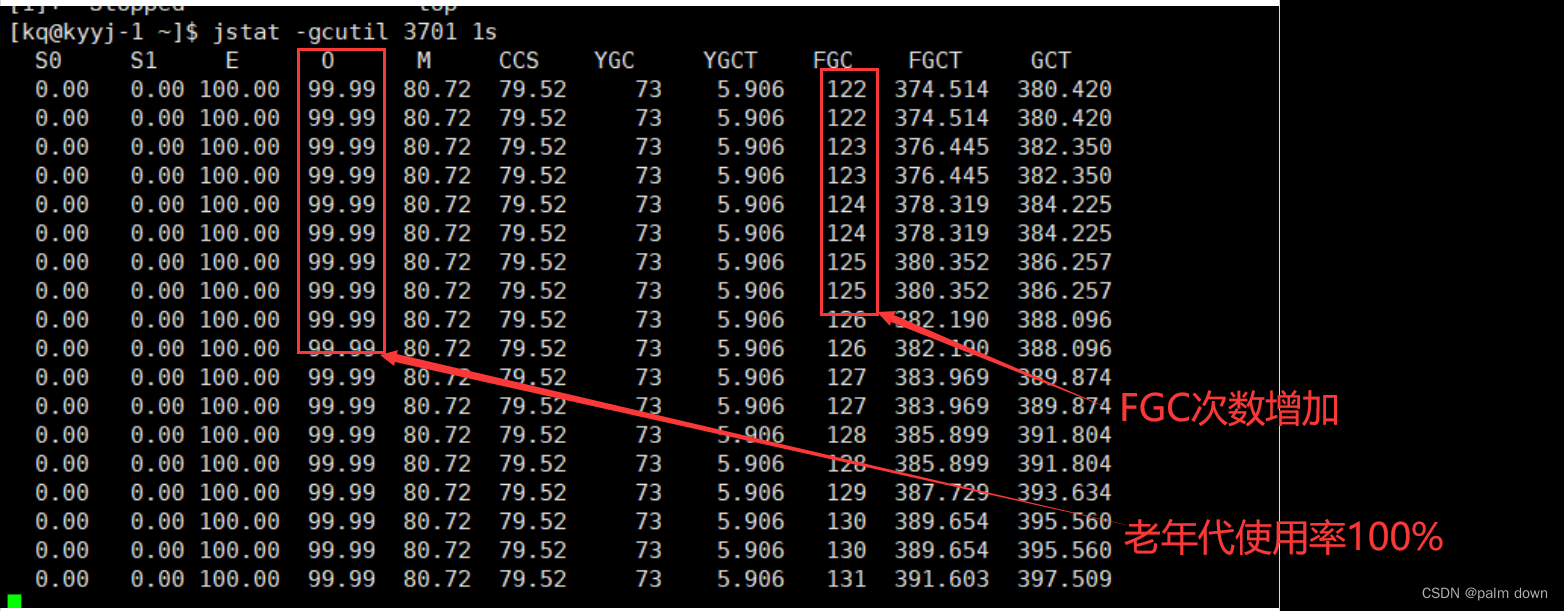
- 下面是另外一个服务触发FGC的情况,可以看到老年代使用率100%的时候触发FGC


 4235
4235

 被折叠的 条评论
为什么被折叠?
被折叠的 条评论
为什么被折叠?
 到【灌水乐园】发言


