App客户端性能测试-Android CPU、内存、流量、流畅度监控

一、Android CPU监控

系统CPU占用率

adb shell cat /proc/stat

实例输出如下:

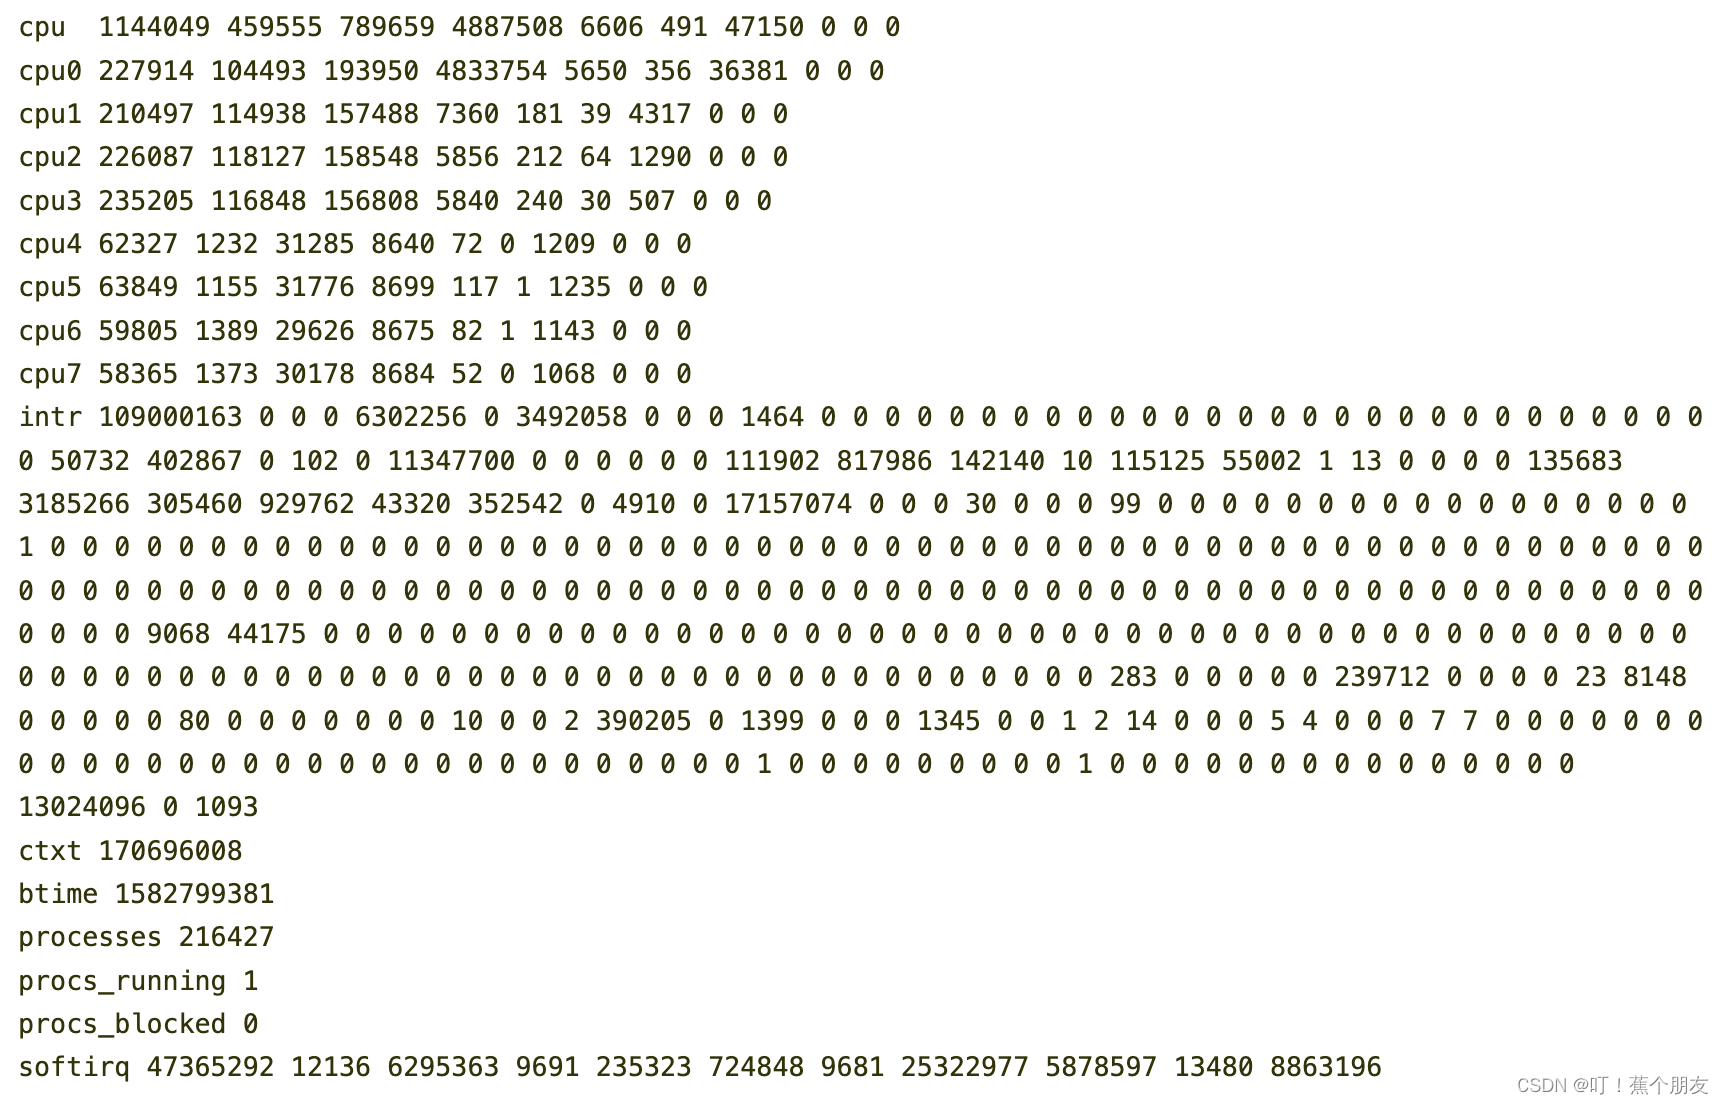
第一行数据为系统总的CPU使用数据,按上图即cpu计算如下:

CPUTime = 1144049(user) + 459555(nice) + 789659(system) + 4887508(idle) + 6606(iowait) + 491(irq) + 47150(softirq) + 0(steal) + 0(guest) + 0(guest_nice)

采样两个时间点的系统CPU,得出CPUTime1和CPUTime2

CPUTime1 = user1 + nice1 + system1 + idle1 + iowait1 + irq1 + softirq1 +steal1 + guest1 + guest_nice1;
CPUTime2 = user2 + nice2 + system2 + idle2 + iowait2 + irq2 + softirq2 +steal2 + guest2 + guest_nice2;

总的CPU时间:totalCPUTime = CPUTime2 – CPUTime1;

CPU空闲时间:idleCPUTime = idle2 – idle1;

总的CPU使用率:totalCPURate = (totalCPUTime – idleCPUTime) / totalCPUTime;

单独app的CPU占用率

adb shell cat /proc/<pid>/stat #使用adb shell ps | grep "package_name"获取到app的进程id即pid

实例输出如下:

按上图,进程CPU的计算公式如下:

processTime = 54(utime)+ 14(stime) + 0(cutime) + 0(cstime);

采样两个时间点的系统CPU和进程CPU,得出CPUTime1和CPUTime2、processTime1和processTime2

CPUTime1 = user1 + nice1 + system1 + idle1 + iowait1 + irq1 + softirq1 +steal1 + guest1 + guest_nice1;
CPUTime2 = user2 + nice2 + system2 + idle2 + iowait2 + irq2 + softirq2 +steal2 + guest2 + guest_nice2;

总的CPU时间:totalCPUTime = CPUTime2 – CPUTime1;

processTime1 = utime1 + stime1 + cutime1 + cstime1;
processTime2 = utime2 + stime2 + cutime1 + cstime2;

进程CPU时间:processTime = processTime2 – processTime1;

进程CPU使用率:processCPURate = processTime / totalCPUTime;

二、Android 内存监控

Android app的内存获取可以使用adb,命令:adb shell dumpsys meminfo "package_name"

Applications Memory Usage (in Kilobytes):
Uptime: 1178912685 Realtime: 1967803670

** MEMINFO in pid 3916 [com.example.package_name] **
                    Pss  Private  Private  SwapPss     Heap     Heap     Heap
                  Total    Dirty    Clean    Dirty     Size    Alloc     Free
                 ------   ------   ------   ------   ------   ------   ------
  Native Heap     3601     3600        0        0    11040     5756     5283
  Dalvik Heap     5500     5500        0        0    16524    11640     4883
 Dalvik Other     1029     1028        0        0
        Stack      384      384        0        0
       Ashmem        4        0        4        0
      Gfx dev     2314        0     2314        0
    Other dev      400        0      400        0
     .so mmap     1524      964      164        0
    .jar mmap        0        0        0        0
    .apk mmap      258        0        0        0
    .ttf mmap        0        0        0        0
    .dex mmap     8193        0        0        0
    .oat mmap      207        0        0        0
    .art mmap      296      292        0        0
   Other mmap      128        0        0        0
  EGL mtrack      435        0        0        0
     Unknown    15133        0    15132        0
        TOTAL    37969     9868    19100        0    27564    17406    10166

Pss total : 占用的物理内存

Private Dirty: app进程死亡结束后,系统可回收的arm 物理内存

Private clean: 当前app进程中已被系统回收的arm 物理内存

通常应用占用内存需关注Pss total

三、Android 流量监控

1、获取app的pid:adb shell ps | grep 'package_name' | awk '{print $2}'

u0_a220   25740  1246  1062120  67908 SyS_epoll_ 0000000000 S com.example.package_name #pid为25740

2、根据pid获取uid:adb shell cat /proc/{pid}/status | grep Uid | awk '{print $2}'

Name:   com.example.package_name
State:  S (sleeping)
Tgid:   2345
Ngid:   0
Pid:    2345
PPid:   1
TracerPid:  0
Uid:    2000    2000    2000    2000
Gid:    2000    2000    2000    2000
FDSize: 256

3、获取流量:adb shell cat /proc/net/xt_qtaguid/stats |grep {uid}

idx iface acct_tag_hex uid_tag_int cnt_set rx_bytes rx_packets tx_bytes tx_packets rx_tcp_bytes rx_tcp_packets rx_udp_bytes rx_udp_packets rx_other_bytes rx_other_packets tx_tcp_bytes tx_tcp_packets tx_udp_bytes tx_udp_packets tx_other_bytes tx_other_packets
58 wlan0 0x0 10051 0 48438 105 248500 105 0 0 0 0 48438 105 248500 105 0 0
59 wlan0 0x0 10051 1 48438 105 248500 105 0 0 0 0 48438 105 248500 105 0 0
60 wlan0 0x0 10051 2 48438 105 248500 105 0 0 0 0 48438 105 248500 105 0 0

步骤3结果中第6列和第8列分别是接收rx_bytes和传输tx_bytes包含tcp、udp等所有网络流量统计,由于一个uid可以对应多个进程,需要将这几行流量累加求和就是APP的流量消耗

四、Android 流畅度

Android app的流畅度与视觉惯性和帧耗时有关,jank即为卡顿帧,可以描述应用的流畅度

a)视觉惯性:视觉预期帧率,用户潜意识里认为下帧也应该是当前帧率,比如我们玩游戏一直是60帧,用户潜意识里认为下帧也应该是60帧率。刷新一直是25帧,用户潜意识里认为下帧也应该是25帧率。但是如果60帧一下跳变为25帧,就会产生明显的卡顿感。

b)电影帧:电影帧率一般是24帧。电影帧单帧耗时为 1000ms/24≈41.67ms。电影帧率是一个临界点。低于这个帧率,人眼可以感觉出画面的不连续性。

Android app流畅度测试方法:

1、在手机开发者选项中打开“GPU呈现模式分析”,选择“在adb shell dumpsys gfxinfo中”

2、输入命令:adb shell dumpsys gfxinfo "package_name">fps.txt,并在app上执行操作

** Graphics info for pid 25757 [com.example.package_name] **
Stats since: 788127699220711

Total frames rendered: 5750
Janky frames: 250 (4.35%)
90th percentile: 11ms
95th percentile: 16ms
99th percentile: 19ms
Number Missed Vsync: 100
Number High input latency: 50
Number Slow UI thread: 30

Profile data in ms:
----------------------------------------------
Frame 0: Draw 10ms, Prepare 2ms, Process 4ms, Execute 6ms
Frame 1: Draw 11ms, Prepare 3ms, Process 5ms, Execute 7ms
Frame 2: Draw 12ms, Prepare 2ms, Process 3ms, Execute 6ms
...
Frame 999: Draw 10ms, Prepare 2ms, Process 4ms, Execute 6ms

每一帧所需要的时间为Time = Draw + Prepare + Process + Execute

每一帧所需的时间Time同时满足以下2条件,则认为是一次卡顿jank

a)视觉连续性问题:当前帧耗时>前3帧平均耗时2倍

b)卡顿问题:当前帧耗时>2帧电影帧耗时(电影每秒24帧,1000ms/24*2=84ms)

  • 66
    点赞
  • 38
    收藏
    觉得还不错? 一键收藏
  • 打赏
    打赏
  • 4
    评论

“相关推荐”对你有帮助么?

  • 非常没帮助
  • 没帮助
  • 一般
  • 有帮助
  • 非常有帮助
提交
评论 4
添加红包

请填写红包祝福语或标题

红包个数最小为10个

红包金额最低5元

当前余额3.43前往充值 >
需支付:10.00
成就一亿技术人!
领取后你会自动成为博主和红包主的粉丝 规则
hope_wisdom
发出的红包

打赏作者

叮!蕉个朋友

你的鼓励将是我创作的最大动力

¥1 ¥2 ¥4 ¥6 ¥10 ¥20
扫码支付:¥1
获取中
扫码支付

您的余额不足,请更换扫码支付或充值

打赏作者

实付
使用余额支付
点击重新获取
扫码支付
钱包余额 0

抵扣说明:

1.余额是钱包充值的虚拟货币,按照1:1的比例进行支付金额的抵扣。
2.余额无法直接购买下载,可以购买VIP、付费专栏及课程。

余额充值