


1. 安装
sudo apt install google-perftools
安装后的库文件位置在/usr/lib下,具体的位置跟平台有关系,例如aarch64架构的平台安装后的位置可能是:/usr/lib/aarch64-linux-gnu/libprofiler.so.0.4.18。x86_64架构的平台安装后的位置可能是/usr/lib/x86_64-linux-gnu/libprofiler.so.0.4.18。
2.使用
使用步骤
Step1:编译得到可执行程序,假设是a.out,可以带参数,假设所需参数是待测试图片的路径。
Step2:在执行的程序前面加上LD_PRELOAD=/usr/lib/aarch64-linux-gnu/libprofiler.so.0.4.18 CPUPROFILE=test.prof,其中test.prof是生成的性能统计的文件,可以指定其它名字。完整指令示例:LD_PRELOAD=/usr/lib/aarch64-linux-gnu/libprofiler.so.0.4.18 CPUPROFILE=test.prof ./a.out /mnt/test_image_folder。
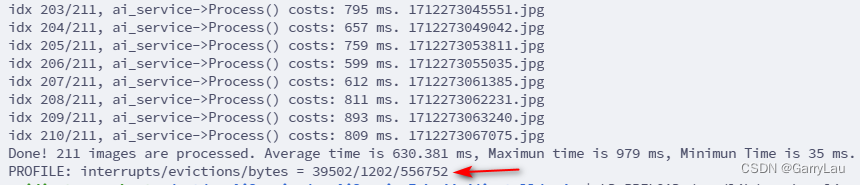
Step3:程序执行完毕会有类似如下的输出:PROFILE: interrupts/evictions/bytes = 39502/1202/556752。
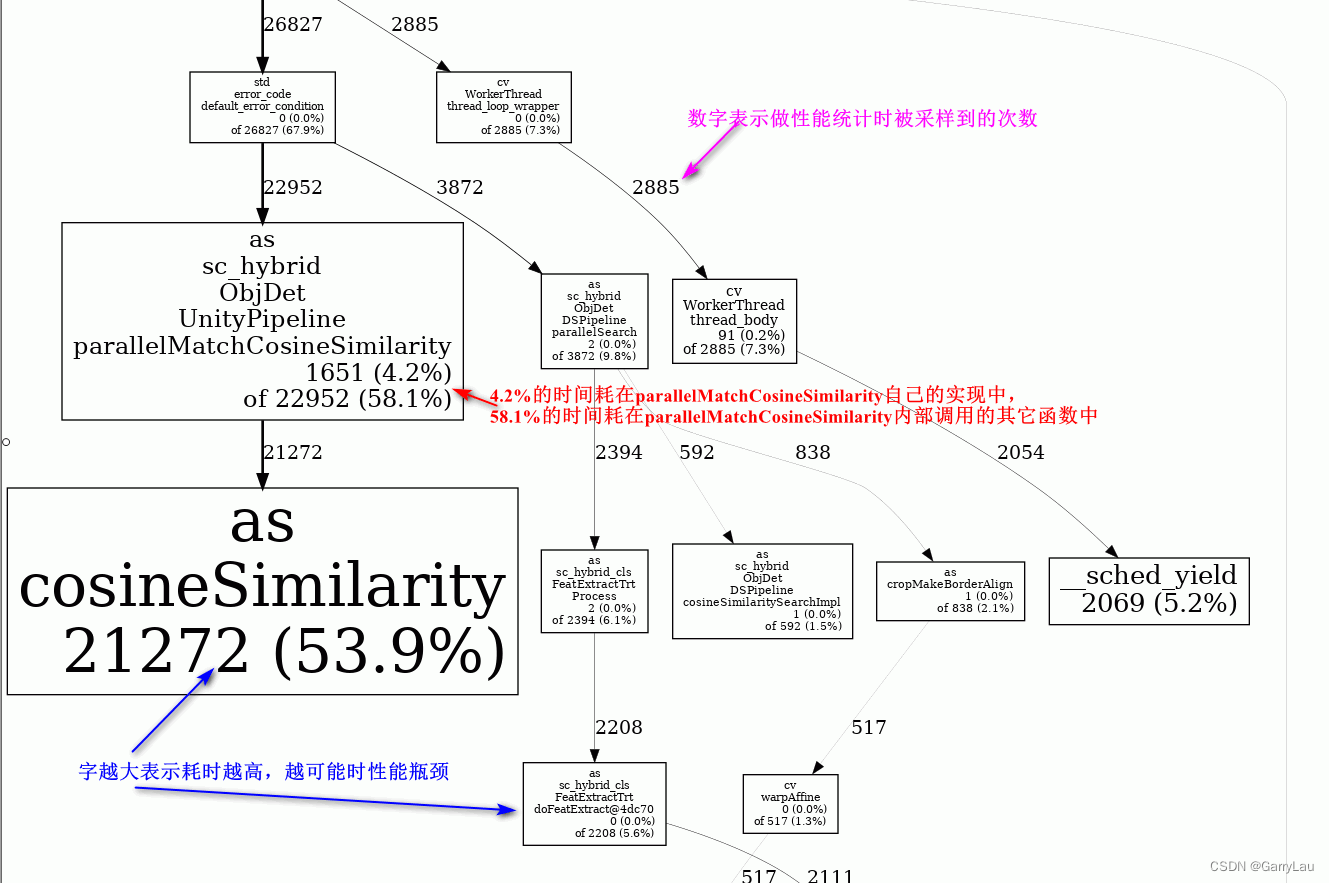
Step4:使用google-pprof将test.prof转换成可读、可看的文件,比如.txt格式、.gif格式、.svg格式等。例如google-pprof --gif run_ai_service test.prof > test.gif或google-pprof --svg --text --gif run_ai_service test.prof > test.svg。
截取部分test.svg图:


 1533
1533


 被折叠的 条评论
为什么被折叠?
被折叠的 条评论
为什么被折叠?
 到【灌水乐园】发言


