


prometheus docker-exporter安装
监控docker
这个适用于 prometheus+consul+prometheus+grafana,安装文档请参考这个文档
运行docker-exporter
//在需要监控的机器上执行
 docker run \
  --volume=/:/rootfs:ro \
  --volume=/var/run:/var/run:ro \
  --volume=/sys:/sys:ro \
  --volume=/var/lib/docker/:/var/lib/docker:ro \
  --volume=/dev/disk/:/dev/disk:ro \
  --publish=8080:8080 \
  --detach=true \
  --name=cadvisor \
  --privileged \
  --device=/dev/kmsg \
  google/cadvisor

//容器启动没有问题后,可以访问地址查看监控指标是否收集到。比如我此时安装docker收集器的服务器地址为192.168.2.184,那么访问的地址就是http://192.168.2.184:8080/mertics
向consul注册
编写向consul注册的请求体文件consul-node.json
vim consul-node.json

{
  "ID": "docker-exporter-192.168.2.184",
  "Name": "docker-exporter-192.168.2.184",
  "Tags": [
    "docker-exporter"
  ],
  "Address": "192.168.2.184",
  "Port": 8080,
  "Meta": {},
  "EnableTagOverride": false,
  "Check": {
    "HTTP": "http://192.168.2.184:8080/metrics",
    "Interval": "10s"
  },
  "Weights": {
    "Passing": 10,
    "Warning": 1
  }
}
使用rest请求向consul进行注册
curl --request PUT --data @consul-node.json http://192.168.2.184:8500/v1/agent/service/register?replace-existing-checks=1调用成功后,可以登陆consul的页面查看应用是否注册成功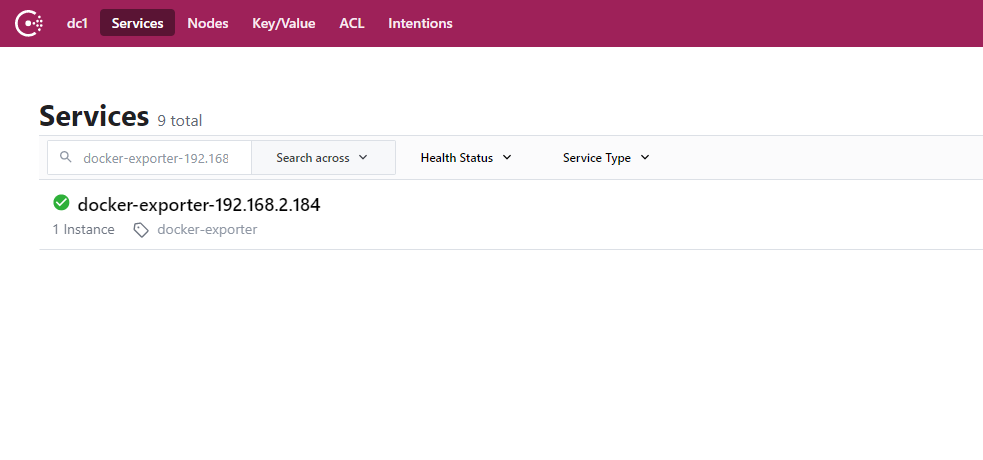
配置prometheus
如果是第一次在prometheus添加此种类型的收集器,编辑prometheus配置文件prometheus.yml,添加如下配置
- job_name: 'consul-docker-exporter'
      consul_sd_configs:
      - server: '192.168.2.184:8500'
        services: []
      relabel_configs:
      - source_labels: [__meta_consul_tags]
        regex: .*docker-exporter.*
        action: keep
      - source_labels: [ __meta__consul_service ]
        target_label: instance
添加配置后,调用接口热加载prometheus
curl -X POST http://localhost:9090/-/reload配置grafana
如果是第一次添加此种类型的收集器,需要配置grafana。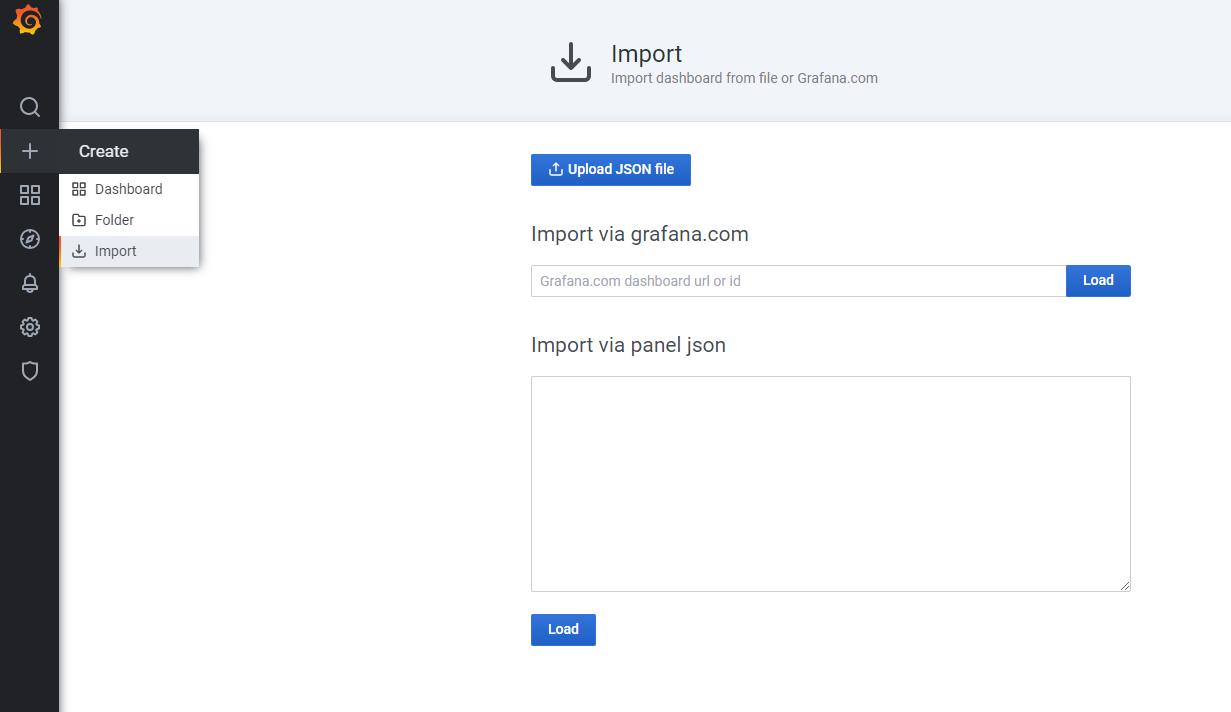
选择存储数据库,然后点击import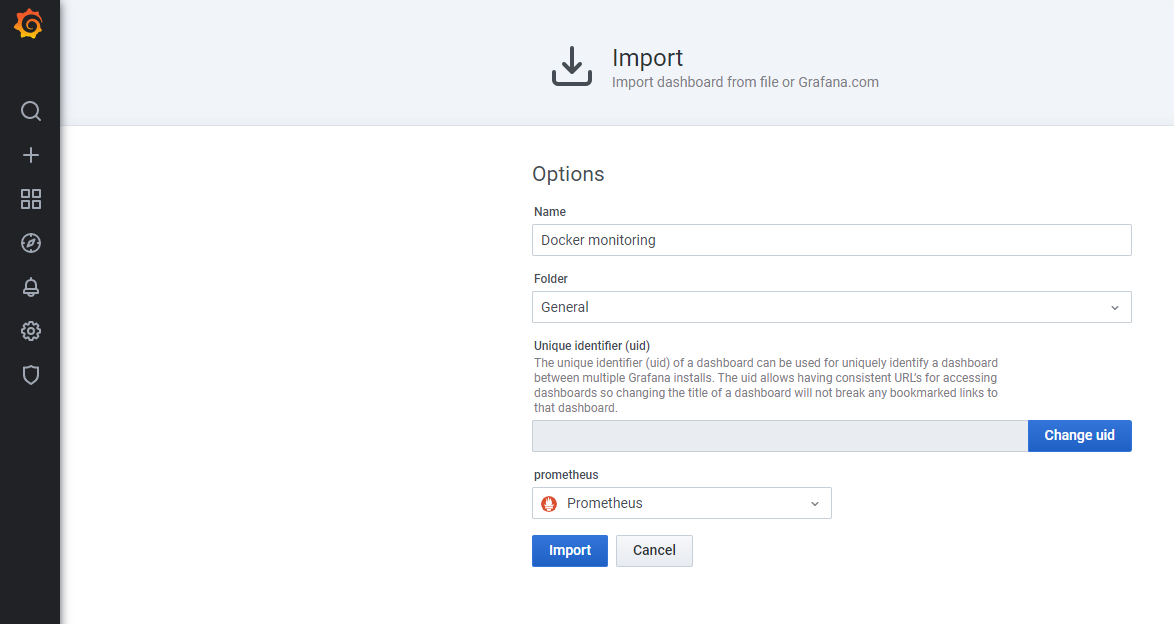
{
"__inputs": [
{
"name": "DS_PROMETHEUS",
"label": "prometheus",
"description": "Prometheus with cAdvisor as a target",
"type": "datasource",
"pluginId": "prometheus",
"pluginName": "Prometheus"
}
],
"__requires": [
{
"type": "panel",
"id": "singlestat",
"name": "Singlestat",
"version": ""
},
{
"type": "panel",
"id": "graph",
"name": "Graph",
"version": ""
},
{
"type": "grafana",
"id": "grafana",
"name": "Grafana",
"version": "3.1.0"
},
{
"type": "datasource",
"id": "prometheus",
"name": "Prometheus",
"version": "1.0.0"
}
],
"id": null,
"title": "Docker monitoring with node selection",
"description": "Docker monitoring with Prometheus and cAdvisor with node selection",
"tags": [
"docker"
],
"style": "dark",
"timezone": "browser",
"editable": true,
"hideControls": false,
"sharedCrosshair": true,
"rows": [
{
"collapse": false,
"editable": true,
"height": "50",
"panels": [
{
"cacheTimeout": null,
"colorBackground": false,
"colorValue": false,
"colors": [
"rgba(245, 54, 54, 0.9)",
"rgba(237, 129, 40, 0.89)",
"rgba(50, 172, 45, 0.97)"
],
"datasource": "${DS_PROMETHEUS}",
"editable": true,
"error": false,
"format": "none",
"gauge": {
"maxValue": 100,
"minValue": 0,
"show": false,
"thresholdLabels": false,
"thresholdMarkers": true
},
"height": "20",
"id": 7,
"interval": null,
"isNew": true,
"links": [],
"mappingType": 1,
"mappingTypes": [
{
"name": "value to text",
"value": 1
},
{
"name": "range to text",
"value": 2
}
],
"maxDataPoints": 100,
"nullPointMode": "connected",
"nullText": null,
"postfix": "",
"postfixFontSize": "50%",
"prefix": "",
"prefixFontSize": "50%",
"rangeMaps": [
{
"from": "null",
"text": "N/A",
"to": "null"
}
],
"span": 4,
"sparkline": {
"fillColor": "rgba(31, 118, 189, 0.18)",
"full": false,
"lineColor": "rgb(31, 120, 193)",
"show": false
},
"targets": [
{
"expr": "count(container_last_seen{instance=~\"$node:$port\",job=~\"$job\",image!=\"\"})",
"intervalFactor": 2,
"legendFormat": "",
"metric": "container_last_seen",
"refId": "A",
"step": 240
}
],
"thresholds": "",
"title": "Running containers",
"transparent": true,
"type": "singlestat",
"valueFontSize": "80%",
"valueMaps": [
{
"op": "=",
"text": "N/A",
"value": "null"
}
],
"valueName": "avg"
},
{
"cacheTimeout": null,
"colorBackground": false,
"colorValue": false,
"colors": [
"rgba(245, 54, 54, 0.9)",
"rgba(237, 129, 40, 0.89)",
"rgba(50, 172, 45, 0.97)"
],
"datasource": "${DS_PROMETHEUS}",
"editable": true,
"error": false,
"format": "mbytes",
"gauge": {
"maxValue": 100,
"minValue": 0,
"show": false,
"thresholdLabels": false,
"thresholdMarkers": true
},
"height": "20",
"id": 5,
"interval": null,
"isNew": true,
"links": [],
"mappingType": 1,
"mappingTypes": [
{
"name": "value to text",
"value": 1
},
{
"name": "range to text",
"value": 2
}
],
"maxDataPoints": 100,
"nullPointMode": "connected",
"nullText": null,
"postfix": "",
"postfixFontSize": "50%",
"prefix": "",
"prefixFontSize": "50%",
"rangeMaps": [
{
"from": "null",
"text": "N/A",
"to": "null"
}
],
"span": 4,
"sparkline": {
"fillColor": "rgba(31, 118, 189, 0.18)",
"full": false,
"lineColor": "rgb(31, 120, 193)",
"show": false
},
"targets": [
{
"expr": "sum(container_memory_usage_bytes{instance=~\"$node:$port\",job=~\"$job\",image!=\"\"})/1024/1024",
"intervalFactor": 2,
"legendFormat": "",
"metric": "container_memory_usage_bytes",
"refId": "A",
"step": 240
}
],
"thresholds": "",
"title": "Total Memory Usage",
"transparent": true,
"type": "singlestat",
"valueFontSize": "80%",
"valueMaps": [
{
"op": "=",
"text": "N/A",
"value": "null"
}
],
"valueName": "current"
},
{
"cacheTimeout": null,
"colorBackground": false,
"colorValue": false,
"colors": [
"rgba(245, 54, 54, 0.9)",
"rgba(237, 129, 40, 0.89)",
"rgba(50, 172, 45, 0.97)"
],
"datasource": "${DS_PROMETHEUS}",
"editable": true,
"error": false,
"format": "percent",
"gauge": {
"maxValue": 100,
"minValue": 0,
"show": false,
"thresholdLabels": false,
"thresholdMarkers": true
},
"height": "20",
"id": 6,
"interval": null,
"isNew": true,
"links": [],
"mappingType": 1,
"mappingTypes": [
{
"name": "value to text",
"value": 1
},
{
"name": "range to text",
"value": 2
}
],
"maxDataPoints": 100,
"nullPointMode": "connected",
"nullText": null,
"postfix": "",
"postfixFontSize": "50%",
"prefix": "",
"prefixFontSize": "50%",
"rangeMaps": [
{
"from": "null",
"text": "N/A",
"to": "null"
}
],
"span": 4,
"sparkline": {
"fillColor": "rgba(31, 118, 189, 0.18)",
"full": false,
"lineColor": "rgb(31, 120, 193)",
"show": false
},
"targets": [
{
"expr": "sum(rate(container_cpu_user_seconds_total{instance=~\"$node:$port\",job=~\"$job\",image!=\"\"}[5m]) * 100)",
"intervalFactor": 2,
"legendFormat": "",
"metric": "container_memory_usage_bytes",
"refId": "A",
"step": 240
}
],
"thresholds": "",
"title": "Total CPU Usage",
"transparent": true,
"type": "singlestat",
"valueFontSize": "80%",
"valueMaps": [
{
"op": "=",
"text": "N/A",
"value": "null"
}
],
"valueName": "current"
}
],
"title": "Summary"
},
{
"collapse": false,
"editable": true,
"height": "250px",
"panels": [
{
"aliasColors": {},
"bars": false,
"datasource": "${DS_PROMETHEUS}",
"decimals": 2,
"editable": true,
"error": false,
"fill": 1,
"grid": {
"threshold1": null,
"threshold1Color": "rgba(216, 200, 27, 0.27)",
"threshold2": null,
"threshold2Color": "rgba(234, 112, 112, 0.22)"
},
"id": 2,
"isNew": true,
"legend": {
"alignAsTable": true,
"avg": true,
"current": true,
"max": false,
"min": false,
"rightSide": true,
"show": true,
"total": false,
"values": true
},
"lines": true,
"linewidth": 2,
"links": [],
"nullPointMode": "connected",
"percentage": false,
"pointradius": 5,
"points": false,
"renderer": "flot",
"seriesOverrides": [],
"span": 12,
"stack": false,
"steppedLine": false,
"targets": [
{
"expr": "rate(container_cpu_user_seconds_total{instance=~\"$node:$port\",job=~\"$job\",image!=\"\"}[5m]) * 100",
"intervalFactor": 2,
"legendFormat": "{{name}}",
"metric": "cpu",
"refId": "A",
"step": 10
}
],
"timeFrom": null,
"timeShift": null,
"title": "CPU Usage",
"tooltip": {
"msResolution": false,
"shared": true,
"sort": 0,
"value_type": "cumulative"
},
"transparent": false,
"type": "graph",
"xaxis": {
"show": true
},
"yaxes": [
{
"format": "percent",
"label": null,
"logBase": 1,
"max": null,
"min": null,
"show": true
},
{
"format": "short",
"label": null,
"logBase": 1,
"max": null,
"min": null,
"show": true
}
]
}
],
"title": "CPU"
},
{
"collapse": false,
"editable": true,
"height": "250px",
"panels": [
{
"aliasColors": {},
"bars": false,
"datasource": "${DS_PROMETHEUS}",
"decimals": 2,
"editable": true,
"error": false,
"fill": 1,
"grid": {
"threshold1": null,
"threshold1Color": "rgba(216, 200, 27, 0.27)",
"threshold2": null,
"threshold2Color": "rgba(234, 112, 112, 0.22)"
},
"id": 1,
"isNew": true,
"legend": {
"alignAsTable": true,
"avg": true,
"current": true,
"max": false,
"min": false,
"rightSide": true,
"show": true,
"total": false,
"values": true
},
"lines": true,
"linewidth": 2,
"links": [],
"nullPointMode": "connected",
"percentage": false,
"pointradius": 5,
"points": false,
"renderer": "flot",
"seriesOverrides": [],
"span": 12,
"stack": false,
"steppedLine": false,
"targets": [
{
"expr": "container_memory_usage_bytes{instance=~\"$node:$port\",job=~\"$job\",image!=\"\"}",
"hide": false,
"intervalFactor": 2,
"legendFormat": "{{name}}",
"metric": "container_memory_usage_bytes",
"refId": "A",
"step": 10
}
],
"timeFrom": null,
"timeShift": null,
"title": "Memory Usage",
"tooltip": {
"msResolution": false,
"shared": true,
"sort": 0,
"value_type": "cumulative"
},
"transparent": false,
"type": "graph",
"xaxis": {
"show": true
},
"yaxes": [
{
"format": "bytes",
"label": "",
"logBase": 1,
"max": null,
"min": null,
"show": true
},
{
"format": "short",
"label": null,
"logBase": 1,
"max": null,
"min": null,
"show": false
}
]
}
],
"title": "Memory"
},
{
"collapse": false,
"editable": true,
"height": "250px",
"panels": [
{
"aliasColors": {},
"bars": false,
"datasource": "${DS_PROMETHEUS}",
"editable": true,
"error": false,
"fill": 1,
"grid": {
"threshold1": null,
"threshold1Color": "rgba(216, 200, 27, 0.27)",
"threshold2": null,
"threshold2Color": "rgba(234, 112, 112, 0.22)"
},
"id": 3,
"isNew": true,
"legend": {
"avg": false,
"current": false,
"max": false,
"min": false,
"show": true,
"total": false,
"values": false
},
"lines": true,
"linewidth": 2,
"links": [],
"nullPointMode": "connected",
"percentage": false,
"pointradius": 5,
"points": false,
"renderer": "flot",
"seriesOverrides": [],
"span": 6,
"stack": false,
"steppedLine": false,
"targets": [
{
"expr": "irate(container_network_receive_bytes_total{instance=~\"$node:$port\",job=~\"$job\",image!=\"\"}[5m])",
"intervalFactor": 2,
"legendFormat": "{{name}}",
"metric": "container_network_receive_bytes_total",
"refId": "A",
"step": 20
}
],
"timeFrom": null,
"timeShift": null,
"title": "Network Rx",
"tooltip": {
"msResolution": false,
"shared": true,
"sort": 0,
"value_type": "cumulative"
},
"type": "graph",
"xaxis": {
"show": true
},
"yaxes": [
{
"format": "Bps",
"label": null,
"logBase": 1,
"max": null,
"min": null,
"show": true
},
{
"format": "short",
"label": null,
"logBase": 1,
"max": null,
"min": null,
"show": true
}
]
},
{
"aliasColors": {},
"bars": false,
"datasource": "${DS_PROMETHEUS}",
"editable": true,
"error": false,
"fill": 1,
"grid": {
"threshold1": null,
"threshold1Color": "rgba(216, 200, 27, 0.27)",
"threshold2": null,
"threshold2Color": "rgba(234, 112, 112, 0.22)"
},
"id": 4,
"isNew": true,
"legend": {
"avg": false,
"current": false,
"max": false,
"min": false,
"show": true,
"total": false,
"values": false
},
"lines": true,
"linewidth": 2,
"links": [],
"nullPointMode": "connected",
"percentage": false,
"pointradius": 5,
"points": false,
"renderer": "flot",
"seriesOverrides": [],
"span": 6,
"stack": false,
"steppedLine": false,
"targets": [
{
"expr": "irate(container_network_transmit_bytes_total{instance=~\"$node:$port\",job=~\"$job\",image!=\"\"}[5m])",
"intervalFactor": 2,
"legendFormat": "{{name}}",
"refId": "A",
"step": 20
}
],
"timeFrom": null,
"timeShift": null,
"title": "Network Tx",
"tooltip": {
"msResolution": false,
"shared": true,
"sort": 0,
"value_type": "cumulative"
},
"type": "graph",
"xaxis": {
"show": true
},
"yaxes": [
{
"format": "Bps",
"label": null,
"logBase": 1,
"max": null,
"min": null,
"show": true
},
{
"format": "short",
"label": null,
"logBase": 1,
"max": null,
"min": null,
"show": true
}
]
}
],
"title": "Network"
},
{
"collapse": false,
"editable": true,
"height": "250px",
"panels": [
{
"aliasColors": {},
"bars": false,
"datasource": "${DS_PROMETHEUS}",
"editable": true,
"error": false,
"fill": 1,
"grid": {
"threshold1": null,
"threshold1Color": "rgba(216, 200, 27, 0.27)",
"threshold2": null,
"threshold2Color": "rgba(234, 112, 112, 0.22)"
},
"id": 8,
"isNew": true,
"legend": {
"avg": false,
"current": false,
"max": false,
"min": false,
"show": true,
"total": false,
"values": false
},
"lines": true,
"linewidth": 2,
"links": [],
"nullPointMode": "connected",
"percentage": false,
"pointradius": 5,
"points": false,
"renderer": "flot",
"seriesOverrides": [],
"span": 6,
"stack": false,
"steppedLine": false,
"targets": [
{
"expr": "irate(container_fs_reads_bytes_total{instance=~\"$node:$port\",job=~\"$job\",image!=\"\"}[5m])",
"intervalFactor": 2,
"legendFormat": "{{name}}",
"metric": "container_fs_reads_bytes_total",
"refId": "A",
"step": 20
}
],
"timeFrom": null,
"timeShift": null,
"title": "I/O Rx",
"tooltip": {
"msResolution": false,
"shared": true,
"sort": 0,
"value_type": "cumulative"
},
"type": "graph",
"xaxis": {
"show": true
},
"yaxes": [
{
"format": "Bps",
"label": null,
"logBase": 1,
"max": null,
"min": null,
"show": true
},
{
"format": "short",
"label": null,
"logBase": 1,
"max": null,
"min": null,
"show": true
}
]
},
{
"aliasColors": {},
"bars": false,
"datasource": "${DS_PROMETHEUS}",
"editable": true,
"error": false,
"fill": 1,
"grid": {
"threshold1": null,
"threshold1Color": "rgba(216, 200, 27, 0.27)",
"threshold2": null,
"threshold2Color": "rgba(234, 112, 112, 0.22)"
},
"id": 9,
"isNew": true,
"legend": {
"avg": false,
"current": false,
"max": false,
"min": false,
"show": true,
"total": false,
"values": false
},
"lines": true,
"linewidth": 2,
"links": [],
"nullPointMode": "connected",
"percentage": false,
"pointradius": 5,
"points": false,
"renderer": "flot",
"seriesOverrides": [],
"span": 6,
"stack": false,
"steppedLine": false,
"targets": [
{
"expr": "irate(container_fs_writes_bytes_total{instance=~\"$node:$port\",job=~\"$job\",image!=\"\"}[5m])",
"intervalFactor": 2,
"legendFormat": "{{name}}",
"metric": "container_fs_writes_bytes_total",
"refId": "A",
"step": 20
}
],
"timeFrom": null,
"timeShift": null,
"title": "I/O Tx",
"tooltip": {
"msResolution": false,
"shared": true,
"sort": 0,
"value_type": "cumulative"
},
"type": "graph",
"xaxis": {
"show": true
},
"yaxes": [
{
"format": "Bps",
"label": null,
"logBase": 1,
"max": null,
"min": null,
"show": true
},
{
"format": "short",
"label": null,
"logBase": 1,
"max": null,
"min": null,
"show": true
}
]
}
],
"title": "I/O"
}
],
"time": {
"from": "now-3h",
"to": "now"
},
"timepicker": {
"refresh_intervals": [
"5s",
"10s",
"30s",
"1m",
"5m",
"15m",
"30m",
"1h",
"2h",
"1d"
],
"time_options": [
"5m",
"15m",
"1h",
"6h",
"12h",
"24h",
"2d",
"7d",
"30d"
]
},
"templating": {
"list": [
{
"allValue": null,
"current": {},
"datasource": "${DS_PROMETHEUS}",
"hide": 0,
"includeAll": false,
"label": "Job",
"multi": false,
"name": "job",
"options": [],
"query": "label_values(container_cpu_user_seconds_total, job)",
"refresh": 1,
"regex": "",
"sort": 1,
"tagValuesQuery": "",
"tags": [],
"tagsQuery": "",
"type": "query",
"useTags": false
},
{
"allValue": null,
"current": {},
"datasource": "${DS_PROMETHEUS}",
"hide": 0,
"includeAll": false,
"label": "Host:",
"multi": false,
"name": "node",
"options": [],
"query": "label_values(container_cpu_user_seconds_total{job=~\"$job\"}, instance)",
"refresh": 1,
"regex": "/([^:]+):.*/",
"sort": 1,
"tagValuesQuery": "",
"tags": [],
"tagsQuery": "",
"type": "query",
"useTags": false
},
{
"allValue": null,
"current": {},
"datasource": "${DS_PROMETHEUS}",
"hide": 0,
"includeAll": false,
"label": "Port",
"multi": false,
"name": "port",
"options": [],
"query": "label_values(container_cpu_user_seconds_total{instance=~\"$node:(.*)\"}, instance)",
"refresh": 1,
"regex": "/[^:]+:(.*)/",
"sort": 3,
"tagValuesQuery": "",
"tags": [],
"tagsQuery": "",
"type": "query",
"useTags": false
}
]
},
"annotations": {
"list": []
},
"refresh": "10s",
"schemaVersion": 12,
"version": 26,
"links": [],
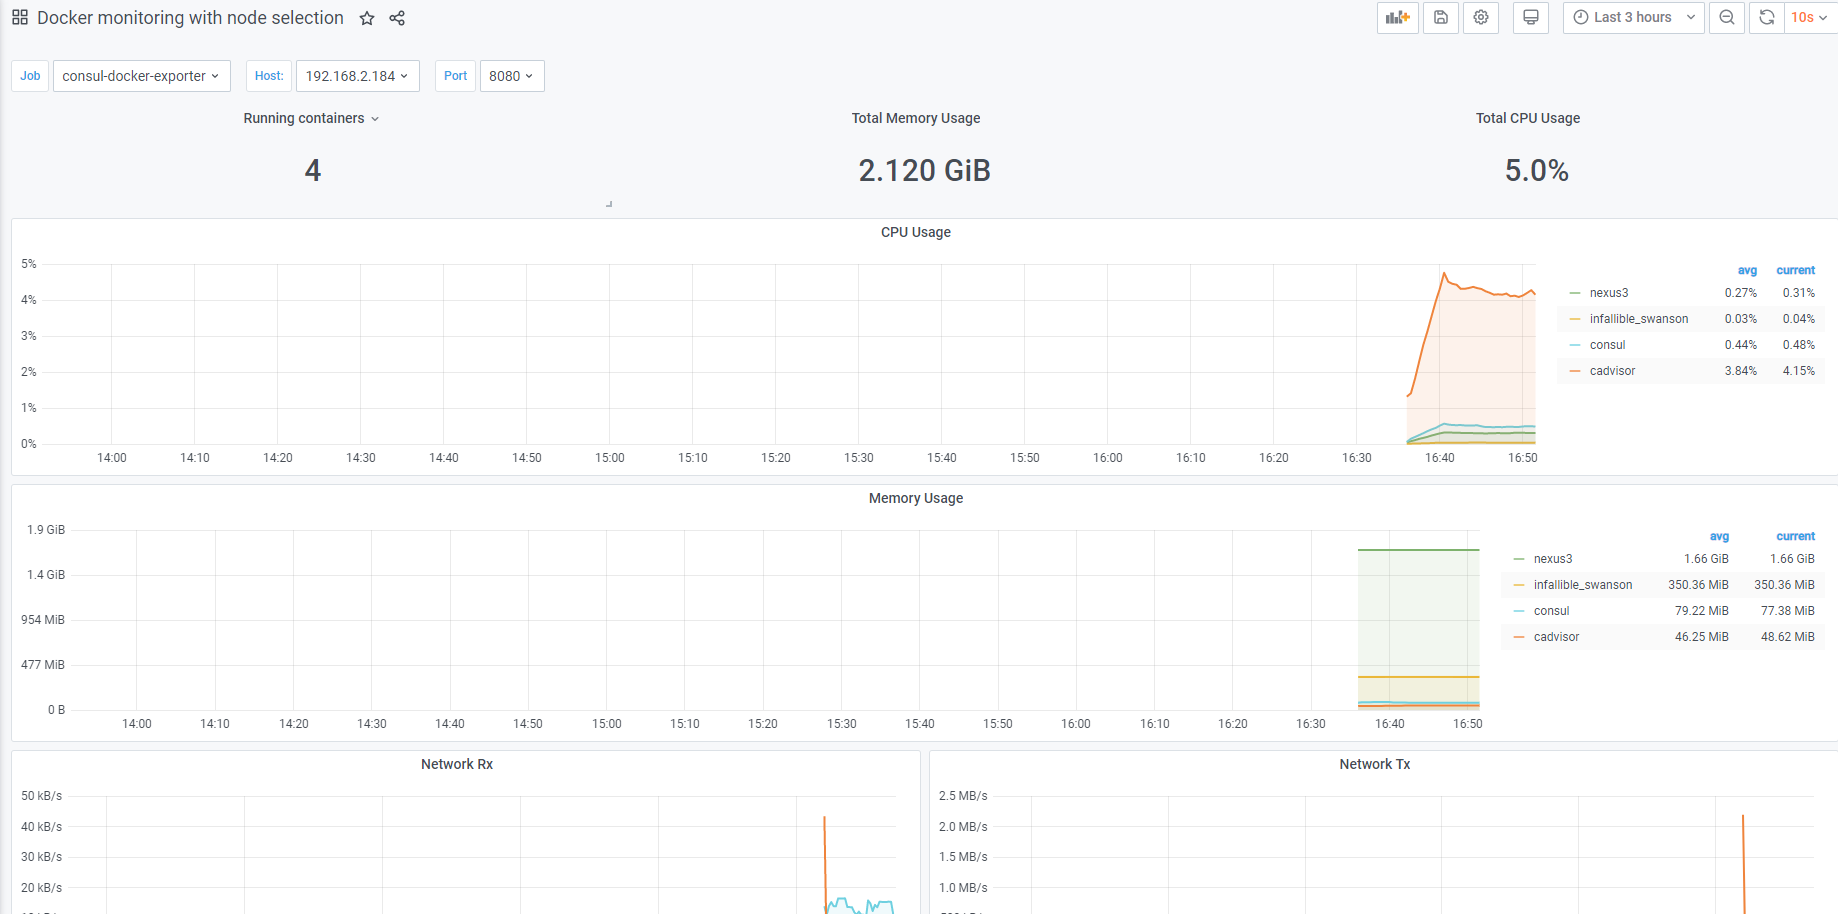
"gnetId": 8321
}最终效果
下线服务
注册后,想要下线服务,可以通过调用consul接口的方式,执行下线操作
//docker-exporter-192.168.2.184是consul-node.json中的ID属性
curl -X PUT http://192.168.2.184:8500/v1/agent/service/deregister/docker-exporter-192.168.2.184


 955
955


 被折叠的 条评论
为什么被折叠?
被折叠的 条评论
为什么被折叠?
 到【灌水乐园】发言


