


This document is going to guide you how to set up an ELK cluster for syslog parsing for network devices.
Following components will be leveraged to set up the whole environment, they are:
- Logstash
- Elasticsearch
- Kibana
Logstash: Here we are leveraging its indexer to aggregate the input data and making index for them. Input data comes from the router/switch device or Linux servers.
Elasticsearch: The storage of structuralization data which is input from Logstash indexer.
Kibana: A GUI portal to display the data and message from Elasticsearch.
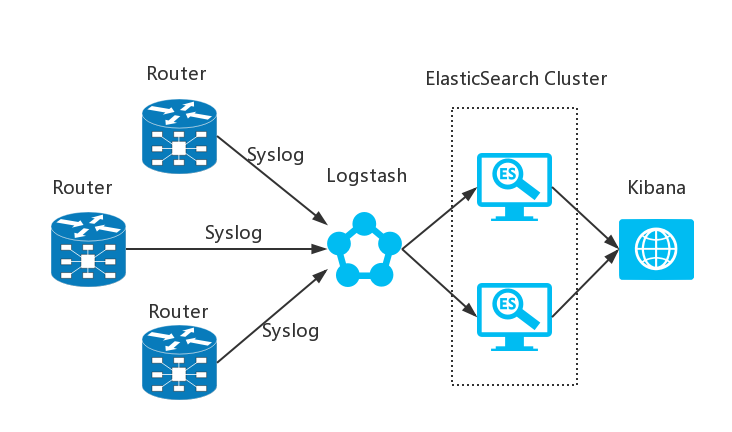
The topology is as below, we will configure the router to send out the syslog to Logstash for indexing, and Logstash will then forward to ElasticSearch cluster for centralized archiving, Kibana will connect to ElasticSearch to display the collected logs.
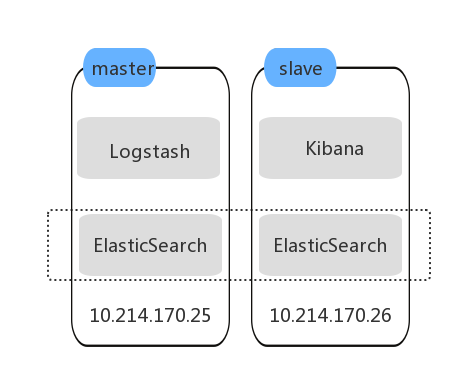
In our case, we are using Linux servers to build up the environment, one is the ElasticSearch master node and the other one is the ElasticSearch slave node. Logstash is running on the master node , and Kibana is running on the slave node , it is connected to the master ElasticSearch instance by default.
1.ELK installation
a) Install Java JDK
Download Java JDK from the link below and upload via SFTP.
http://www.oracle.com/technetwork/java/javase/downloads/jdk8-downloads-2133151.html
Install Java JDK via the command below.
b) Install ElasticSearch on both of the nodes.
Because ElasticSearch can't run under the root account, we need to create a new user called elsearch
c) Install Kibana on the passive node
Kibana is by default listening on port 5601, so in our test case we can access the kibana portal via http://10.214.170.26:5601 after installation.
d) Install Logstash on the master node
https://www.elastic.co/guide/en/logstash/current/configuration.html
cd /opt
wget https://artifacts.elastic.co/downloads/logstash/logstash-5.5.1.tar.gz
tar -xzf logstash-5.5.1.tar.gz
cd logstash-5.5.1
touch logstash-syslog.conf
vi logstash-syslog.conf

		input {
		  tcp {
			port => 514
			type => syslog
		  }
		  udp {
			port => 514
			type => syslog
		  }
		}

		filter {
		  if [type] == "syslog" {
			grok {
			  match => { "<%{POSINT:syslog_pri}>%{SYSLOGTIMESTAMP:syslog_timestamp} %{SYSLOGHOST:syslog_hostname} %{DATA:syslog_program}(?:\[%{POSINT:syslog_pid}\])?: %{GREEDYDATA:syslog_message}" }
			  add_field => [ "received_at", "%{@timestamp}" ]
			  add_field => [ "received_from", "%{host}" ]
			}
			date {
			  match => [ "syslog_timestamp", "MMM  d HH:mm:ss", "MMM dd HH:mm:ss" ]
			}
			# Parse the syslog severity and facility
  			syslog_pri { }
		  }
		}

		output {
		  elasticsearch { hosts => ["localhost:9200"] }
		  stdout { codec => rubydebug }
		}

./bin/logstash -f logstash-syslog.conf & |
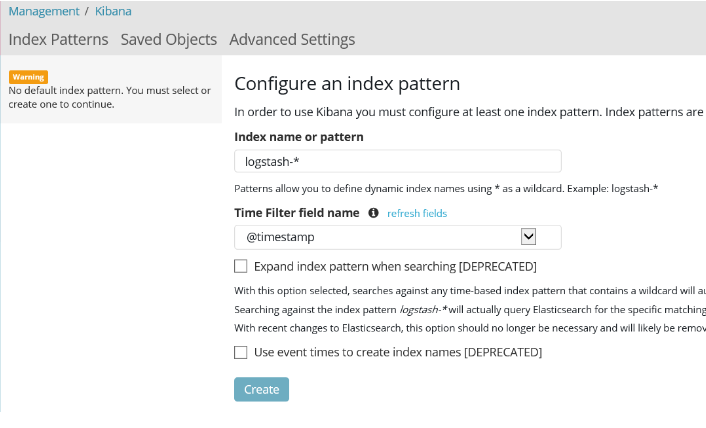
e) configure Kibana index pattern
Telnet to the port 514 of the logstash server to trigger the index process then open the Kibana portal to configure the Index name as logstash-*.
2.Setup ElasticSearch Cluster
a) on the master node, change the ElasticSearch configuration as below
cluster.name: ELK_Cluster
node.name: ELK_Node1
b) on the master node, change the ElasticSearch configuration as below. (10.214.170.25 is the IP address of the master node in our test case)
cluster.name: ELK_Cluster
node.name: ELK_Node2
discovery.zen.ping.unicast.hosts: 10.214.170.25
c) Restart the ElasticSearch Service on both nodes to take effect
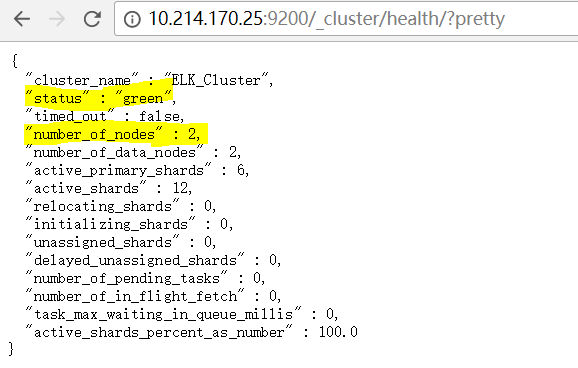
d) Access http://10.214.170.25:9200/_cluster/health/?pretty to get the cluster status. From the output as below, we can see the ElasticSearch cluster is in Green/healthy status with two nodes running.
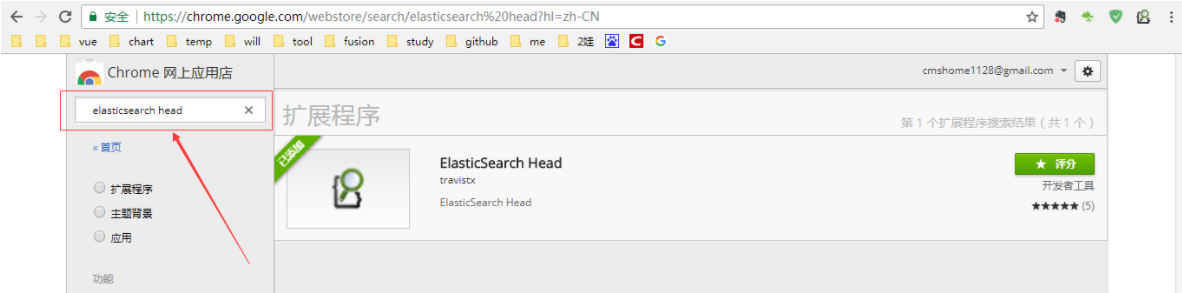
e) Install Chrome extension ElasticSearch Head, this is a tool to get some more detailed information from the ElasticSearch endpoint.
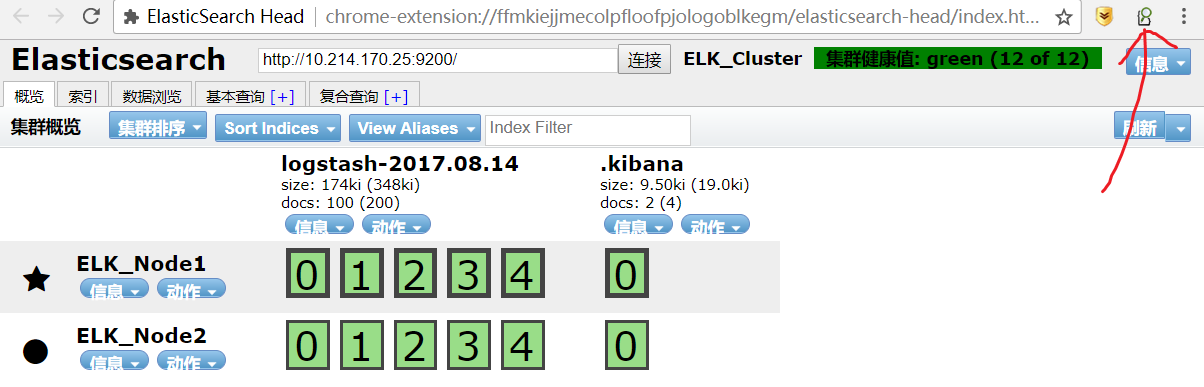
f)from the extension tool, connect to port 9200 of either ElasticSearch node, it will show us the current node information like which node is the master node and also the cluster status.
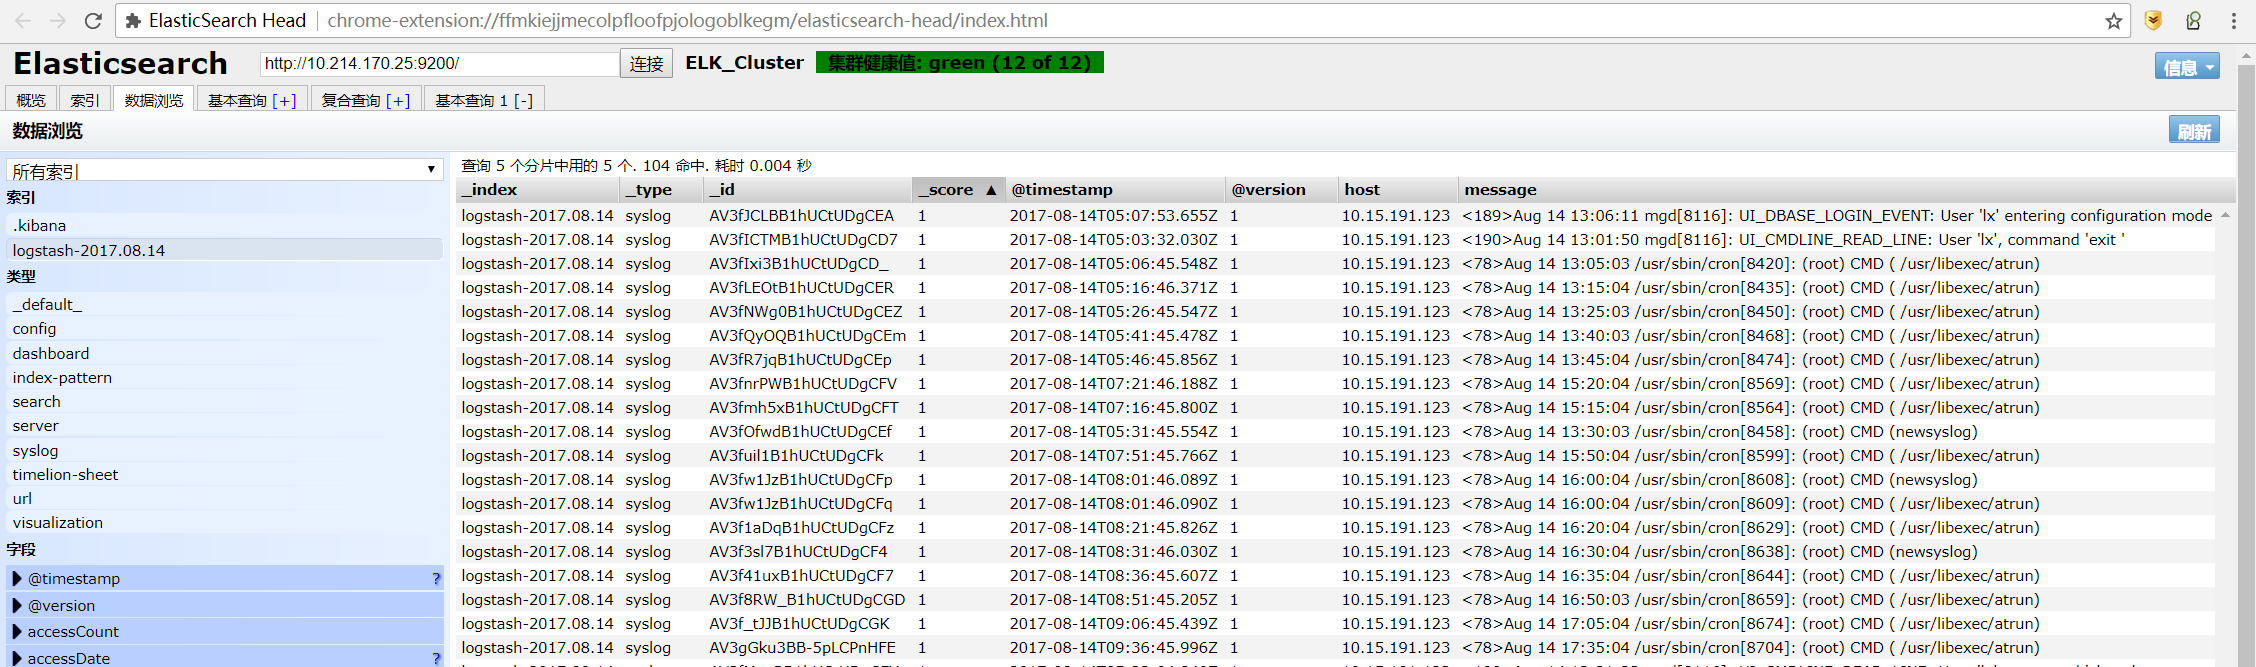
g) On the data navigation tab, we can also check the indexed data saved within ElasticSearch
3.Enable Syslog On The Clients
a) on the Juniper device
1) run the command below in configuration mode on the Juniper device to send syslog to a remote server. x.x.x.x is where to insert the syslog server and it is using port 514 by default.
set system syslog host x.x.x.x any any
2) If we want to check the Juniper logs manually we can run the two commands below.
show log messages | last
show log interactive-commands | last
b) on the Linux machine
Here I am taking Centos 7.2 as an example to introduce how to send out syslog from a Linux machine.
1) Edit /etc/rsyslog.conf and enable *.* @@remote-host:514 like *.* @@10.214.170.25:5000, we can change to any port number as what we like.
2) Restart the syslog service by running systemctl start rsyslog.
3) The logs below will then be sent to the syslog server.
/var/log/dmesg
/var/log/messages
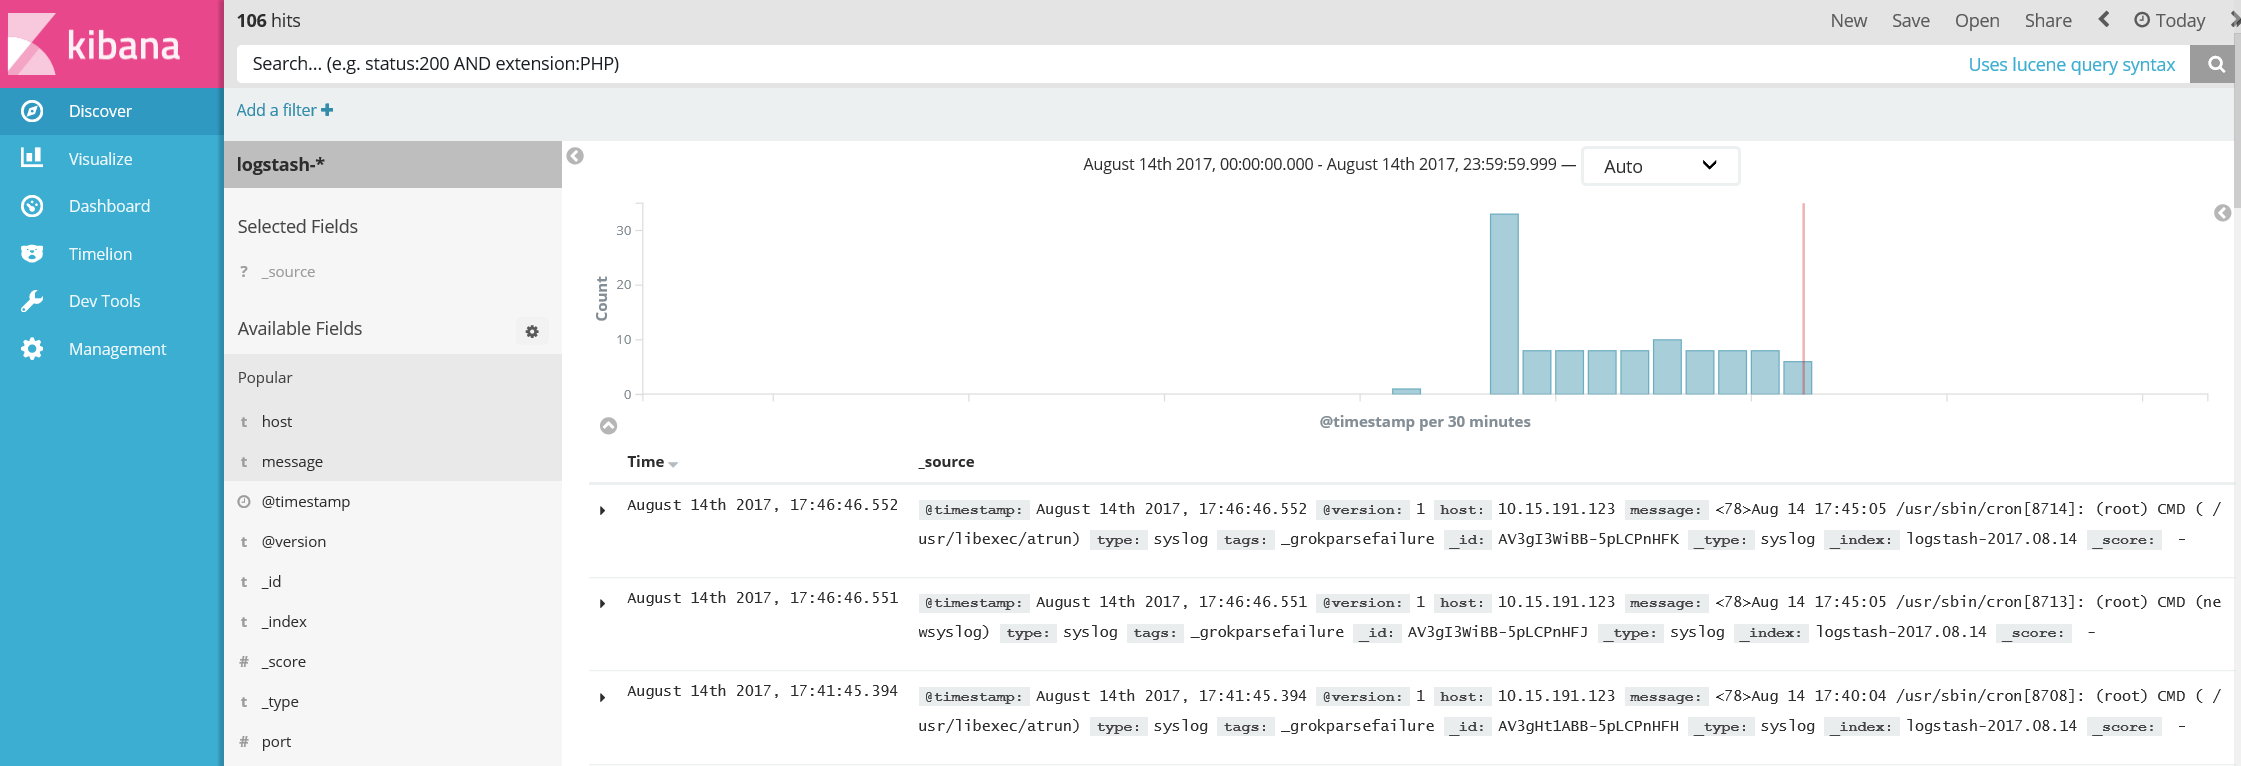
c) check the logs from Kibana
If all the configuration is successful, when we open up the Kibana portal we will see the logs uploaded from the syslog clients.


 4200
4200

 被折叠的 条评论
为什么被折叠?
被折叠的 条评论
为什么被折叠?
 到【灌水乐园】发言


