


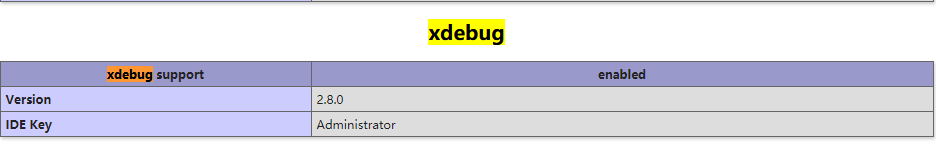
**一、**打印出phpinfo()信息,如下:

二、使用xdebug官方提供的一个检测工具:https://xdebug.org/wizard.php

三、检测版本进行下载

四、把下载好的扩展放在php的ext下

五、配置php.ini
[xdebug]
zend_extension ="E:\laragon\bin\php\php-7.1.1-Win32-VC14-x86\ext\php_xdebug-2.8.0-7.1-vc14.dll"

xdebug.remote_enable = On
;启用性能检测分析
xdebug.profiler_enable = On
;启用代码自动跟踪
xdebug.auto_trace=On
xdebug.profiler_enable_trigger = On
xdebug.profiler_output_name = cachegrind.out.%t.%p
;指定性能分析文件的存放目录
xdebug.profiler_output_dir ="G:/wamp64/tmp"
xdebug.show_local_vars=0

;配置端口和监听的域名
xdebug.remote_port=9100
xdebug.remote_host="127.0.0.1"
xdebug.idekey="PHPSTORM"
六、重启环境
七、配置相关信息


非框架项目指定项目目录

八、测试结果在这里插入代码片

框架项目


九、使用Postman请求参数无效解决方法
携带一次即可


 1464
1464


 被折叠的 条评论
为什么被折叠?
被折叠的 条评论
为什么被折叠?
 到【灌水乐园】发言


