


SVM----(Python)
1、mlpy库中SVM常用函数
(1)class mlpy.LibSvm(svm_type=’c_svc’, kernel_type=’linear’, degree=3,
gamma=0.001, coef0=0, C=1,nu=0.5, eps=0.001, p=0.1,
cache_size=100, shrinking=True,
probability=False,weight={})
参数:
- svm_type [string] SVM type, 可以是其中一个: ‘c_svc’, ‘nu_svc’, ‘one_class’, ‘epsilon_svr’,‘nu_svr’
- kernel_type [string] kernel type,可以是其中一个: ‘linear’ (uT*v), ‘poly’ ((gamma*uT*v +coef0)^degree), ‘rbf’ (exp(-gamma*|u-v|^2)), ‘sigmoid’ (tanh(gamma*uT*v + coef0))
- degree [int (for ‘poly’ kernel_type)] degree in kernel
- gamma [float (for ‘poly’, ‘rbf’, ‘sigmoid’ kernel_type)] gamma in kernel (e.g. 1 / number of features)
- coef0 [float (for ‘poly’, ‘sigmoid’ kernel_type)] coef0 in kernel
- C [float (for ‘c_svc’, ‘epsilon_svr’, ‘nu_svr’)] cost of constraints violation
- nu [float (for ‘nu_svc’, ‘one_class’, ‘nu_svr’)] nu parameter
- eps [float] stopping criterion, usually 0.00001 in nu-SVC, 0.001 in others
- p [float (for ‘epsilon_svr’)] p is the epsilon in epsilon-insensitive loss function of epsilon-SVM regression
- cache_size [float [MB]] size of the kernel cache, specified in megabytes
- shrinking [bool] use the shrinking heuristics
- probability [bool] predict probability estimates
- weight [dict] changes the penalty for some classes (if the weight for a class is not changed, it is set to 1). For example, to change penalty for classes 1 and 2 to 0.5 and 0.8 respectively set weight={1:0.5, 2:0.8}
参数:
- x [2d array_like object] training data (N, P)
- y [1d array_like object] target values (N)
参数:
- t [1d (one sample) or 2d array_like object] test data ([M,] P)
(4)LibSvm.pred_probability(t)
Returns C (number of classes) probability estimates. For a ‘c_svc’ and ‘nu_svc’ classification models with
probability information, this method computes ‘number of classes’ probability estimates.
参数:
probability estimates [1d (C) or 2d numpy array (M,C)] probability estimates for each observation.
Returns C (number of classes) probability estimates. For a ‘c_svc’ and ‘nu_svc’ classification models with
probability information, this method computes ‘number of classes’ probability estimates.
参数:
- t [1d (one sample) or 2d array_like object] test data ([M,] P)
probability estimates [1d (C) or 2d numpy array (M,C)] probability estimates for each observation.
(5)LibSvm.pred_values(t)
Returns D decision values. For a classification model with C classes, this method returns D=C*(C-1)/2
decision values for each test sample. The order is label[0] vs. label[1], ..., label[0] vs. label[C-1], label[1]
vs. label[2], ..., label[C-2] vs. label[C-1], where label can be obtained from the method labels().
For a one-class model, this method returns D=1 decision value for each test sample.
For a regression model, this method returns the predicted value as in pred()
参数:
- t [1d (one sample) or 2d array_like object] test data ([M,] P)
decision values [1d (D) or 2d numpy array (M,D)] decision values for each observation.
(6)LibSvm.labels()
For a classification model, this method outputs the name of labels. For regression and one-class models,
this method returns None.
(7)LibSvm.nclasses()
Get the number of classes. = 2 in regression and in one class SVM
(8)LibSvm.nsv()
Get the total number of support vectors.
(9)LibSvm.label_nsv()
Return a dictionary containing the number of support vectors for each class (for classification).
(10)static LibSvm.load_model(filename)
Loads model from file. Returns a LibSvm object with the learn() method disabled.
(11)LibSvm.save_model(filename)
Saves model to a file.
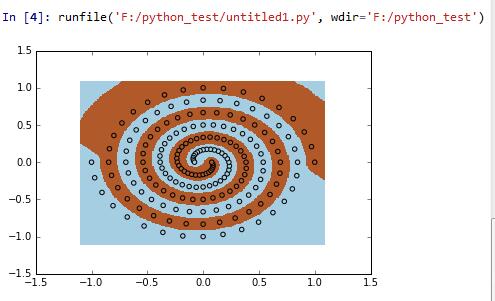
官方实例
import numpy as np
import matplotlib.pyplot as plt
import mlpy
f = np.loadtxt("spiral.data")
x, y = f[:, :2], f[:, 2]
svm = mlpy.LibSvm(svm_type='c_svc', kernel_type='rbf', gamma=100)
svm.learn(x, y)
xmin, xmax = x[:,0].min()-0.1, x[:,0].max()+0.1
ymin, ymax = x[:,1].min()-0.1, x[:,1].max()+0.1
xx, yy = np.meshgrid(np.arange(xmin, xmax, 0.01), np.arange(ymin, ymax, 0.01))
xnew = np.c_[xx.ravel(), yy.ravel()]
ynew = svm.pred(xnew).reshape(xx.shape)
fig = plt.figure(1)
plt.set_cmap(plt.cm.Paired)
plt.pcolormesh(xx, yy, ynew)
plt.scatter(x[:,0], x[:,1], c=y)
plt.show()
文件spiral.data中的内容:
1 0 1
-1 0 -1
0.971354 0.209317 1
-0.971354 -0.209317 -1
0.906112 0.406602 1
-0.906112 -0.406602 -1
0.807485 0.584507 1
-0.807485 -0.584507 -1
0.679909 0.736572 1
-0.679909 -0.736572 -1
0.528858 0.857455 1
-0.528858 -0.857455 -1
0.360603 0.943128 1
-0.360603 -0.943128 -1
0.181957 0.991002 1
-0.181957 -0.991002 -1
-3.07692e-06 1 1
3.07692e-06 -1 -1
-0.178211 0.970568 1
0.178211 -0.970568 -1
-0.345891 0.90463 1
0.345891 -0.90463 -1
-0.496812 0.805483 1
0.496812 -0.805483 -1
-0.625522 0.67764 1
0.625522 -0.67764 -1
-0.727538 0.52663 1
0.727538 -0.52663 -1
-0.799514 0.35876 1
0.799514 -0.35876 -1
-0.839328 0.180858 1
0.839328 -0.180858 -1
-0.846154 -6.66667e-06 1
0.846154 6.66667e-06 -1
-0.820463 -0.176808 1
0.820463 0.176808 -1
-0.763975 -0.342827 1
0.763975 0.342827 -1
-0.679563 -0.491918 1
0.679563 0.491918 -1
-0.57112 -0.618723 1
0.57112 0.618723 -1
-0.443382 -0.71888 1
0.443382 0.71888 -1
-0.301723 -0.78915 1
0.301723 0.78915 -1
-0.151937 -0.82754 1
0.151937 0.82754 -1
9.23077e-06 -0.833333 1
-9.23077e-06 0.833333 -1
0.148202 -0.807103 1
-0.148202 0.807103 -1
0.287022 -0.750648 1
-0.287022 0.750648 -1
0.411343 -0.666902 1
-0.411343 0.666902 -1
0.516738 -0.559785 1
-0.516738 0.559785 -1
0.599623 -0.43403 1
-0.599623 0.43403 -1
0.65738 -0.294975 1
-0.65738 0.294975 -1
0.688438 -0.14834 1
-0.688438 0.14834 -1
0.692308 1.16667e-05 1
-0.692308 -1.16667e-05 -1
0.669572 0.144297 1
-0.669572 -0.144297 -1
0.621838 0.27905 1
-0.621838 -0.27905 -1
0.551642 0.399325 1
-0.551642 -0.399325 -1
0.462331 0.500875 1
-0.462331 -0.500875 -1
0.357906 0.580303 1
-0.357906 -0.580303 -1
0.242846 0.635172 1
-0.242846 -0.635172 -1
0.12192 0.664075 1
-0.12192 -0.664075 -1
-1.07692e-05 0.666667 1
1.07692e-05 -0.666667 -1
-0.118191 0.643638 1
0.118191 -0.643638 -1
-0.228149 0.596667 1
0.228149 -0.596667 -1
-0.325872 0.528323 1
0.325872 -0.528323 -1
-0.407954 0.441933 1
0.407954 -0.441933 -1
-0.471706 0.341433 1
0.471706 -0.341433 -1
-0.515245 0.231193 1
0.515245 -0.231193 -1
-0.537548 0.115822 1
0.537548 -0.115822 -1
-0.538462 -1.33333e-05 1
0.538462 1.33333e-05 -1
-0.518682 -0.111783 1
0.518682 0.111783 -1
-0.479702 -0.215272 1
0.479702 0.215272 -1
-0.423723 -0.306732 1
0.423723 0.306732 -1
-0.353545 -0.383025 1
0.353545 0.383025 -1
-0.272434 -0.441725 1
0.272434 0.441725 -1
-0.183971 -0.481192 1
0.183971 0.481192 -1
-0.0919062 -0.500612 1
0.0919062 0.500612 -1
1.23077e-05 -0.5 1
-1.23077e-05 0.5 -1
0.0881769 -0.480173 1
-0.0881769 0.480173 -1
0.169275 -0.442687 1
-0.169275 0.442687 -1
0.2404 -0.389745 1
-0.2404 0.389745 -1
0.299169 -0.324082 1
-0.299169 0.324082 -1
0.343788 -0.248838 1
-0.343788 0.248838 -1
0.373109 -0.167412 1
-0.373109 0.167412 -1
0.386658 -0.0833083 1
-0.386658 0.0833083 -1
0.384615 1.16667e-05 1
-0.384615 -1.16667e-05 -1
0.367792 0.0792667 1
-0.367792 -0.0792667 -1
0.337568 0.15149 1
-0.337568 -0.15149 -1
0.295805 0.214137 1
-0.295805 -0.214137 -1
0.24476 0.265173 1
-0.24476 -0.265173 -1
0.186962 0.303147 1
-0.186962 -0.303147 -1
0.125098 0.327212 1
-0.125098 -0.327212 -1
0.0618938 0.337147 1
-0.0618938 -0.337147 -1
-1.07692e-05 0.333333 1
1.07692e-05 -0.333333 -1
-0.0581615 0.31671 1
0.0581615 -0.31671 -1
-0.110398 0.288708 1
0.110398 -0.288708 -1
-0.154926 0.251167 1
0.154926 -0.251167 -1
-0.190382 0.206232 1
0.190382 -0.206232 -1
-0.215868 0.156247 1
0.215868 -0.156247 -1
-0.230974 0.103635 1
0.230974 -0.103635 -1
-0.235768 0.050795 1
0.235768 -0.050795 -1
-0.230769 -1e-05 1
0.230769 1e-05 -1
-0.216903 -0.0467483 1
0.216903 0.0467483 -1
-0.195432 -0.0877067 1
0.195432 0.0877067 -1
-0.167889 -0.121538 1
0.167889 0.121538 -1
-0.135977 -0.14732 1
0.135977 0.14732 -1
-0.101492 -0.164567 1
0.101492 0.164567 -1
-0.0662277 -0.17323 1
0.0662277 0.17323 -1
-0.0318831 -0.173682 1
0.0318831 0.173682 -1
6.15385e-06 -0.166667 1
-6.15385e-06 0.166667 -1
0.0281431 -0.153247 1
-0.0281431 0.153247 -1
0.05152 -0.13473 1
-0.05152 0.13473 -1
0.0694508 -0.112592 1
-0.0694508 0.112592 -1
0.0815923 -0.088385 1
-0.0815923 0.088385 -1
0.0879462 -0.063655 1
-0.0879462 0.063655 -1
0.0888369 -0.0398583 1
-0.0888369 0.0398583 -1
0.0848769 -0.018285 1
-0.0848769 0.018285 -1
0.0769231 3.33333e-06 1
-0.0769231 -3.33333e-06 -1
实验结果
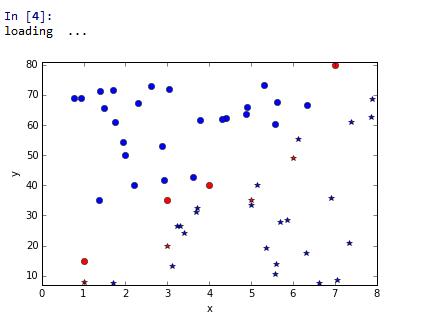
2、SVM--线性分类
import numpy as np
import matplotlib.pyplot as plt
import mlpy
print 'loading  ...'

x = [[1,8],[3,20],[1,15],[3,35],[5,35],[4,40],[7,80],[6,49]]
y=[1,1,0,0,1,0,0,1]
showpoint=['ro','r*']
tshowpoint=['bo','b*']
x=np.array(x)
y=np.array(y)
svm = mlpy.LibSvm()
svm.learn(x, y)
lp_x1 = x[:,0]
lp_x2 = x[:,1]
xmin, xmax = np.min(lp_x1)-1, np.max(lp_x1)+1
ymin, ymax = np.min(lp_x2)-1, np.max(lp_x2)+1
plt.subplot(111)
plt.xlabel(u"x")
plt.xlim(xmin, xmax)
plt.ylabel(u"y")
plt.ylim(ymin, ymax)
#显示样本点
for ii in xrange(0,len(x)):
    ty=svm.pred(x[ii])
    if ty>0:
        plt.plot(lp_x1[ii], lp_x2[ii], showpoint[int(ty)])
    else:
        plt.plot(lp_x1[ii], lp_x2[ii], showpoint[int(ty)])

#未知样本分类
tlp_x1=np.random.rand(50)*(xmax-xmin)+xmin
tlp_x2=np.random.rand(50)*(ymax-ymin)+xmin
tlp_x=np.array(zip(tlp_x1,tlp_x2))
for ii in xrange(0,len(tlp_x)):
    ty=svm.pred(tlp_x[ii])
    if ty>0:
        plt.plot(tlp_x1[ii],tlp_x2[ii], tshowpoint[int(ty)])
    else:
        plt.plot(tlp_x1[ii],tlp_x2[ii], tshowpoint[int(ty)])
plt.show()
运行结果(控制台显示)
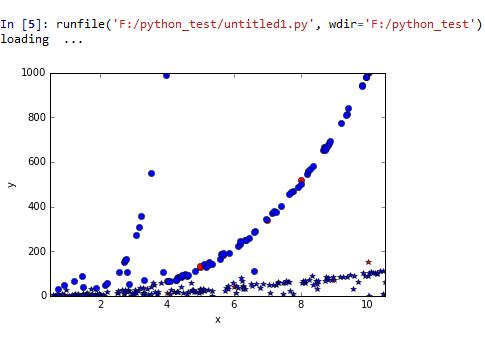
3、非线性分类
实例代码
import numpy as np
import matplotlib.pyplot as plt
import mlpy
print 'loading  ...'
x = [[1,1],[2,4],[3,12],[9,70],[5,130],[4,13],[5,29],[5,135],[4,65],[10,1000],[8,520],[7,340],[6,40],[10,150]]
y=[1,1,1,1,0,1,1,0,0,0,0,0,1,1]
showpoint=['ro','r*']
tshowpoint=['bo','b*']
x=np.array(x)
y=np.array(y)
svm = mlpy.LibSvm(svm_type='c_svc', kernel_type='poly', gamma=50)
svm.learn(x, y)
lp_x1 = x[:,0]
lp_x2 = x[:,1]
xmin, xmax = np.min(lp_x1)-0.5, np.max(lp_x1)+0.5
ymin, ymax = np.min(lp_x2)-0.5, np.max(lp_x2)+0.5
plt.subplot(111)
plt.xlabel(u"x")
plt.xlim(xmin, xmax)
plt.ylabel(u"y")
plt.ylim(ymin, ymax)
#显示样本点
for ii in xrange(0,len(x)):
    ty=svm.pred(x[ii])
    if ty>0:
        plt.plot(lp_x1[ii], lp_x2[ii], showpoint[int(ty)])
    else:
        plt.plot(lp_x1[ii], lp_x2[ii], showpoint[int(ty)])
#未知样本分类
tlp_x10=np.random.rand(100)*(xmax-xmin)+xmin
tlp_x20=tlp_x10**3+np.random.rand(100)*20-10
tlp_x11=np.random.rand(100)*(xmax-xmin)+xmin
tlp_x21=tlp_x11**2+np.random.rand(100)*20-10
tlp_x30=np.random.rand(50)*(xmax-xmin)+xmin
tlp_x31=tlp_x30**(round(np.random.rand()*6,0)+3)+np.random.rand(50)*10-5
tlp_x40=np.random.rand(50)*(xmax-xmin)+xmin
tlp_x41=tlp_x30**(round(np.random.rand(),0)+1)+np.random.rand(50)*10-5
tlp_x1=tlp_x10.tolist()+tlp_x11.tolist()+tlp_x30.tolist()+tlp_x40.tolist()
tlp_x2=tlp_x20.tolist()+tlp_x21.tolist()+tlp_x31.tolist()+tlp_x41.tolist()
tlp_x=np.array(zip(tlp_x1,tlp_x2))
for ii in xrange(0,len(tlp_x)):
    ty=svm.pred(tlp_x[ii])
    if ty>0:
        plt.plot(tlp_x1[ii],tlp_x2[ii], tshowpoint[int(ty)])
    else:
        plt.plot(tlp_x1[ii],tlp_x2[ii], tshowpoint[int(ty)])
plt.show()
运行结果


 5377
5377


 被折叠的 条评论
为什么被折叠?
被折叠的 条评论
为什么被折叠?
 到【灌水乐园】发言


