


一、执行流程
1.1 Replay流程
Database Replay实施的流程是workload_capture->workload preprocess->replay client prepare->replay->generate replay report,对于同一个capture可以进行多次replay
1.2 执行数据库
生产数据库:用于workload_capture,即负载捕获
迁移数据库:用于workload_ preprocess和replay,即负载预处理和负载重放
Replay client:用于发起workload的客户端进程
二、生产数据库
2.1创建capture目录
需要确保目录下无任何文件(目录rac各节点都要建),目录用来存放capture数据
mkdir -p /home/oracle/capdir
create or replace directory capdir as ‘/home/oracle/capdir’;
2.2创建过滤器(可以不用)
过滤器可以通过START_CAPTURE 过程的DEFAULT_ACTION 参数,参数值INCLUDE为排除过滤器或者EXCLUDE为包含过滤器。
创建TPCC用户执行信息的过滤器:
EXEC DBMS_WORKLOAD_CAPTURE.ADD_FILTER (‘filter_user1’, ‘USER’, ‘TPCC’);
过滤器其他方式:
exec dbms_workload_capture.ADD_FILTER( fname IN VARCHAR2, fattribute IN VARCHAR2,fvalueIN VARCHAR2);
- fattribute:
- INSTANCE_NUMBER - type NUMBER
- USER - type STRING
- MODULE - type STRING
- ACTION - type STRING
- PROGRAM - type STRING
- SERVICE - type STRING
- PDB - type STRING
exec dbms_workload_capture.add_filter(fname=>‘filter_prog1’,fattribute=>‘PROGRAM’,fvalue=>‘%OMS%’);
exec dbms_workload_capture.add_filter(fname=>‘filter_prog2’,fattribute=>‘PROGRAM’,fvalue=>‘%emagent%’);
capture 所有的信息,可以跳过过滤器设置
查询过滤器
select * from dba_workload_filters;
删除过滤器
exec DBMS_WORKLOAD_CAPTURE.DELETE_FILTER(‘filter_user1’);
2.3运行Capture
10g数据库需要开启PRE_11G_ENABLE_CAPTURE
alter system set PRE_11G_ENABLE_CAPTURE=true;
函数:
DBMS_WORKLOAD_CAPTURE.START_CAPTURE (
name IN VARCHAR2,
dir IN VARCHAR2,
duration IN NUMBER DEFAULT NULL,
default_action IN VARCHAR2 DEFAULT ‘INCLUDE’,
auto_unrestrict IN BOOLEAN DEFAULT TRUE,
capture_sts IN BOOLEAN DEFAULT FALSE,
sts_cap_interval IN NUMBER DEFAULT 300);
注意:过滤器默认是排除,如果需要包含过滤器内容,default_action值需要设置为EXCLUDE**。**
Duration单位为秒,设置为NULL时,则captureprocess 必须手工调用FINISH_CAPTURE 过程来结束。
BEGIN
  DBMS_WORKLOAD_CAPTURE.start_capture (name     => 'test_capture_1',
                                       dir      =>'CAPDIR',
                                       default_action=>'EXCLUDE',
                                       duration => NULL);
 END;
/
下面capture运行10分钟,不设置执行时间,可以手工进行停止。
BEGIN
DBMS_WORKLOAD_CAPTURE.START_CAPTURE (
name => ‘test_capture_1’,
dir => ‘CAPDIR’,
duration => 600);
END;
/
2.4 Sql执行
生产数据库运行阶段。
2.5停止 capture
手动停止capture
BEGIN
DBMS_WORKLOAD_CAPTURE.finish_capture;
END;
/
2.6生成文件
capture捕获生成的文件如下:
$ ls -l
total 18252
-rw-r--r--. 1 oracle oinstall 9294509 Feb 25 11:06 wcr_5wp4fn4002vhm.rec
-rw-r--r--. 1 oracle oinstall 9308639 Feb 25 11:06 wcr_5wp4fnc002vhp.rec
-rw-r--r--. 1 oracle oinstall    6495 Feb 25 11:06 wcr_5wp4fnn002vhr.rec
-rw-r--r--. 1 oracle oinstall    1239 Feb 25 11:06 wcr_5wp4g8w002v4q.rec
-rw-r--r--. 1 oracle oinstall   40590 Feb 25 11:06 wcr_cr.html
-rw-r--r--. 1 oracle oinstall   20386 Feb 25 11:06 wcr_cr.text
-rw-r--r--. 1 oracle oinstall     168 Feb 25 11:06 wcr_fcapture.wmd
-rw-r--r--. 1 oracle oinstall      98 Feb 25 11:03 wcr_scapture.wmd
2.7获取capture ID
SELECT DBMS_WORKLOAD_CAPTURE.get_capture_info(‘CAPDIR’) FROM dual;
select id, name, status,dir_path from dba_workload_captures where id = (select max(id) from dba_workload_captures);
SQL> select id, name, status,dir_path from dba_workload_captures where id = (select max(id) from dba_workload_captures);
        ID NAME             STATUS          DIR_PATH
----- ---------------- --------------- -------------------------
         2 test_capture_1   COMPLETED       /home/oracle/capdir
2.8查询捕获信息
可以在捕获路径下获取已生成的报告wcr_cr.html、wcr_cr.text。
select dbms_workload_capture.report ( 2,‘TEXT’) from dual;
SQL> set pagesize 0 long 30000000 longchunksize 2000
SQL> select dbms_workload_capture.report ( 4,'TEXT') from dual;
Database Capture Report For ORCL
DB Name         DB Id    Release     RAC Capture Name               Status
------------ ----------- ----------- --- -------------------------- ----------
ORCL          1560568364 10.2.0.4.0  NO  test_capture_1             COMPLETED
                   Start time: 25-Feb-20 16:59:45 (SCN = 869461)
                     End time: 25-Feb-20 17:08:58 (SCN = 905073)
                     Duration: 9 minutes 13 seconds
                 Capture size: 49.15 KB
             Directory object: CAPDIR
               Directory path: /home/oracle/capdir
      Directory shared in RAC: TRUE
                 Filters used: 1 EXCLUSION filter
Captured Workload Statistics                      DB/Inst: ORCL/  Snaps: 10-11
-> 'Value' represents the corresponding statistic aggregated
      across the entire captured database workload.
-> '% Total' is the percentage of 'Value' over the corresponding
      system-wide aggregated total.
Statistic Name                                   Value   % Total
---------------------------------------- ------------- ---------
DB time (secs)                                    1.77      1.50
Average Active Sessions                           0.00       N/A
User calls captured                                166      1.41
User calls captured with Errors                      1       N/A
Session logins                                      10     83.33
Transactions                                         0      0.00
          -------------------------------------------------------------
Top Events Captured                               DB/Inst: ORCL/  Snaps: 10-11
                  No data exists for this section of the report.
          -------------------------------------------------------------
Top Service/Module Captured                       DB/Inst: ORCL/  Snaps: 10-11
                  No data exists for this section of the report.
          -------------------------------------------------------------
Top SQL Captured                                  DB/Inst: ORCL/  Snaps: 10-11
                  No data exists for this section of the report.
          -------------------------------------------------------------
Top Sessions Captured                             DB/Inst: ORCL/  Snaps: 10-11
                  No data exists for this section of the report.
          -------------------------------------------------------------
Top Events containing Unreplayable Calls          DB/Inst: ORCL/  Snaps: 10-11
                  No data exists for this section of the report.
          -------------------------------------------------------------
Top Service/Module containing Unreplayable Calls  DB/Inst: ORCL/  Snaps: 10-11
                  No data exists for this section of the report.
          -------------------------------------------------------------
Top SQL containing Unreplayable Calls             DB/Inst: ORCL/  Snaps: 10-11
                  No data exists for this section of the report.
          -------------------------------------------------------------
Top Sessions containing Unreplayable Calls        DB/Inst: ORCL/  Snaps: 10-11
                  No data exists for this section of the report.
          -------------------------------------------------------------
Top Events Filtered Out                           DB/Inst: ORCL/  Snaps: 10-11
                                                               Avg Active
Event                               Event Class     % Activity   Sessions
----------------------------------- --------------- ---------- ----------
log file sync                       Commit               34.78       0.13
CPU + Wait for CPU                  CPU                  20.77       0.08
          -------------------------------------------------------------
Top Service/Module Filtered Out                   DB/Inst: ORCL/  Snaps: 10-11
Service        Module                   % Activity Action               % Action
-------------- ------------------------ ---------- ------------------ ----------
orcl           wish8.6@oracle12c (TNS V      55.56 UNNAMED                 55.56
          -------------------------------------------------------------
Top SQL Filtered Out                              DB/Inst: ORCL/  Snaps: 10-11
                 SQL ID     % Activity Event                          % Event
----------------------- -------------- ------------------------------ -------
          8yvup05pk06ca           3.38 CPU + Wait for CPU                2.90
SELECT S_QUANTITY, S_DATA, S_DIST_01, S_DIST_02, S_DIST_03, S_DIST_04, S_DIST_05
, S_DIST_06, S_DIST_07, S_DIST_08, S_DIST_09, S_DIST_10 FROM STOCK WHERE S_I_ID
= :B2 AND S_W_ID = :B1
          88fgqncchy6wg           2.90 CPU + Wait for CPU                2.90
SELECT I_PRICE, I_NAME, I_DATA FROM ITEM WHERE I_ID = :B1
          dqyz792jar7w0           2.90 CPU + Wait for CPU                2.90
INSERT INTO ORDER_LINE (OL_O_ID, OL_D_ID, OL_W_ID, OL_NUMBER, OL_I_ID, OL_SUPPLY
_W_ID, OL_QUANTITY, OL_AMOUNT, OL_DIST_INFO) VALUES (:B9 , :B8 , :B7 , :B6 , :B5
 , :B4 , :B3 , :B2 , :B1 )
          82tfppq8s0dc2           2.42 CPU + Wait for CPU                2.42
UPDATE STOCK SET S_QUANTITY = :B3 WHERE S_I_ID = :B2 AND S_W_ID = :B1
          g5u7xuchhfu62           1.93 CPU + Wait for CPU                1.93
UPDATE WAREHOUSE SET W_YTD = W_YTD + :B2 WHERE W_ID = :B1
          -------------------------------------------------------------
Top Sessions Filtered Out                         DB/Inst: ORCL/  Snaps: 10-11
-> '# Samples Active' shows the number of ASH samples in which the session
      was found waiting for that particular event. The percentage shown
      in this column is calculated with respect to wall clock time
      and not total database activity.
-> 'XIDs' shows the number of distinct transaction IDs sampled in ASH
      when the session was waiting for that particular event
-> For sessions running Parallel Queries, this section will NOT aggregate
      the PQ slave activity into the session issuing the PQ. Refer to
      the 'Top Sessions running PQs' section for such statistics.
   Sid, Serial# % Activity Event                             % Event
--------------- ---------- ------------------------------ ----------
User                 Program                          # Samples Active     XIDs
-------------------- ------------------------------ ------------------ --------
     1643,   31      28.02 log file sync                       18.36
TPCC                 wish8.6@oracle12c (TNS V1-V3)       38/553 [  7%]        0
                           CPU + Wait for CPU                   9.18
                                                         19/553 [  3%]       11
     1635,   26      27.54 log file sync                       16.43
TPCC                 wish8.6@oracle12c (TNS V1-V3)       34/553 [  6%]        0
                           CPU + Wait for CPU                  11.11
                                                         23/553 [  4%]       21
          -------------------------------------------------------------
Top Events (Jobs and Background Activity)         DB/Inst: ORCL/  Snaps: 10-11
                                                               Avg Active
Event                               Event Class     % Activity   Sessions
----------------------------------- --------------- ---------- ----------
log file parallel write             System I/O           26.09       0.10
CPU + Wait for CPU                  CPU                   8.70       0.03
control file parallel write         System I/O            4.35       0.02
log file sequential read            System I/O            3.38       0.01
          -------------------------------------------------------------
Top Service/Module (Jobs and Background Activity) DB/Inst: ORCL/  Snaps: 10-11
Service        Module                   % Activity Action               % Action
-------------- ------------------------ ---------- ------------------ ----------
SYS$BACKGROUND UNNAMED                       43.96 UNNAMED                 43.96
          -------------------------------------------------------------
Top SQL (Jobs and Background Activity)            DB/Inst: ORCL/  Snaps: 10-11
                  No data exists for this section of the report.
          -------------------------------------------------------------
Top Sessions (Jobs and Background Activity)       DB/Inst: ORCL/  Snaps: 10-11
-> '# Samples Active' shows the number of ASH samples in which the session
      was found waiting for that particular event. The percentage shown
      in this column is calculated with respect to wall clock time
      and not total database activity.
-> 'XIDs' shows the number of distinct transaction IDs sampled in ASH
      when the session was waiting for that particular event
-> For sessions running Parallel Queries, this section will NOT aggregate
      the PQ slave activity into the session issuing the PQ. Refer to
      the 'Top Sessions running PQs' section for such statistics.
   Sid, Serial# % Activity Event                             % Event
--------------- ---------- ------------------------------ ----------
User                 Program                          # Samples Active     XIDs
-------------------- ------------------------------ ------------------ --------
     1651,    1      26.09 log file parallel write             26.09
SYS                  oracle@oracle11g (LGWR)             54/553 [ 10%]        0
     1641,    1       6.76 log file sequential read             3.38
SYS                  oracle@oracle11g (ARC0)              7/553 [  1%]        0
                           CPU + Wait for CPU                   2.42
                                                          5/553 [  1%]        0
     1652,    1       6.28 CPU + Wait for CPU                   6.28
SYS                  oracle@oracle11g (DBW0)             13/553 [  2%]        0
     1650,    1       4.35 control file parallel write          4.35
SYS                  oracle@oracle11g (CKPT)              9/553 [  2%]        0
          -------------------------------------------------------------
Workload Filters                                  DB/Inst: ORCL/  Snaps: 10-11
  # Filter Name              Type    Attribute    Value
--- ------------------------ ------- ------------ --------------------------
  1 FILTER_USER1             EXCLUDE USER         TPCC
          -------------------------------------------------------------
End of Report
2.9导出awr报告
exec dbms_workload_capture.export_awr (capture_id => 2);
导出的awr报告可以导入到目标库上,用来做对比,生成compare period report需要。
$ ls -l
total 25656
-rw-r--r--. 1 oracle oinstall 9294509 Feb 25 11:06 wcr_5wp4fn4002vhm.rec
-rw-r--r--. 1 oracle oinstall 9308639 Feb 25 11:06 wcr_5wp4fnc002vhp.rec
-rw-r--r--. 1 oracle oinstall    6495 Feb 25 11:06 wcr_5wp4fnn002vhr.rec
-rw-r--r--. 1 oracle oinstall    1239 Feb 25 11:06 wcr_5wp4g8w002v4q.rec
-rw-r-----. 1 oracle oinstall 7565312 Feb 25 11:17 wcr_ca.dmp
-rw-r--r--. 1 oracle oinstall   10926 Feb 25 11:17 wcr_ca.log
-rw-r--r--. 1 oracle oinstall   40590 Feb 25 11:06 wcr_cr.html
-rw-r--r--. 1 oracle oinstall   20386 Feb 25 11:06 wcr_cr.text
-rw-r--r--. 1 oracle oinstall     168 Feb 25 11:06 wcr_fcapture.wmd
-rw-r--r--. 1 oracle oinstall      98 Feb 25 11:03 wcr_scapture.wmd
2.10查询dba_workload_captures
可以获取到capture ID和capture的snap信息
select id, name from dba_workload_captures;
SQL> select id,AWR_BEGIN_SNAP,AWR_END_SNAP from dba_workload_captures;
         4             10           11
三、迁移数据库
3.1创建directory
上传到目标服务器(RAC各节点目录下数据都要传输)
scp -r /home/oracle/capdir/* 192.168.242.3:/home/oracle/replay/
创建directory
mkdir -p /home/oracle/replay
CREATE OR REPLACE DIRECTORY db_replay_capture_dir AS ‘/home/oracle/replay’;
3.2创建过滤器(可以不用)
创建方式:
exec DBMS_WORKLOAD_REPLAY.ADD_FILTER (fname IN VARCHAR2,fattribute IN VARCHAR2,fvalue IN VARCHAR2);
fattribute可以使用如下:
- USER
- MODULE
- ACTION
- PROGRAM
- SERVICE
- CONNECTION_STRING
按用户创建
exec DBMS_WORKLOAD_REPLAY.ADD_FILTER (‘replay_filter1’,‘USER’,‘TPCC’);
创建了过滤器,该部分内容执行将被过滤掉,不执行。
3.3加载capture日志
使用PROCESS_CAPTURE过程来准备capture logs。
exec DBMS_WORKLOAD_REPLAY.PROCESS_CAPTURE (‘DB_REPLAY_CAPTURE_DIR’);
执行完毕后,会生成wcr_process.wmd,wcr_login.pp, wcr_seq_data.extb, wcr_scn_order.extb , wcr_conn_data.extb等文件。
[oracle@oracle11g pp11.2.0.4.0]$ pwd
/home/oracle/replay/pp11.2.0.4.0
[oracle@oracle11g pp11.2.0.4.0]$ ls -l
total 1600
-rw-r--r--. 1 oracle oinstall   3522 Feb 25 13:14 wcr_calibrate.xml
-rw-r-----. 1 oracle oinstall  12288 Feb 25 13:14 wcr_commits.extb
-rw-r-----. 1 oracle oinstall  12288 Feb 25 13:14 wcr_conn_data.extb
-rw-r-----. 1 oracle oinstall  12288 Feb 25 13:14 wcr_data.extb
-rw-r-----. 1 oracle oinstall 757760 Feb 25 13:14 wcr_dep_graph.extb
-rw-r--r--. 1 oracle oinstall    290 Feb 25 13:14 wcr_login.pp
-rw-r--r--. 1 oracle oinstall     35 Feb 25 13:14 wcr_process.wmd
-rw-r-----. 1 oracle oinstall  12288 Feb 25 13:14 wcr_references.extb
-rw-r-----. 1 oracle oinstall 806912 Feb 25 13:14 wcr_scn_order.extb
-rw-r-----. 1 oracle oinstall  12288 Feb 25 13:14 wcr_seq_data.extb
3.4初始化replay
使用Initializing replay 装载metadata到tables里:
EXEC DBMS_WORKLOAD_REPLAY.initialize_replay (replay_name => ‘replay’, replay_dir => ‘DB_REPLAY_CAPTURE_DIR’);
将数据改成PREPARE REPLAY 模式:
exec DBMS_WORKLOAD_REPLAY.PREPARE_REPLAY();
默认synchronization参数TRUE,按commit数据的顺序在数据库里重新执行一遍sql。
False,不按commit顺序执行,跟实际会有数据分歧。
exec DBMS_WORKLOAD_REPLAY.prepare_replay (synchronization => FALSE);
检查replay的状态:
SQL> set lin 160
SQL> col name for a20
SQL> col status for a20
SQL> select name,status from  dba_workload_replays;
NAME            STATUS
--------------- ----------------------------------------
replay          PREPARE
3.5启动重放客户端
评估客户端需求
wrc MODE=calibrate REPLAYDIR= =/home/oracle/replay
需要多少个客户端,执行多少次
wrc tpcc/tpcc mode=replay replaydir=/home/oracle/replay
可以后台执行
nohup wrc tpcc/tpcc mode=replay replaydir=/home/oracle/replay &
$ wrc system/oracle mode=replay replaydir=/home/oracle/replay
Workload Replay Client: Release 11.2.0.4.0 - Production on Tue Feb 25 13:29:23 2020
Copyright (c) 1982, 2011, Oracle and/or its affiliates.  All rights reserved.
Wait for the replay to start (13:29:23)--等候replay执行
Replay client 1 started (13:30:46)
Replay client 1 finished (13:34:39--完成replay执行
执行之后,replay client 被暂停,并等待start replay 。
3.6执行replay
执行时间跟生产库获取的时间有关
exec DBMS_WORKLOAD_REPLAY.START_REPLAY;
SQL> select name,status from dba_workload_replays;
SQL> exec DBMS_WORKLOAD_REPLAY.START_REPLAY;
PL/SQL procedure successfully completed.
SQL> select id, name, status from dba_workload_replays;
        ID NAME            STATUS
---------- --------------- ----------------------------------------
         11 replay          COMPLETED
初始状态:PREPARE
执行状态:IN PROGRESS
完成状态:COMPLETED
3.7停止replay
如果希望在完成replay 前stop replay过程,调用CANCEL_REPLAY 过程即可。
SQL> exec DBMS_WORKLOAD_REPLAY.CANCEL_REPLAY ();
3.8获取replay报告
select id, name, status from dba_workload_replays;
SQL> set pagesize 0 long 30000000 longchunksize 2000
SQL> spool /home/oracle/replay_report.html
SQL> select dbms_workload_replay.report(replay_id => 11,format => ‘HTML’) from dual;
SQL> spool off
3.9导入capture awr数据
导入Capture AWR data 到测试数据库,可以与replay AWR data做比较,参见3.13.1生成awr比较报告
set serveroutput on
declare
capid number := 0;
BEGIN
capid := DBMS_WORKLOAD_CAPTURE.GET_CAPTURE_INFO(dir =>‘DB_REPLAY_CAPTURE_DIR’);
dbms_output.put_line('capid is ’ || capid);
END;
/
SQL> set serveroutput on
declare
capid number := 0;
SQL>   2    3  BEGIN
  4  capid := DBMS_WORKLOAD_CAPTURE.GET_CAPTURE_INFO(dir =>'DB_REPLAY_CAPTURE_DIR');
  5  dbms_output.put_line('capid is ' || capid);
END;
  6    7  /
capid is 21
上面获取的为capture ID,通过capture ID可以获取掉awr导入到目标库后的虚dbid,查询如下:
--查询出导入awr的dbid
SQL> select dbms_workload_capture.import_awr(capture_id => 21, staging_schema => 'SYSTEM') from dual;
                                                              1247930324
--查询出导入awr的snap id
SQL> select snap_id,dbid,begin_interval_time,end_interval_time from dba_hist_snapshot where dbid=1247930324;

   SNAP_ID       DBID BEGIN_INTERVAL_TIME            END_INTERVAL_TIME
---------- ---------- ------------------------------ ------------------------------
        25 1247930324 2020-02-26T15:09:36Z           2020-02-26T15:13:07Z
        26 1247930324 2020-02-26T15:13:07Z           2020-02-26T15:15:26Z
3.10获取capture信息
SQL> select id, awr_begin_snap, awr_end_snap from dba_workload_captures;
4 10 11
3.11获取replay信息
SQL> select id, awr_begin_snap, awr_end_snap from dba_workload_replays;
11 149 150
3.12比较capture和replay
set serveroutput on
spool /home/oracle/compare_period_report.html
declare
v_rlt clob;
v_replay_id1 number:=61;
v_replay_id2 number:= null;
v_snum number:=1;
v_length number;
v_char varchar2(32767);
begin
dbms_workload_replay.compare_period_report(replay_id1=>v_replay_id1,
replay_id2=>v_replay_id2,format=>'HTML',result=>v_rlt);
v_length:=dbms_lob.GETLENGTH(v_rlt);
while ( v_snum < v_length ) loop
v_char:=dbms_lob.substr(lob_loc=>v_rlt,amount=>32767,offset=>v_snum);
v_snum:=v_snum+32767;
dbms_output.put_line(v_char);
end loop;
end;
/
spool off
3.12.1数据库信息比较
3.12.2变化信息
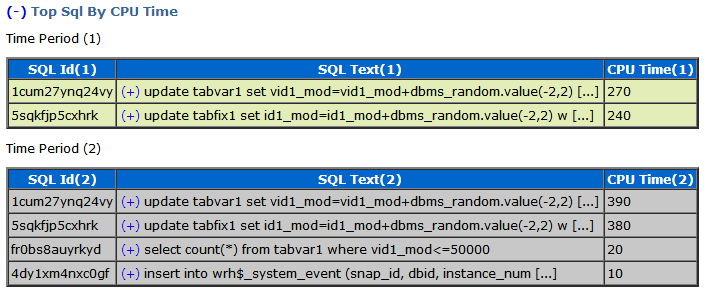
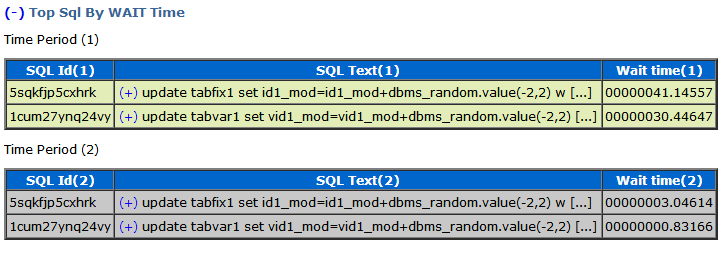
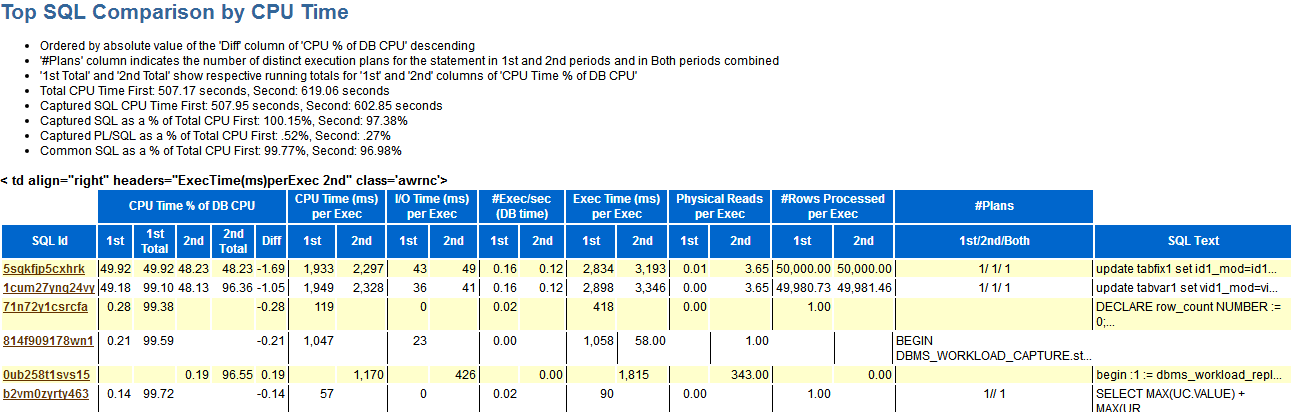
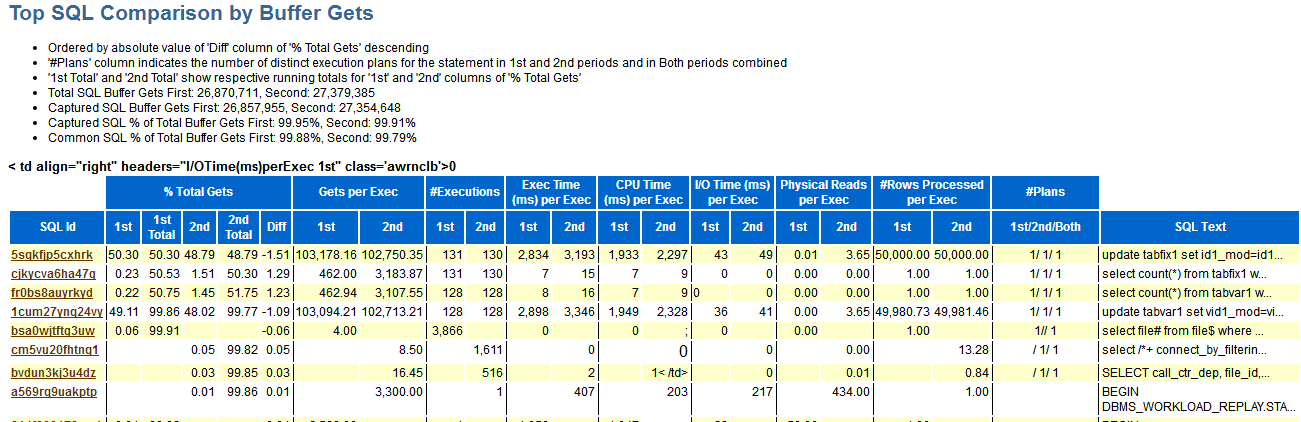
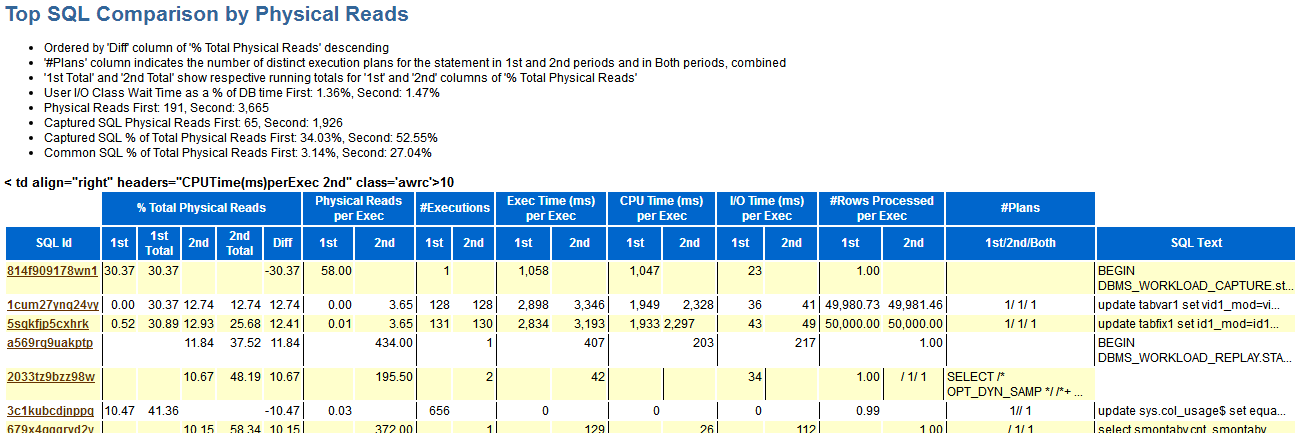
3.12.3Top Sql变化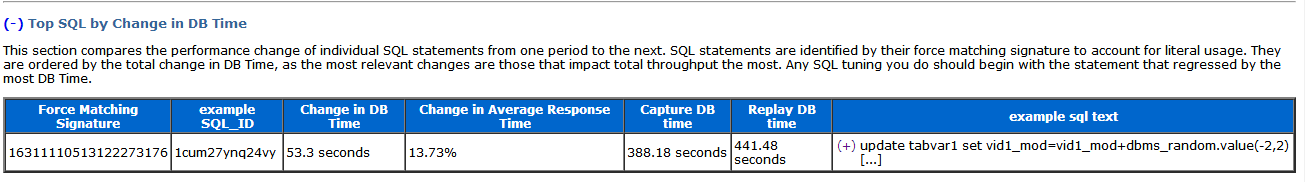
3.12.4硬件信息比较
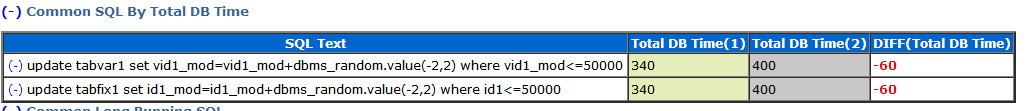
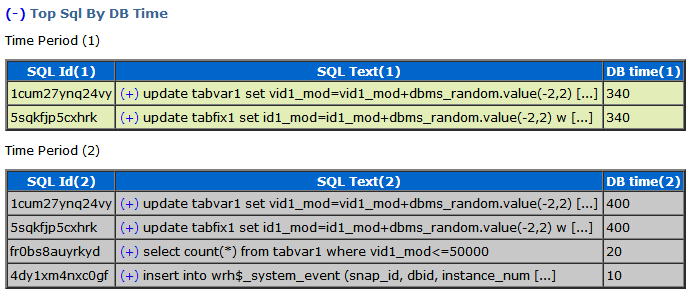
3.12.5运行时间对比信息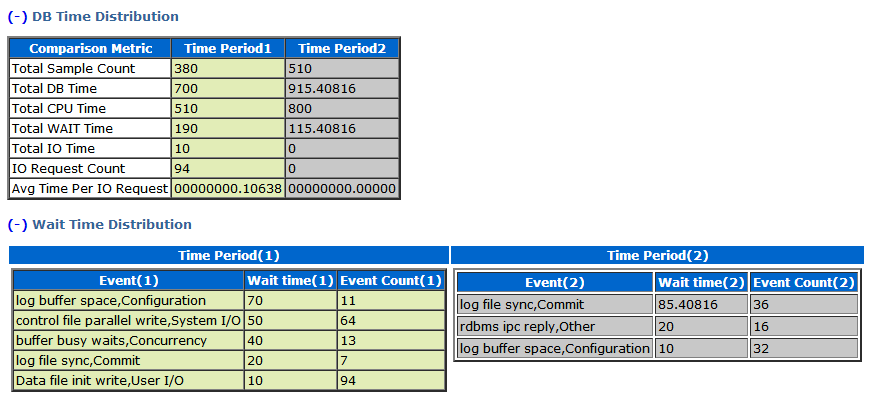
3.13 awr性能比较报告
3.13.1生成awr比较报告
通过当前实例的awr和导入capture awr数据,见3.9导入capture awr数据,获取dbid和snap id,生成awr比较报告。
set pagesize 0 long 30000000 longchunksize 2000 heading off
spool /home/oracle/awrdiff_10g_11g.html
SELECT output FROM TABLE(DBMS_WORKLOAD_REPOSITORY.AWR_DIFF_REPORT_HTML(
dbid1 => 812624484,
inst_num1 => 1,
bid1 => 31,
eid1 => 32,
dbid2 => 1560552774,
inst_num2 => 1,
bid2 => 178,
eid2 => 179));
spool off
3.13.2主机配置比较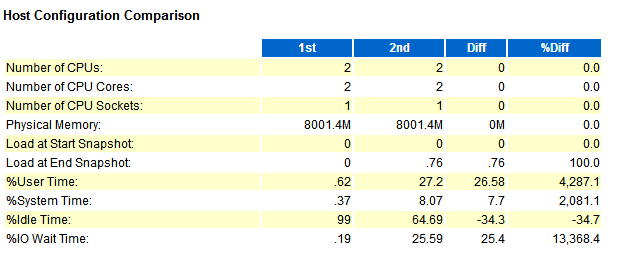
3.13.3数据库内存配置
3.13.4 Load Profile
3.13.5 Top事件
3.13.6 Time Model
3.13.7 Wait Classes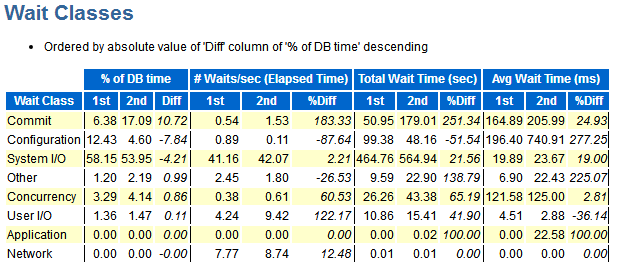
3.13.8 Sql比较

3.14测试完成,删除capture和replay
查询capture ID,并删除capture
SQL> SELECT id, name FROM dba_workload_captures;
        ID			NAME
------------------------------------------------------------------------------
         2			test_capture_1
SQL> exec dbms_workload_capture.delete_capture_info(2);
PL/SQL procedure successfully completed.
查询replay ID,并删除replay
SQL> select id, awr_begin_snap, awr_end_snap from dba_workload_replays;
        ID AWR_BEGIN_SNAP AWR_END_SNAP
---------- -------------- ------------
         1            144          145
        11            149          150
SQL> exec DBMS_WORKLOAD_REPLAY.DELETE_REPLAY_INFO (1);
PL/SQL procedure successfully completed.
SQL> exec DBMS_WORKLOAD_REPLAY.DELETE_REPLAY_INFO (11);
PL/SQL procedure successfully completed.


 220
220


 被折叠的 条评论
为什么被折叠?
被折叠的 条评论
为什么被折叠?
 到【灌水乐园】发言


